REGULAR ARTICLE
Deployable nuclear fleet based on available quantities of uranium
and reactor types –the case of fast reactors started up with
enriched uranium
Anne Baschwitz
*
, Gilles Mathonnière, Sophie Gabriel, and Tommy Eleouet
CEA, DEN/DANS/I-tésé, 91191 Gif-sur-Yvette, France
Received: 19 October 2015 / Received in final form: 11 January 2016 / Accepted: 19 January 2016
Published online: 18 March 2016
Abstract. International organizations regularly produce global energy demand scenarios. To account for the
increasing population and GDP trends, as well as to encompass evolving energy uses while satisfying constraints
on greenhouse gas emissions, long-term installed nuclear power capacity scenarios tend to be more ambitious,
even after the Fukushima accident. Thus, the amounts of uranium or plutonium needed to deploy such capacities
could be limiting factors. This study first considers light-water reactors (LWR, GEN III) using enriched uranium,
like most of the current reactor technologies. It then examines the contribution of future fast reactors (FR, GEN
IV) operating with an initial fissile load and then using depleted uranium and recycling their own plutonium.
However, as plutonium is only available in limited quantity since it is only produced in nuclear reactors, the
possibility of starting up these Generation IV reactors with a fissile load of enriched uranium is also explored. In
one of our previous studies, the uranium consumption of a third-generation reactor like an EPR
TM
was compared
with that of a fast reactor started up with enriched uranium (U5-FR). For a reactor lifespan of 60 years, the U5-
FR consumes three times less uranium than the EPR and represents a 60% reduction in terms of separative work
units (SWU), though its requirements are concentrated over the first few years of operation. The purpose of this
study is to investigate the relevance of U5-FRs in a nuclear fleet deployment configuration. Considering several
power demand scenarios and assuming different finite quantities of available natural uranium, this paper
examines what types of reactors must be deployed to meet the demand. The deployment of light-water reactors
only is not sustainable in the long run. Generation IV reactors are therefore essential. Yet when started up with
plutonium, the number of reactors that can be deployed is also limited. In a fleet deployment configuration, U5-
FRs appear to provide the best solution for using uranium, even if the economic impact of this consumption
during the first years of operation is significant.
1 Introduction
At the current rate at which fuel is consumed, the natural
uranium resources identified so far will be sufficient to meet
our needs for the next 100 years [1]. However, most
organisations in charge of defining energy-related scenarios
consider a considerable increase in international nuclear
power generation to meet the significantly increasing global
energy demand, as well as to comply with climate constraints
to reduce greenhouse gas emissions. Due to the growing
nuclear reactor fleet in many countries, it is assumed that
resources will therefore be depleted more rapidly.
Within the scope of this study, we therefore selected
various global nuclear power deployment scenarios.
These scenarios have been applied to analyse what type
of reactors must be deployed to meet the global demand:
light-water reactors (LWR) using uranium-235 (
235
U) or
fast reactors (FR) using uranium-238. However, a sufficient
amount of plutonium is required to start up FRs and
plutonium is produced in water reactors such as pressurised
water reactors (PWR) (≈1% of the mass of spent fuel). In
the event that no Pu is available, the only solution is to start
up FRs with uranium enriched in
235
U (U5-FR).
This paper first reviews the static comparison of the
total uranium consumption of a LWR with an U5-FR. We
then analyse the advantages provided by such reactors
within a nuclear reactor fleet development configuration.
Therefore, the first part of this paper assesses the
quantities of uranium consumed for the different scenarios
under investigation and according to the reactor types
being developed.
* e-mail: anne.baschwitz@cea.fr
EPJ Nuclear Sci. Technol. 2, 12 (2016)
©A. Baschwitz et al., published by EDP Sciences, 2016
DOI: 10.1051/epjn/e2016-50073-8
Nuclear
Sciences
& Technologies
Available online at:
http://www.epj-n.org
This is an Open Access article distributed under the terms of the Creative Commons Attribution License (http://creativecommons.org/licenses/by/4.0),
which permits unrestricted use, distribution, and reproduction in any medium, provided the original work is properly cited.
In the second part of this paper, different limits are
imposed on the global uranium supply in order to clearly
define the issues related to the necessary resources. The
type of reactor required to meet the demand is clearly stated
for each limit and each scenario.
2 Study conditions
2.1 Prospective scenarios [2]
To carry out this prospective study, we needed to define
assumptions with respect to the evolving energy demand
and the deployable nuclear technologies available within
the century. These assumptions are detailed below.
In the energy field, needs must be defined several years in
advance or even several decades in advance so as to plan the
construction of infrastructures and meet the demand. This
forward-looking approach particularly applies to nuclear
power: firstly, because a reactor is designed to operate for
about 60 years; secondly, because waste management issues,
like partitioning and transmutation, must be assessed.
The “Global Energy Perspective 1998”[3] was a five-
year study conducted jointly by the International Institute
for Applied Systems Analysis (IIASA) and the World
Energy Council (WEC). The goals were to examine long-
term energy perspectives, their constraints, and opportu-
nities by formulating scenarios. There are six scenarios
grouped into three cases, Cases A, B, and C, providing the
energy mix forecast over the 21st century.
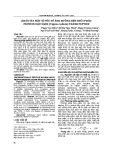
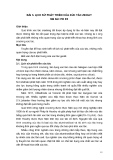
We chose four of them (Fig. 1):
–A2 is a strong global growth scenario of around 2.7% per
year, with the preferred short-term use of oil and gas
resources. Nuclear energy represents 4% of world energy
demand in 2050 and 21% in 2100;
–A3 is also a strong global growth scenario with a more
gradual introduction of nuclear energy than in scenario
A2; nuclear energy represents around 11% of world
energy demand in 2050 and 22% in 2100;
–B is a business-as-usual world growth scenario during the
21st century (around 2% per year);
–C2 is a scenario that has strong intentions to protect the
environment against global warming. It corresponds to a
low global demand, though nuclear energy represents
around 12% of world demand for primary energy in 2050;
this is almost twice as much as it represents today.
The IIASA scenarios consider a strong increase in the
world demand in primary energy. Even if the nuclear power
share is less than 20%, it supposes a rather significant
increase in the nuclear installed capacity.
2.2 GRUS model
The GRUS
1
model using STELLA [4] software was
developed to calculate nuclear power configurations within
various electricity demand scenarios while taking into
account the complexity of the nuclear system (large number
of stocks, flows and variables, numerous interactions, time
scales, and different reactor technologies).
In the model, we defined:
–initial conditions (raw material stocks, kind and number
of reactors and the capacities of facilities);
–key parameters (facility unit costs, cost of resources,
reactor investment and operating costs, and technical
characteristics of reactors);
–electricity demand versus time.
The simulation determined the nuclear fleet required to
meet the yearly electricity demand according to the
available resources and diverse costs.
2.3 Reactor types
Four types of reactors were considered in this study:
–PWRs, which are representative of the current reactors in
service (GEN II);
–EPRs
TM
(Evolutionary Power Reactors), which are
representative of Generation III water reactors (GEN III);
–FRs, which are representative of Generation IV fast
reactors (GEN IV) for which a standard start-up with a
Pu load (Pu-FR) is possible. It will also be possible to
start them up with enriched uranium if no Pu is available
(U5-FR). After several years, such reactors will become
identical to reactors started up with Pu, once they will
have produced the Pu required for their operation.
2.3.1 Technical characteristics
Table 1 lists the reactor characteristics that were taken into
consideration. U5-FRs have the same characteristics as Pu-
FRs in terms of power, load factor and burn-up due to the
fact that they become Pu-FRs after ten years.
Our reactors are generic reactors of large size. For the
FRs, considering the characteristics we have chosen (Pu in
core and breeding gain range), we can say it is like an SFR
with an oxide fuel [5].
Table 2 compares
235
U requirements for EPRs and U5-
FRs.
0
20000
40000
60000
80000
2010 2030 2050 2070 2090 2110 2130 2150
TWh
A2
A3
B
C2
Fig. 1. IIASA scenarios: requested electronuclear generation.
1
GRUS is a French abbreviation which translates as “uranium
resource management with STELLA software”.
2 A. Baschwitz et al.: EPJ Nuclear Sci. Technol. 2, 12 (2016)

2.3.2 Assumptions for introducing fast reactors
In the model, only PWRs are deployed up to 2040.
Thereafter, different assumptions were applied when
introducing new reactors:
–all new reactors are still PWRs (EPR-type) for the whole
century with the once-through option;
–fast reactors (FRs) are installed as long as plutonium is
available. When plutonium is not available, either
PWRs or FRs started up with enriched uranium can be
installed.
3 Uranium consumption
3.1 Consumption comparisons for PWRs and U5-FRs
Certain results presented during the FR13 [7] conference
are recalled in this section.
In this specific case, we have considered an electric
utility intending to build a FR without a sufficient amount
of Pu. At present, the electric utility can decide whether to
build a PWR or a FR started up with enriched uranium. At
the end of the reactor’s service life (60 years), it can be
considered in both cases that the electric utility will have a
sufficient amount of Pu to start-up a new FR. The
necessary amount of Pu corresponds to two cores: the first
core and an equivalent quantity for the first few reloads
until Pu from the first core is extracted and recycled for the
following loads.
Choosing either reactor will lead to the development of
next generation of FRs.
Here, we have considered an open-cycle EPR with the
first core and annual reloads using enriched uranium.
We considered that reloads for a U5-FR were performed
on a 1/5 basis as the remaining fuel stays in the core for
slightly more than 5 years. It is assumed that the cycle lasts
5 years (cooling time after unloading until the manufacture
of a new sub-assembly, which can be loaded into the
reactor). Enriched uranium must therefore be provided for
the first core and the first 5 reloads as the following reloads
will be done with the Pu produced by the FR.
Table 3 specifies the material flows for the different
stages of the fuel cycle under consideration, as well as the
enrichment requirements for the reactor lifespan when
the price of natural uranium is of €100/kg for the reactor’s
entire service life (flows vary depending on the price of
natural uranium through optimisation of the tails assay,
with U
nat
at €100/kg, the optimised content of depleted
uranium is 0.23% of
235
U). Year 0 corresponds to the
year the reactor is commissioned.
Over the reactor’s 60-year lifespan, it can be seen
that the U5-FR uses three times less uranium than the
EPR and requires 60% fewer SWUs. Yet, if we compare
the fuel requirements over the first 7 years of operation,
Table 2.
235
U requirements.
Unit EPR-type PWR
a
U5-FR [6]
235
U enrichment % 4.9 14.4
Mass of
235
U in core Tonnes of
235
U/GWe 3.9 8
Reloading Tonnes of
235
U/GWe/year 0.78 1.4
b
a
We chose the characteristics of the EPR for comparison with an SR (assumptions may differ in relation to Ref. [6]). The figures are
given in relation to an equilibrium cycle.
b
For the first 5 reloads of an U5-FR. The U5 enrichment is given for the first core: it constantly decreases as the U5-FR becomes a Pu-FR.
Table 1. Reactor characteristics.
PWR EPR FR
BG = 0 BG = 0.2
Gross electrical output (GWe) 1.01 1.62 1.45
Efficiency (%) 33 36 40
Burn-up rate (GWd/t) 45 60 123
Mass of heavy metal in core (t) 81 126 51
Load factor (%) 77 90 90
Enrichment in
235
U (%) 3.7 4.9 –
Pu in core (t) –– 12
%Pu in spent fuel (%) 1.17 1.34 23.5 28.2
BG: breeding gain.
A. Baschwitz et al.: EPJ Nuclear Sci. Technol. 2, 12 (2016) 3
the U5-FR uses twice as more natural uranium and 2.5
times more SWUs than the EPR.
3.2 Uranium consumption of a global nuclear
reactor fleet
This section compares the global uranium consumption for
meeting the different nuclear power demand scenarios
described in Section 2.1 according to the reactors being
considered. We have already shown that the nuclear
industry cannot entirely rely on LWRs [8]. However, the
amount of plutonium available for developing the fourth
generation of reactors is also a limiting factor [9].
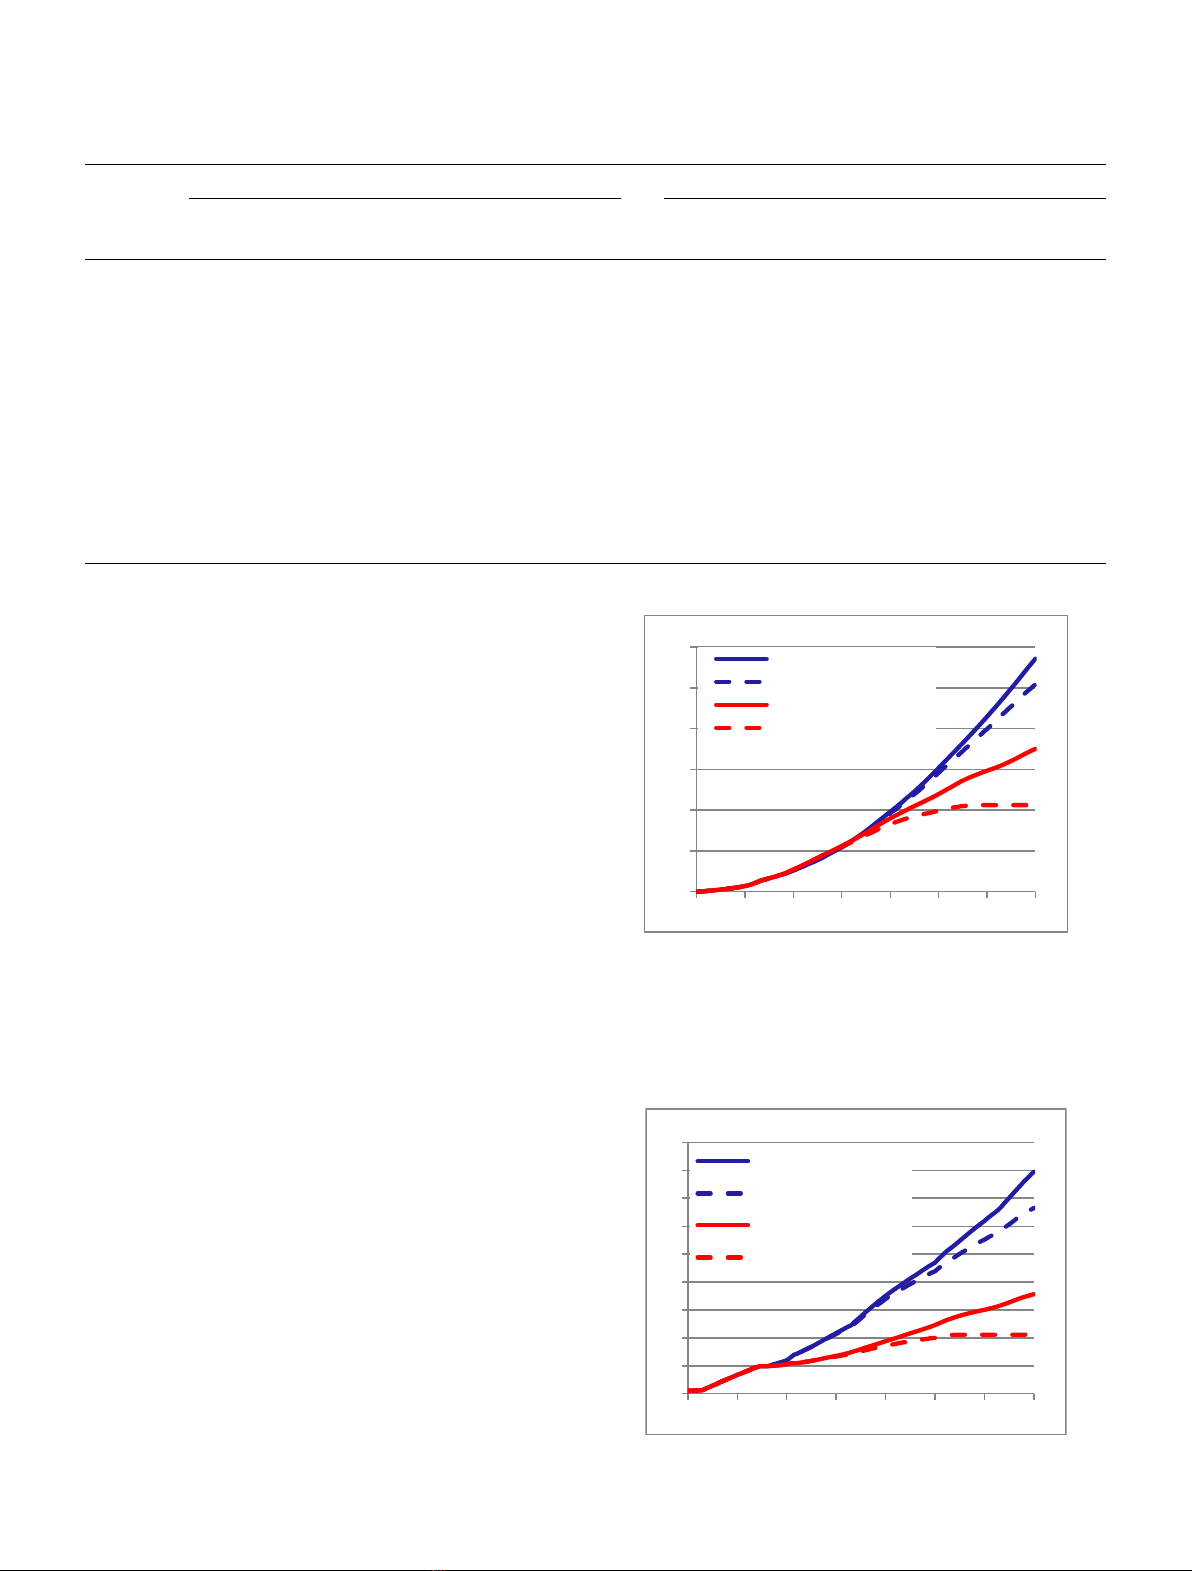
Until 2040, only GEN III reactors are deployed, as it is
considered that GEN IV reactors will only be technically
available as from that date. After, two cases were
considered:
–case 1 in blue: as many Pu-FRs as possible are installed
depending on Pu availability and the fleet is then
completed with EPRs;
–case 2 in red: as many Pu-FRs as possible are installed and
the fleet is then completed with FRs started up with
enriched uranium.
Fast reactors can be self-sufficient reactors (solid line
curves) or breeder reactors with a regeneration gain of 0.2
(dotted line curves).
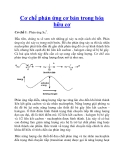
Figure 2 indicates the accumulated uranium consump-
tion for scenario A3.
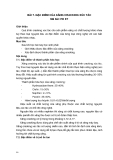
In Figure 3, we have added “committed uranium”to the
consumed uranium, i.e. uranium for the future reloading of
reactors which are currently in operation.
It has been observed that by favouring U5-FRs with
respect to LWRs, it is possible to practically halve the total
consumption of uranium in 2150. With breeder reactors, it
is even possible to stabilise the overall uranium consump-
tion. A sufficient amount of Pu is therefore available to only
develop Pu-FRs.
0
10
20
30
40
50
60
2010 2030 2050 2070 2090 2110 2130 2150
Mt
PWR+ Pu-FR with BG=0
PWR+ Pu-FR with BG=0.2
U5-FR+ Pu-FR with BG=0
U5-FR + Pu-FR with BG=0.2
Fig. 2. Scenario A3 - Total consumed U
nat
.
Table 3. Annual flow of materials (tonnes) and enrichment requirements (million SWU) for 1 GWe.
EPR FR
Year Flow of natural
uranium
MSWU Flow of uranium
enriched at 4.9%
Flow of natural
uranium
MSWU Flow of uranium
enriched at 14.4%
–2 769 0.65 1,628 1.67
–1 154 0.13 80 293 0.30 56
0 154 0.13 16 293 0.30 10
1 154 0.13 16 293 0.30 10
2 154 0.13 16 293 0.30 10
3 154 0.13 16 293 0.30 10
4 154 0.13 16 161 0.17 10
5 154 0.13 16 6
6 to 57 154 0.13 16
58
59
Total 9,844 8.27 1,019 3,256 3.34 111
0
10
20
30
40
50
60
70
80
90
2010 2030 2050 2070 2090 2110 2130 2150
Mt
PWR+ Pu-FR with BG=0
PWR+ Pu-FR with BG=0.2
U5-FR+ Pu-FR with BG=0
U5-FR + Pu-FR with BG=0.2
Fig. 3. Scenario A3 - Total consumed + committed U
nat
.
4 A. Baschwitz et al.: EPJ Nuclear Sci. Technol. 2, 12 (2016)

Tables 4 to 7indicate the total consumption of uranium
(consumed uranium in bold, consumed + committed ura-
nium in italic) for the four different demand scenarios in
2050, 2100 and 2150.
Regardless of the scenario, in 2050, it is observed that
the amount of consumed uranium is slightly greater with
U5-FRs than with EPRs (see Sect. 3.1). The excessive
consumption for U5-FRs at the start of their service life,
compared to EPRs, is thus noted. However, when also
considering committed uranium, uranium savings have
already been observed.
In 2100, savings start to be significant especially in
terms of committed uranium.
In 2150, a significant decrease in the overall uranium
consumption is noted when favouring the development of
U5-FRs and in some situations it is even halved. In some
Table 4. U
nat
consumed and committed to scenario A2 in 2050, 2100 and 2150.
Scenario A2 2050 2100 2150
GR = 0 GR = 0.2 GR = 0 GR = 0.2 GR = 0 GR = 0.2
EPR + Pu-FR 2.5 2.5 20 20 55 51
4.7 4.7 37 36 80 70
U5-FR + Pu-FR 2.7 2.7 16 14 32 19
4.6 4.6 17 15 32 19
Bold: total consumed U
nat
(Mt); italic: total consumed and committed U
nat
(Mt).
Table 5. U
nat
consumed and committed to scenario A3 in 2050, 2100 and 2150.
Scenario A3 2050 2100 2150
GR = 0 GR = 0.2 GR = 0 GR = 0.2 GR = 0 GR = 0.2
EPR + Pu-FR 5.2 5.2 25 24 57 51
12 12 41 39 79 66
U5-FR + Pu-FR 5.4 5.4 21 18 35 21
11 11 22 19 36 21
Bold: total consumed U
nat
(Mt); italic: total consumed and committed U
nat
(Mt).
Table 6. U
nat
consumed and committed to scenario B in 2050, 2100 and 2150.
Scenario B 2050 2100 2150
GR = 0 GR = 0.2 GR = 0 GR = 0.2 GR = 0 GR = 0.2
EPR + Pu-FR 5.0 5.0 21 20 47 42
12 12 35 33 64 53
U5-FR + Pu-FR 5.2 5.2 18 16 29 18
10 10 19 17 30 18
Bold: total consumed U
nat
(Mt); italic: total consumed and committed U
nat
(Mt).
Table 7. U
nat
consumed and committed to scenario C2 in 2050, 2100 and 2150.
Scenario C2 2050 2100 2150
GR = 0 GR = 0.2 GR = 0 GR = 0.2 GR = 0 GR = 0.2
EPR + Pu-FR 3.5 3.5 11 11 22 19
7.4 7.4 18 16 30 23
U5-FR + Pu-FR 3.7 3.7 10 10 15 10
7.0 7.0 11 10 15 10
Bold: total consumed U
nat
(Mt); italic: total consumed and committed U
nat
(Mt).
A. Baschwitz et al.: EPJ Nuclear Sci. Technol. 2, 12 (2016) 5