
JST: Engineering and Technology for Sustainable Development
Volume 35, Issue 2, April 2025, 033-039
33
Energy, Fuel Consumption and Greenhouse Gas Emission
in Food Processing Industry in Big Cities of Vietnam
Dieu-Anh Van, Bich-Thuy Ly, Thu-Huong Thi Hoang*
School of Environmental Science and Technology, Hanoi University of Science and Technology, Ha Noi, Vietnam
*Corresponding author email: huong.hoangthithu@hust.edu.vn
Abstract
Identifying energy consumption trends is difficult as the food processing industry is very fragmented, products
are processed to varying degrees, and production is not always continuous. This study has collated data better
to understand energy consumption across different food processing sectors. Based on energy consumption
data, Greenhouse Gas (GHG) emissions are calculated for direct emissions from fuel usage and
indirect emissions from the use of grid-supplied electricity. Energy figures show that electricity, Liquefied
Petroleum Gas (LPG), and coal are the main energy sources used in the food industry in the big cities of Ho
Chi Minh City (HCMC), Hanoi, and Hai Phong. Patterns of energy sources are different from city to city
depending on the composition of subsectors and the availability of local energy resources. GHG emissions
from the food industry in HCM are estimated to be 22,014,696 tons of CO2-eq, with 98% of these emissions
coming from indirect sources. The figures for Hanoi and Hai Phong are 493,000 and 36,016 tons of CO2-eq,
respectively, with 29% and 49% indirect emissions. The most GHG emission-intensive food industry sub-
sector in HCMC includes processing and preservation of meat products and processing and preservation of
frozen seafood; in Hanoi, it is processing milk and dairy products, and in Hai Phong, it is seafood products
processing and preservation and production of beer and malt. The study proposed three energy-saving
solutions in food processing plants that can be considered: Optimizing the use of existing equipment in
production, innovating and upgrading equipment, and investing in low-carbon energy sources.
Keywords: Electricity and fuel consumption, food industry, GHG emission.
1. Introduction
1
The global food sector consumes around
200 exajoules (EJ) of energy annually, with 45% of
this consumption linked to processing and distribution
activities [1, 2]. This high level of energy use is
directly connected to substantial greenhouse gas
(GHG) emissions and the depletion of natural
resources [1]. Research indicates that food production
is responsible for about 30% of global energy
consumption and emissions from the food and
beverage sector account for approximately 26% of
global emissions, a number that could nearly double by
2050 if current practices persist [3, 4]. The main
sources of GHG emissions in this sector include food
production and processing, transportation, storage,
food waste disposal, the application of chemical
fertilizers and pesticides, and the energy required for
processing and transporting food products.
Vietnam ranks among the top 10 countries
globally in food processing and production and is the
third fastest-growing country in Asia regarding food
and beverage expenditure, contributing 15.8% to the
national gross domestic product (GDP) in 2021. The
food processing industry is a cornerstone of Vietnam's
ISSN 2734-9381
https://doi.org/10.51316/jst.180.etsd.2025.35.2.5
Received: Aug 19, 2024; revised: Sep 27, 2024;
accepted: Oct 28, 2024
economic development, generating over 20% of the
annual net revenue from the processing and
manufacturing industries [5]. The Vietnamese food
industry holds significant potential for growth, driven
by the country’s large population, rising average
incomes, and rapidly increasing consumption trends.
Vietnamese food products, particularly seafood, are
exported to major markets, including the European
Union, Japan, the United States, South Korea, and
Russia. However, the rapid expansion of this industry
has led to various environmental challenges, including
high energy and fuel consumption and increased GHG
emissions.
According to the Nationally Determined
Contribution Report, by 2030, Vietnam must reduce
GHG emissions by 43.5% compared to the
business-as-usual scenario, and by 2050 achieve net
zero emissions [6]. To achieve this goal, the
Vietnamese government, through Decree
06/2022/ND-CP, has set out requirements for GHG
inventory and reporting and GHG reduction for
businesses, including those in the food industry. This
proactive approach from the government reassures us

JST: Engineering and Technology for Sustainable Development
Volume 35, Issue 2, April 2025, 033-039
34
of Vietnam's commitment to environmental
sustainability and the reduction of GHG emissions.
Ho Chi Minh City (HCMC), Hanoi, and Hai
Phong are significant cities with dense populations and
hubs for various industrial activities, including food
production and processing industries. The Ho Chi
Minh City Investment and Trade Promotion Center
identifies the food processing industry as one of the
four key industries prioritized for development in
HCMC. The production capacity of enterprises in this
industry in HCMC satisfies local and domestic market
demands and supports exports to numerous
international markets [7].
Given this context, studies on the current status
of energy and fuel use and GHG emission estimates in
the food industry are crucial. These studies can help
promote the economical and efficient use of energy
and fuel while reducing GHG emissions in Vietnam's
food processing industry, ultimately contributing to
the country's net-zero emissions target. This study
aims to analyze the structure of electricity and fuel
consumption and estimate GHG emissions from
electricity use and fuel combustion in the food industry
in main cities in Vietnam, including HCMC, Hanoi,
and Hai Phong.
2. Material and Method
2.1. Energy and Fuel Data Collection and Source
Energy and fuel data for the food processing
industry in HCMC, Hanoi, and Hai Phong were
sourced from the General Statistics Office's 2020
energy and fuel database. The data were filtered
according to the city code and the industrial sector
codes related to food processing activities.
2.2. GHG Emission Estimation
In this study, food processing plants are classified
as a point source of emissions. Direct emissions of
GHG from the fuel burning and the energy-related
indirect emissions from the use of grid-supplied
electricity in the plants were calculated according to
guideline of The Intergovernmental Panel on Climate
Change (IPCC, 2006). The simple method (Tier 2
approach) was adopted from IPCC (2006) [8],
considering the activity data and emission factors. The
emission factors for CH4 and N2O from fuel
combustion are significantly lower than those for CO2
by 600 to 98,000 times for CH4 and 25,000 to 630,000
times for N2O. As a result, only CO2 emissions are
considered, with CH4 and N2O emissions from fuel
combustion being disregarded.
The direct emission of CO2 from fuel burning in
the food processing plants was calculated according to
the following equation:
𝐸𝑖=∑(𝐴𝑖× 𝜌𝑖× 𝑁𝐶𝑉𝑖)×𝐸𝐹𝑖 (1)
where Ei is the estimated emissions of CO2 (in Gg),
with fuel type (i); Ai is the activity rate, i.e., burnt fuel
by the individual plant in the CO2 emission base year
related to fuel type (i); NCVi is the net calorific
value of fuels (i) burnt by the plant (Table 1); ρi is the
density of the fuel type (i) in Gg/m3; EFi is the CO2
emission factors (in Gg/TJ) of fuel type (i) obtained
from national emission factor (MONRE 2022) [9]
(Table 1).
CO2 emissions associated with electricity
consumption was calculated by the following
equation:
𝐸 = 𝐴 × 𝐸𝐹 (2)
where E is the estimated emissions of CO2 (in Gg)
from electricity consumption in the emission base
year; A is the activity rate relating to electricity
consumption (in GWh) from the individual
plant; EF is the emission factors (in ton/MWh) of CO2
from grid-supplied electricity obtained from
Department of Climate Change (DCC) – MONRE
2024 [10].
Table 1. CO2 Emision Factor (EF) and net calorific value (NCV) of fuels
Energy/Fuel
EF
NCV (TJ/Gg)
Unit
Value
Electricity
ton/MWh
0.6766
Anthracite
Gg/TJ
0.0983
26.7
Other coal
Gg/TJ
0.1120
29.5
Diesel
Gg/TJ
0.0741
43
Other oil
Gg/TJ
0.0774
40.2
LPG
Gg/TJ
0.0631
47.3
Natural gas
Gg/TJ
0.0561
48
Biomass
Gg/TJ
0.1000
11.6

JST: Engineering and Technology for Sustainable Development
Volume 35, Issue 2, April 2025, 033-039
35
3. Results and Discussion
3.1. Electricity and Fuel Usage Structure in Food
Industry in Investigated Area
The electricity and fuel usage structure in food
processing and/or production in Hanoi, Hai Phong, and
HCMC are shown in Table 2 and Fig. 1. In the three
main cities of Hanoi, HCMC, and Hai Phong, where
food and beverage production and processing make up
a significant portion of Vietnam's activities, the
primary energy sources used are electricity, Liquefied
Petroleum Gas (LPG), and coal. According to 2016
fuel consumption data for the national food industry,
coal consumption in this sector of Hanoi, HCMC, and
Hai Phong in 2020 represents only 4% of the national
food industry’s coal usage in 2016, while LPG usage
has increased to 150% of the 2016 levels [11]. Based
on the 2020 energy balance table for Vietnam, coal
used for food industry within these cities represents
only 0.1% of industrial coal consumption, whereas
LPG accounts for 49.6% [12]. This suggests a shift in
the food industry in big cities from the high
GHG-emitting energy source of coal to the lower
GHG-emission potential of LPG. In term of energy
consumption in each locality, HCMC stands out with
a remarkably high usage, reaching 120,777 TJ in 2020.
In contrast, Hanoi's consumption was 6,357 TJ, which
is only about 1/20th of HCMC's figure, while Hai
Phong's consumption was 288 TJ, significantly lower
than HCMC and Hanoi.
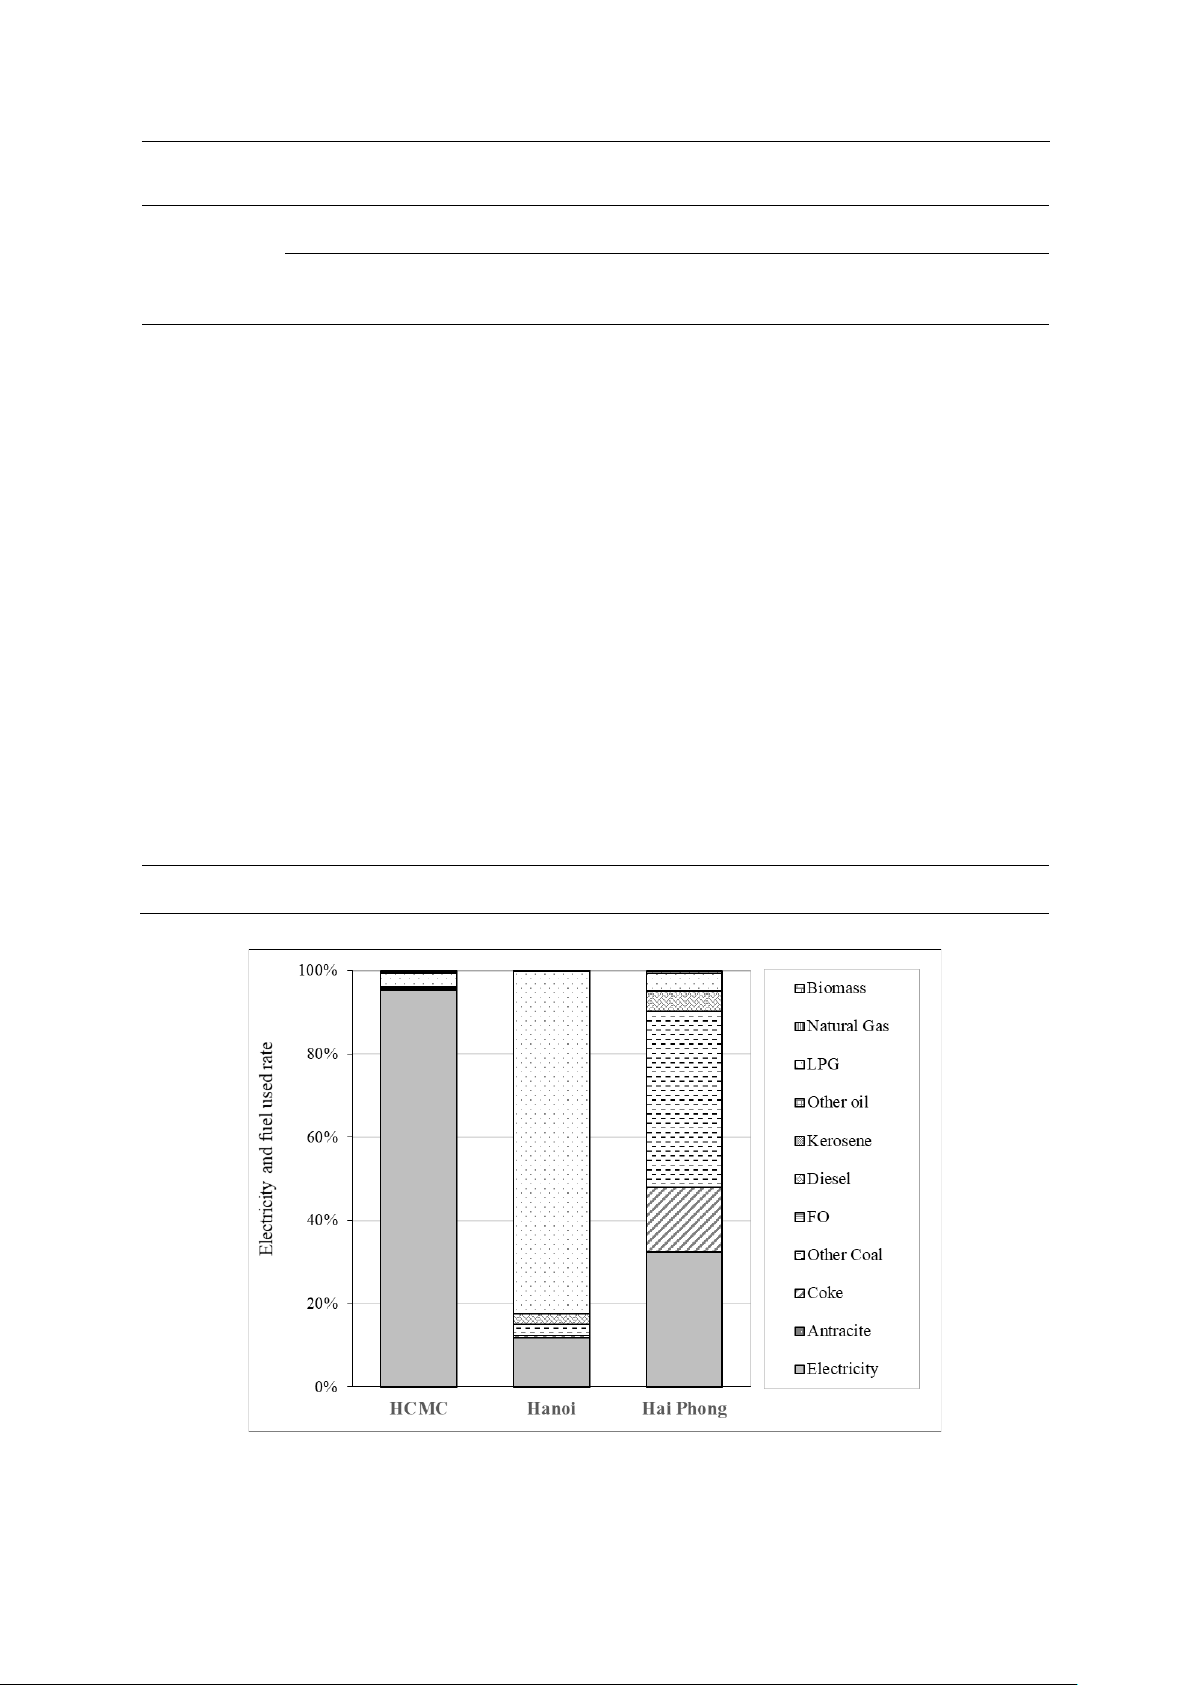
The energy source structure of the three
investigated cities reveals significant differences. In
HCMC, electricity consumption is the dominant force,
accounting for a staggering 95.5% of energy
consumption, with other fuels making up a mere 4.5%.
LPG represents 3.2%, and other fuels represent less
than 0.5%. This underscores the overwhelming
reliance on electricity in HCMC's food production
industry. In contrast, traditional fuels such as coal and
diesel oil have relatively low usage rates, while clean
fuels like LPG are used in larger proportions. Biomass
fuel has also started to be used with a contribution of
0.3%. In Hanoi, LPG is the primary energy source for
the food industry, contributing up to 82% of the total
energy consumption. Electricity is the second largest
energy source, accounting for 12%. Additionally,
Diesel Oil (DO) contributes 3%, while other fuel
sources are nearly negligible.
In Hai Phong, various types of coal are the largest
energy sources, accounting for 58% of the total energy
consumption. Coke coal contributes 16%, and other
types of coal, excluding anthracite, make up 42%. This
is likely due to Hai Phong's proximity to significant
coal supply sources in Quang Ninh. Electricity is the
second-largest energy source, contributing 32%.
Diesel and LPG contribute 5% and 4.3%, respectively.
The differences in energy source structures
across investigated cities can be attributed to the
composition of subsectors and the availability of local
energy resources. Survey results on the distribution of
key food industry subsectors in HCMC, Hanoi, and
Hai Phong show that in HCMC, the processing and
preservation of meat products, processing and
preservation of frozen seafood, the processing and
preservation of meat products, processing and
preservation of frozen seafood, and production of other
food products not classified elsewhere are among the
most energy-intensive sub-sector, accounting for
44.5%, 22.6%, and 18.8% of the total energy used,
respectively. The processing and preservation of meat
products and the processing and preservation of frozen
seafood are two essential sub-sectors in the food
industry that supply the daily consumption needs of the
population. The thermal, refrigerating, and freezing
processes involved in their manufacturing consumed
large proportions of the total processing energy.
Energy and water use have increased due to increased
hygienic standards and cleaning requirements in the
meat and seafood processing sub-sectors.
Additionally, meat and seafood products are
processed - and sometimes over-processed - to a higher
degree for consumer convenience, increasing the
associated energy usage for manufacturing.
In Hanoi, the processing of milk and dairy
products is the main sub-sector, accounting for 76.4%
of the energy consumption of the food industry. For
the remaining subsectors, the energy consumption of
each is below 5% of the total. Dairy processing is
recognized as one of the most energy-intensive sectors
within the food industry [13]. The production of many
dairy products involves concentrating raw milk and
separating its solids to different extents. Electricity is
commonly used to power pumps, refrigeration
systems, control mechanisms, and separation
processes, whereas thermal energy is primarily utilized
for cleaning, evaporation, and pasteurization activities
[14]. In Hanoi, 92% of the LPG used is for the
sub-sector of processing of milk and dairy products,
and the total energy consumption for this sub-sector is
76%.
In Hai Phong, the subsectors of seafood products
processing and preservation and beer and malt
production have the highest energy consumption rates,
accounting for 32% and 30% of the total energy
consumption in the food industry, respectively.
While the food industry in major cities like
HCMC and Hanoi is making strides in transitioning
from traditional, high-polluting fuels like coal and oil
to cleaner alternatives like LPG, there's still untapped
potential. Biomass fuel, which is abundant in HCMC
and its neighbouring areas, presents a significant
opportunity for future energy solutions that should be
further explored.
JST: Engineering and Technology for Sustainable Development
Volume 35, Issue 2, April 2025, 033-039
36
Table 2. Electricity and fuel usage structure in food industry in HCMC, Hanoi and Hai Phong in 2020
Energy/Fuel
Quantity
Energy (TJ)
Unit
HCMC
Hanoi
Hai
Phong
HCMC
Hanoi
Hai Phong
Electricity
MWh
32,013,534
240,451
25,847
115,157
749
93
Anthracite
ton
69
12
-
19
0.3
-
Coke
ton
-
3,068
1,603
-
29
45
Other Coal
ton
19,823
7,941
4,113
484
179
121
Fuel oil (FO)
1000 liter
4,174
17
-
146
0.2
-
Diesel oil
(DO)
1000 liter
8,798
4,591
394
312
162
14
Kerosene
1000 liter
485
3
-
17
0.1
-
Other oil
1000 liter
548
-
-
19
-
-
LPG
ton
81,175
110,629
261
3,839
5,233
12
Natural Gas
1000m3
13,146
-
-
418
-
-
Biomass
ton
31,469
460
152
365
5
2
Sum
-
-
-
-
120,777
6,357
288
Fig. 1. Contribution of electricity and fuels in energy consumption in food industry in big cities
JST: Engineering and Technology for Sustainable Development
Volume 35, Issue 2, April 2025, 033-039
37
3.2. GHG Emission from Food Processing/
Production Facilities in Investigated Area
Estimated direct emissions from fuel combustion
in food production and indirect GHG emissions from
electricity use in the food industry in HCMC, Hanoi,
and Hai Phong in 2020 are presented in Table 3. GHG
emissions in the food industry in 2020 in HCMC,
Hanoi, and Hai Phong are 21,976, 503, and 35 Gg CO2-eq,
respectively. The contributions of direct emissions
from fuel combustion and indirect emissions from
electricity use to GHG emissions vary significantly
across different cities. In HCMC, over 90% of GHG
emissions are indirect emissions from electricity use,
while in Hanoi, direct emissions account for a large
proportion at 71%. In Hai Phong, there is a more
balanced contribution, with direct and indirect
emissions accounting for 51% and 49%, respectively.
In Hai Phong, coal emissions account for 89% of the
total direct GHG emissions.
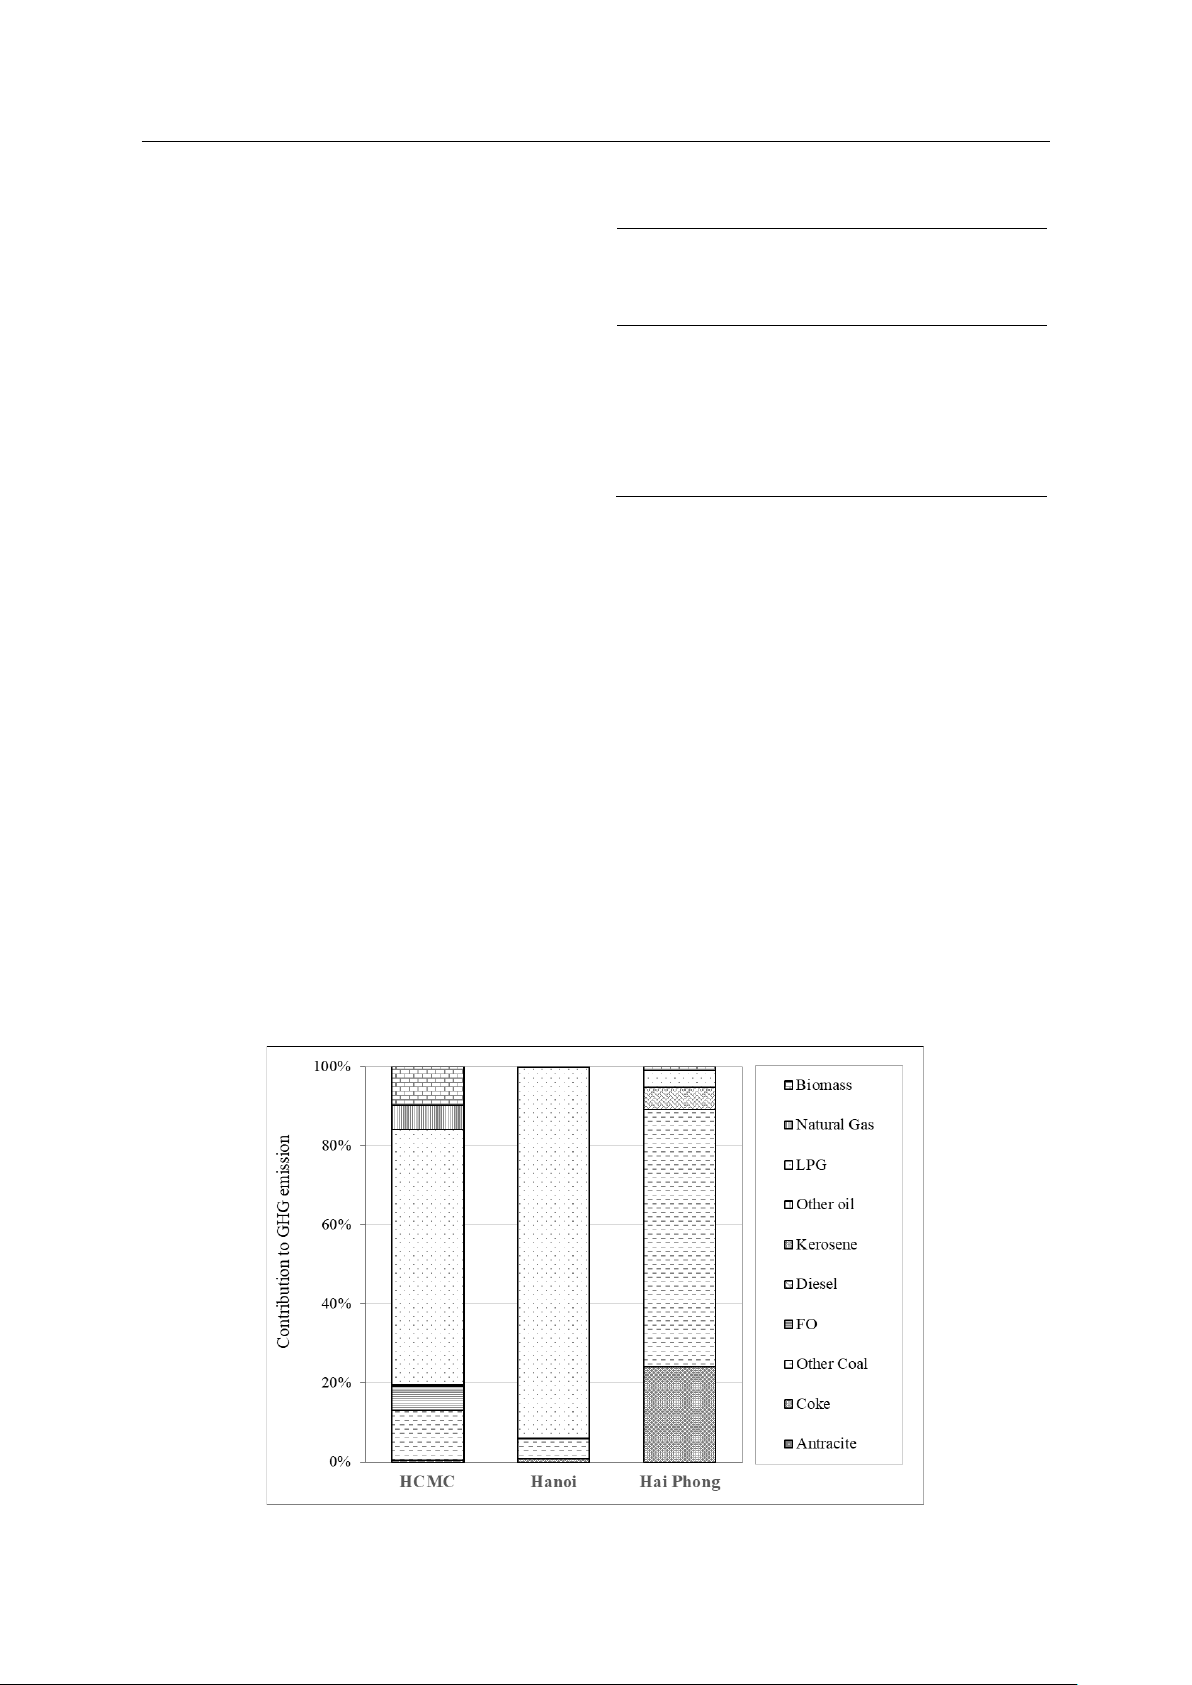
Regarding direct emissions from fuel use in food
production plants (Fig. 2), LPG contributes the most in
HCMC and Hanoi, accounting for 64.4% and 93.7%
of total direct emissions, respectively. In Hai Phong,
coal is the primary contributor to direct emissions,
accounting for up to 89%, and LPG accounts for 4.2%
of the total direct emissions. It can be observed that the
contribution to GHG emissions from different types of
fuels is relatively closely related to the structure of fuel
use: fuels that are used more extensively contribute
more to GHG emissions. However, a detailed
comparison of fuel consumption and GHG emissions
reveals that LPG accounts for 79.5% of total fuel
energy, while coal accounts for 7.7%. This indicates
that LPG has a lower GHG emission rate, whereas coal
has a higher GHG emission rate.
Table 3. Direct and indirect GHG emission from food
industry in HCMC, Hanoi, and Hai Phong in 2020
Cities
Direct
emission
(Gg CO2-eq)
Indirect
emission
(Gg CO2-eq)
Total
(Gg CO2-eq)
HCMC
338
21,638
21,976
Hanoi
362
141
503
Hai
Phong
18
17
36
Compared to the 2016 GHG inventory results for
the food industry, it is evident that by 2020, while the
energy from fuels used in the food sector of HCMC,
Hanoi, and Hai Phong accounted for 16% of the total
fuel energy consumed by the nationwide food industry
in 2016, the corresponding GHG emissions
represented as much as 47%. This discrepancy is
mainly due to the contribution of biomass in the fuel
usage structure. In 2016, biomass provided 76% of the
total energy from fuels in the food industry, while in
2020, biomass consumption in the three investigated
cities accounted for only 3.3% of the fuels used.
According to the Intergovernmental Panel on Climate
Change (IPCC) guidelines, CO2 emissions from
biomass combustion are excluded from GHG
calculations for energy recovery. As a result, GHG
emissions in HCMC, Hanoi, and Hai Phong appear
significantly higher when comparing energy use.
Fig. 2. Contribution of GHG emission from different fuel consumption


![Sổ tay Phòng chống lụt bão [Cập nhật mới nhất]](https://cdn.tailieu.vn/images/document/thumbnail/2025/20250605/vijiraiya/135x160/443_so-tay-phong-chong-lut-bao.jpg)


![Tài liệu Vi sinh vật môi trường [Mới nhất]](https://cdn.tailieu.vn/images/document/thumbnail/2025/20251123/ngkimxuyen/135x160/21891763953413.jpg)
![Sổ tay truyền thông Phân loại chất thải rắn sinh hoạt trên địa bàn tỉnh Quảng Nam [Chuẩn nhất]](https://cdn.tailieu.vn/images/document/thumbnail/2025/20251114/kimphuong1001/135x160/1701763094001.jpg)

![Quản lý chất thải nguy hại: Sổ tay Môi trường [Chuẩn nhất]](https://cdn.tailieu.vn/images/document/thumbnail/2025/20251029/kimphuong1001/135x160/9011761720170.jpg)