
Journal of Mining and Earth Sciences Vol. 6, Issue 2 (2025) 65 - 77 65
Fault seal analysis of fault F2 and its influence on oil
and gas migration for VS prospect area, block 16-
1/15, Cuu Long Basin, Viet Nam
Thanh Van Nguyen1,*, Hung Viet Nguyen1, Son Xuan Pham2, Tam Minh Nguyen1,
Quang Dinh Doan1, Lap Quoc Lai3
1 PVEP-ITC, Hanoi, Vietnam
2 Vietsopetro, Ba Ria - Vung Tau, Vietnam
3 East Sea Stars, Hochiminh City, Vietnam
ARTICLE INFO
ABSTRACT
Article history:
Received 28th Oct. 2024
Revised 10th Feb. 2025
Accepted 5th Mar. 2025
Cross-fault sealing analysis is commonly done by direct and indirect
assessments. The former evaluates fault sealing capacity by analyzing
MICP (Mercury injection capillary pressure) of samples taken directly
from fault zones, which is easy for surface-exposing faults, but difficult to
carry out for subsurface fields. The latter method indirectly evaluates
cross-fault sealing capacity by establishing a relationship(s) of Buoyancy
pressure (BP) or Across fault differential pressure (AFDP) /or Across fault
pressure difference (AFPD) with properties of fault plane such as Shale-
Gouge-Ratio (SGR) and will be applied for this study. Each fault with a
SGR value (higher than the sealing vs non-sealing cut-off) can hold a
certain maximum AFDP value related to a maximum hydrocarbon
column, and the fault will start leaking if the actual hydrocarbon in
formation exceeds the maximum limit. The study’s purpose is to evaluate
fault F2 seal capacity and its influence on oil and gas migration of the
Miocene-Oligocene fault-bounded VS structure in block 16-1/15, Cuu
Long basin, offshore Vietnam. Seismic and petrophysical data are used to
build a 3D structural framework and stratigraphy model in the VS
structure and adjacent areas. The authors will use parameters such as
age, fault throw, Vshale (volume of shale), lithology, bed thickness, burial
depth history, fluid density, and pressures… for fault seal analysis.
Maximum hydrocarbon column height estimation can be held by fault F2
using the empirical relationship between threshold pressure and SGR
(Shale Gouge Ratio), combined with the petroleum system model result
from previous studies to evaluate fault F2’s influence on hydrocarbon
migration into the VS structure, therefore helping to assess the
hydrocarbon potential in undrilled structures in further exploration plan.
Copyright © 2025 Hanoi University of Mining and Geology. All rights reserved.
Keywords:
Faul seal analysis,
Geological restoration,
Hydrocarbon column height,
Migration,
Throw.
_____________________
*Corresponding author
E - mail: Thanhnv1@pvep.com.vn
DOI: 10.46326/JMES.2025.66(2).07

66 Thanh Van Nguyen et al./Journal of Mining and Earth Sciences 66(2), 65 - 77
1. Introduction
The fault seal capacity evaluation according
to the 3D model for the structures in SH5 (Lower
Miocene), SH7 (Oligocene C) and SH8 (Oligocene
D) sediments to serve the assessment
hydrocarbon potential in the VS area and reduce
the risk for further exploration - appraisal work in
block 16-1/15, Cuu Long basin. The analogs from
the drilled structures will also be used to
extrapolate and reduce uncertainties for the
undrilled structures. VS prospect is a 3 way-
closure structure, bounded by fault F2 in the study
area. This research aims to determine the seal
capacity of the bounding fault F2, identify
potential leak points/ weak points on the fault F2
plane; estimate the theoretical maximum HC
column height that can be held by the fault; and
restore the activation history of this fault to
evaluate the relationship between sealing
capacity and migration through time, also help to
analyse the hydrocarbon potential in the VS
structure.
2. Geological setting
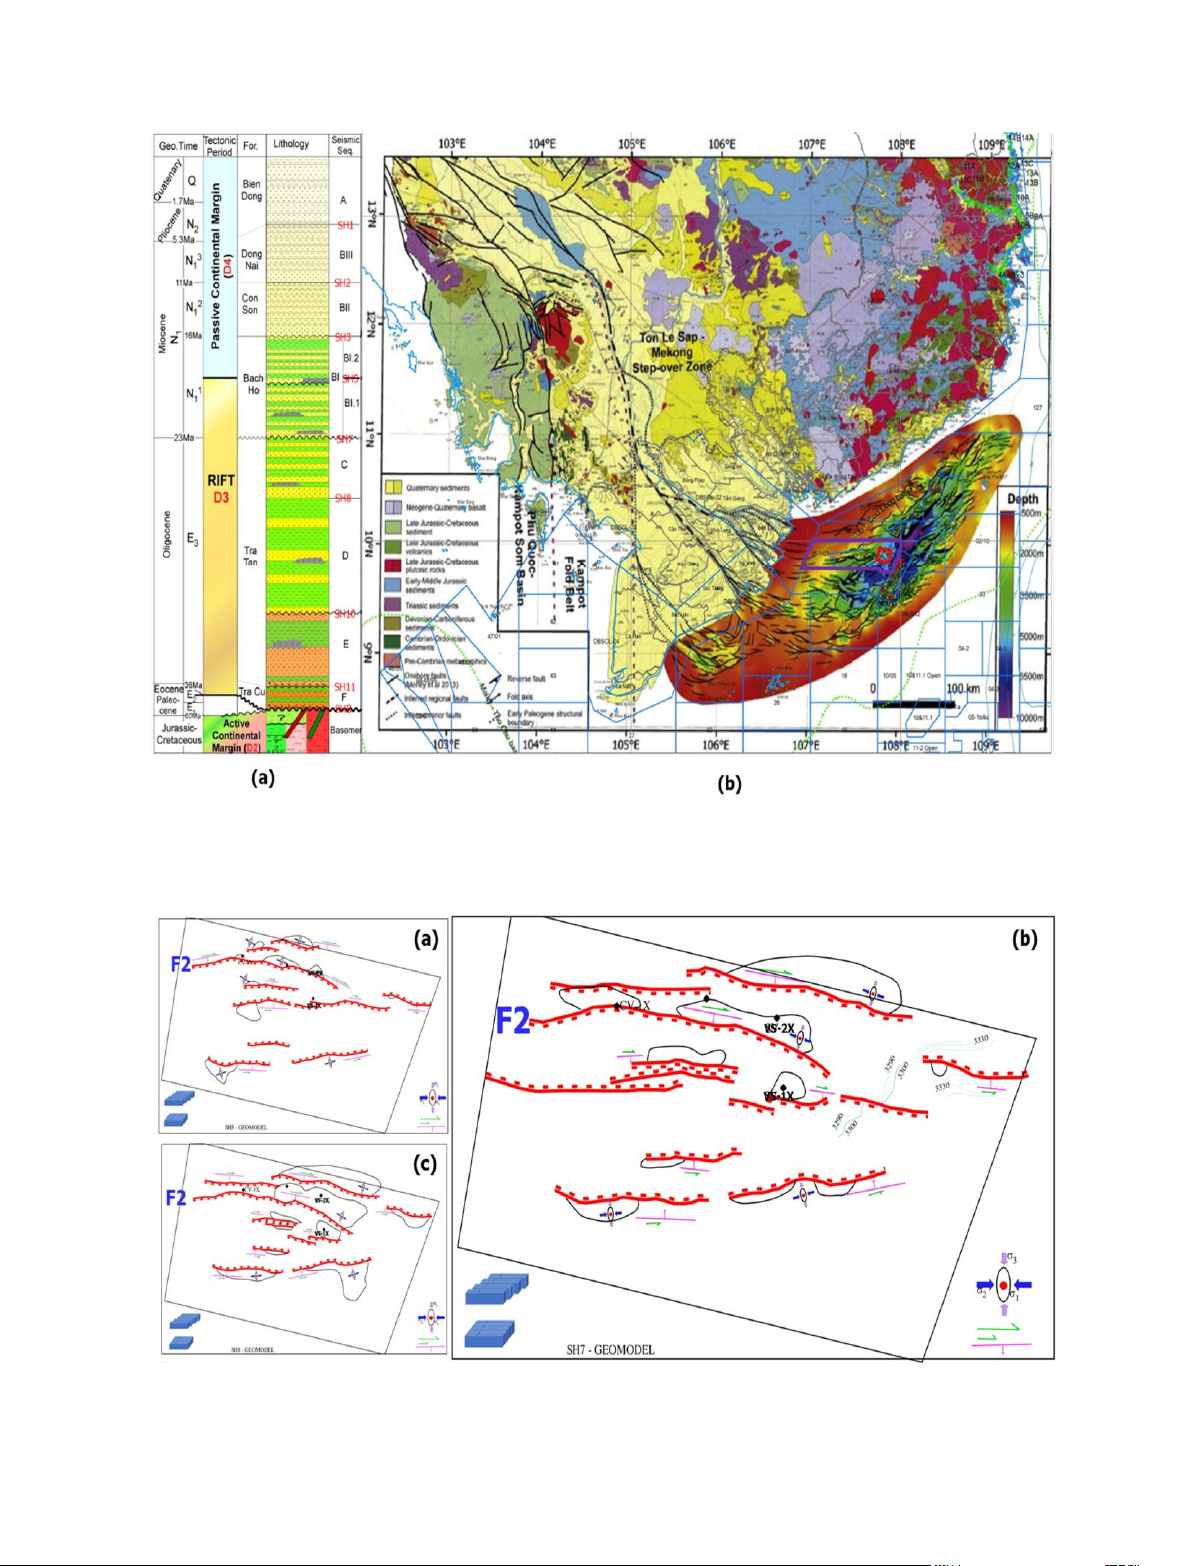
Block 16-1/15 is located in the southwestern
part of the Cuu Long Basin, offshore of the
Vietnamese continental shelf. Its geological
development history is closely tied to the
characteristics of the basin. The comprehensive
stratigraphic column of the Cuu Long Basin and
the tectonic map of the region are depicted in
Figures 1a and b, with the VS study area situated
to the east of Block 16-1/15 (Figure 1b) (Schmidt
et al., 2019).
In terms of stratigraphic characteristics,
starting from the oldest to the youngest, the
studied area comprises Pre-Tertiary basement
and Kainozoic sedimentary deposits, as shown in
Figure 1a. The basement rocks in Block 16-1/15
mainly consist of Type S granite, including biotite
and two-mica granites, as well as Type I granite
granodiorite containing hornblende and biotite.
The Kainozoic sedimentary deposits encompass
sedimentary formations ranging in age from the
Eocene epoch to the present and are divided into
five stratigraphic units. In the seismic section, the
geological formations are elaborately interpreted
corresponding to the reflection layers from SHB,
SH11, SH10, SH8, SH7, SH5, SH3, SH2, and SH1
(Figure 1a).
The tectonic evolution of the studied area can
be divided into three main periods: pre-rift
period, rift (extensional) period leading to basin
formation from the Eocene to the late Oligocene,
and late Oligocene to early Miocene compression
and thermal subsidence (Nguyen, 2007; Schmidt
et al., 2019; Lee et al., 2001; Tuan et al., 2021; Fyhn
et al., 2009).
The petroleum system in the Block 16-1/15
area has been demonstrated by hydrocarbon
discoveries, most notably the VS discovery. The
oil-bearing reservoirs have been found in the
Miocene interval (BI.1 & BI.2 corresponding to
SH3 & SH5), the Oligocene interval (C & D
corresponding to SH7 & SH8), and the basement
interval (SH-B). The gas-bearing reservoirs have
been discovered in the Oligocene E & D intervals.
This study primarily focuses on the sedimentary
deposits from SH5 to SH8 (Figure 2, Figure 3)
(Dam & Quang, 2015; Bojesen-Koefoed et al.,
2009).
3. Methodology
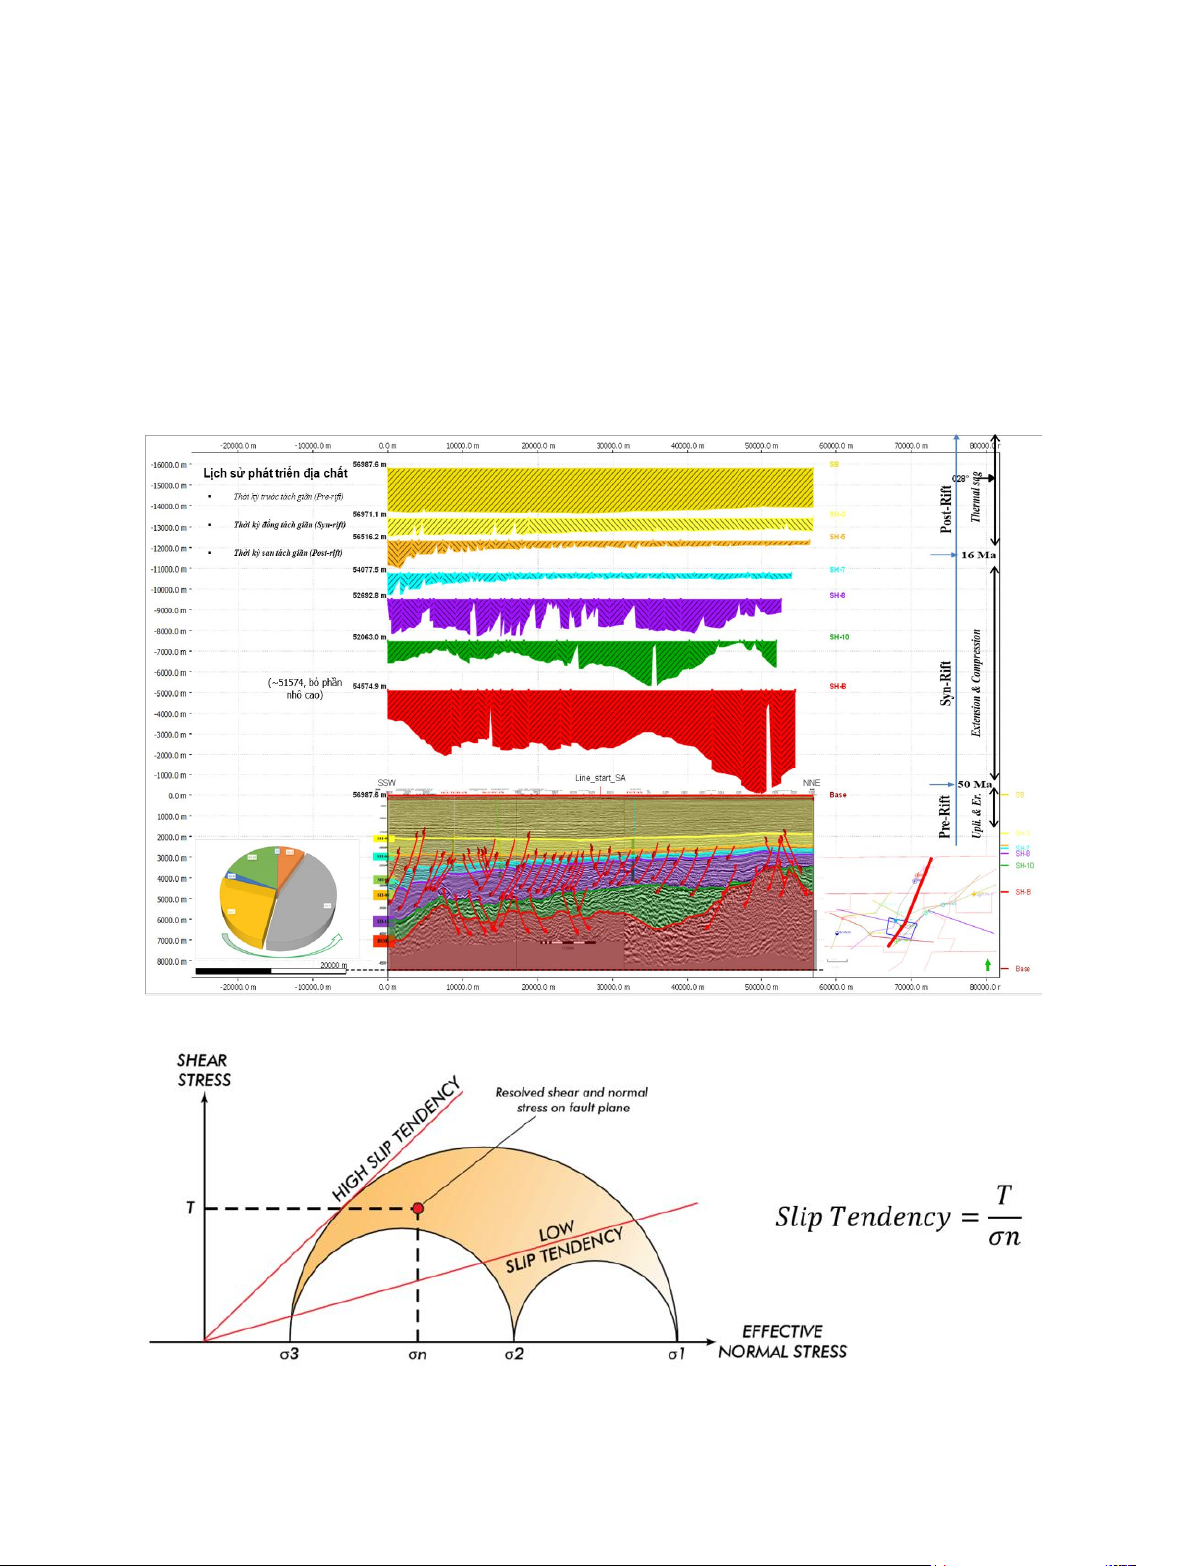
In this paper, we use an interpreted seismic
section to make section analysis and a balanced
cross-section. Then, we combined previous
petroleum system modeling results and fault seal
analysis results to evaluate the target fault and its
influence on oil and gas migration.
Second, we use Slip Tendency as a parameter
to evaluate Fault reactivation potential. Faults
that have been critically stressed or reactivated
following hydrocarbon charge are more likely to
act as conduits for fluid flow (Sibson, 1994).
Consequently, a fault prone to reactivation may
provide a poor baffle to flow despite having
favourable juxtaposition and membrane seals.
Stress Analysis calculates the effective shear and
normal stresses acting on a 3D surface for a user-
defined triaxial stress state. The resultant values
can be combined with pore pressure changes to
quantify the reactivation potential of a fault. In
total, six parameters can be applied in Move to
evaluate the probability of fault reactivation and
seal breach. Slip Tendency is often the most
commonly applied parameter in fault seal
analysis (Morris et al., 1996; Mildren et al., 2005).
Thanh Van Nguyen et al./Journal of Mining and Earth Sciences 66(2), 65 - 77 67
Figure 2. The general stratigraphic column (a) and the structural map with major structural
components (b) of the Cuu Long basin. The study area is red box highlighted in block 16-1/15
(purple line).
Figure 2. Fault F2 location on geomodel map of the VS area: a-based on the SH5 map; b- based on
the SH7 map and c- based on the SH8 map.
68 Thanh Van Nguyen et al./Journal of Mining and Earth Sciences 66(2), 65 - 77
Slip Tendency is the ratio of effective shear
stress (Т) to normal stress (σn). Greater values
indicate a higher slip tendency and, therefore, a
higher probability of fault reactivation. The
calibration process suggests the critical value of
0.6, above this value, a fault will slip, thus
breaching the seal and providing a potential
conduit for fluid flow (Cotesta et al., 2007) (Figure
4).
Nowadays, there are two commonly used
methods worldwide to assess the sealing
capability of faults. The first method is a direct
approach that involves evaluating the sealing
capacity of faults by sampling from fault zones
and conducting studies on pressure (MICP -
Mercury injection capillary pressure) and mineral
analysis. This method can be easily implemented
if mines or outcrops are exposed on the surface.
However, the challenge when applying this
method to underground mines occurs due to
insufficient data or a lack of core samples from
fault zones for estimating the sealing capability.
Figure 3. Section analysis through study area.
Figure 4. Mohr circle illustrating the calculation of Slip tendency. The red point represents the
resolved stress on one triangle of a fault mesh surface.
Thanh Van Nguyen et al./Journal of Mining and Earth Sciences 66(2), 65 - 77 69
Therefore, the second method, which is the
most widely used for assessing fault sealing, is
indirect. This method establishes a relationship
between pressure (Bp - Bouyancy pressure/AFDP
- Across fault difference pressure) and sealing
properties on fault surfaces, such as SGR (Shale
Gouge Ratio), in different reservoirs under the
same geological conditions (Yielding et al., 2010;
Yielding, 2015; Bretan et al., 2003; Lindsay et al.,
1993; Fulljames et al., 1997). The distribution of
pressure and SGR values from all fields in the area
will fall below a defined threshold (seal & non-
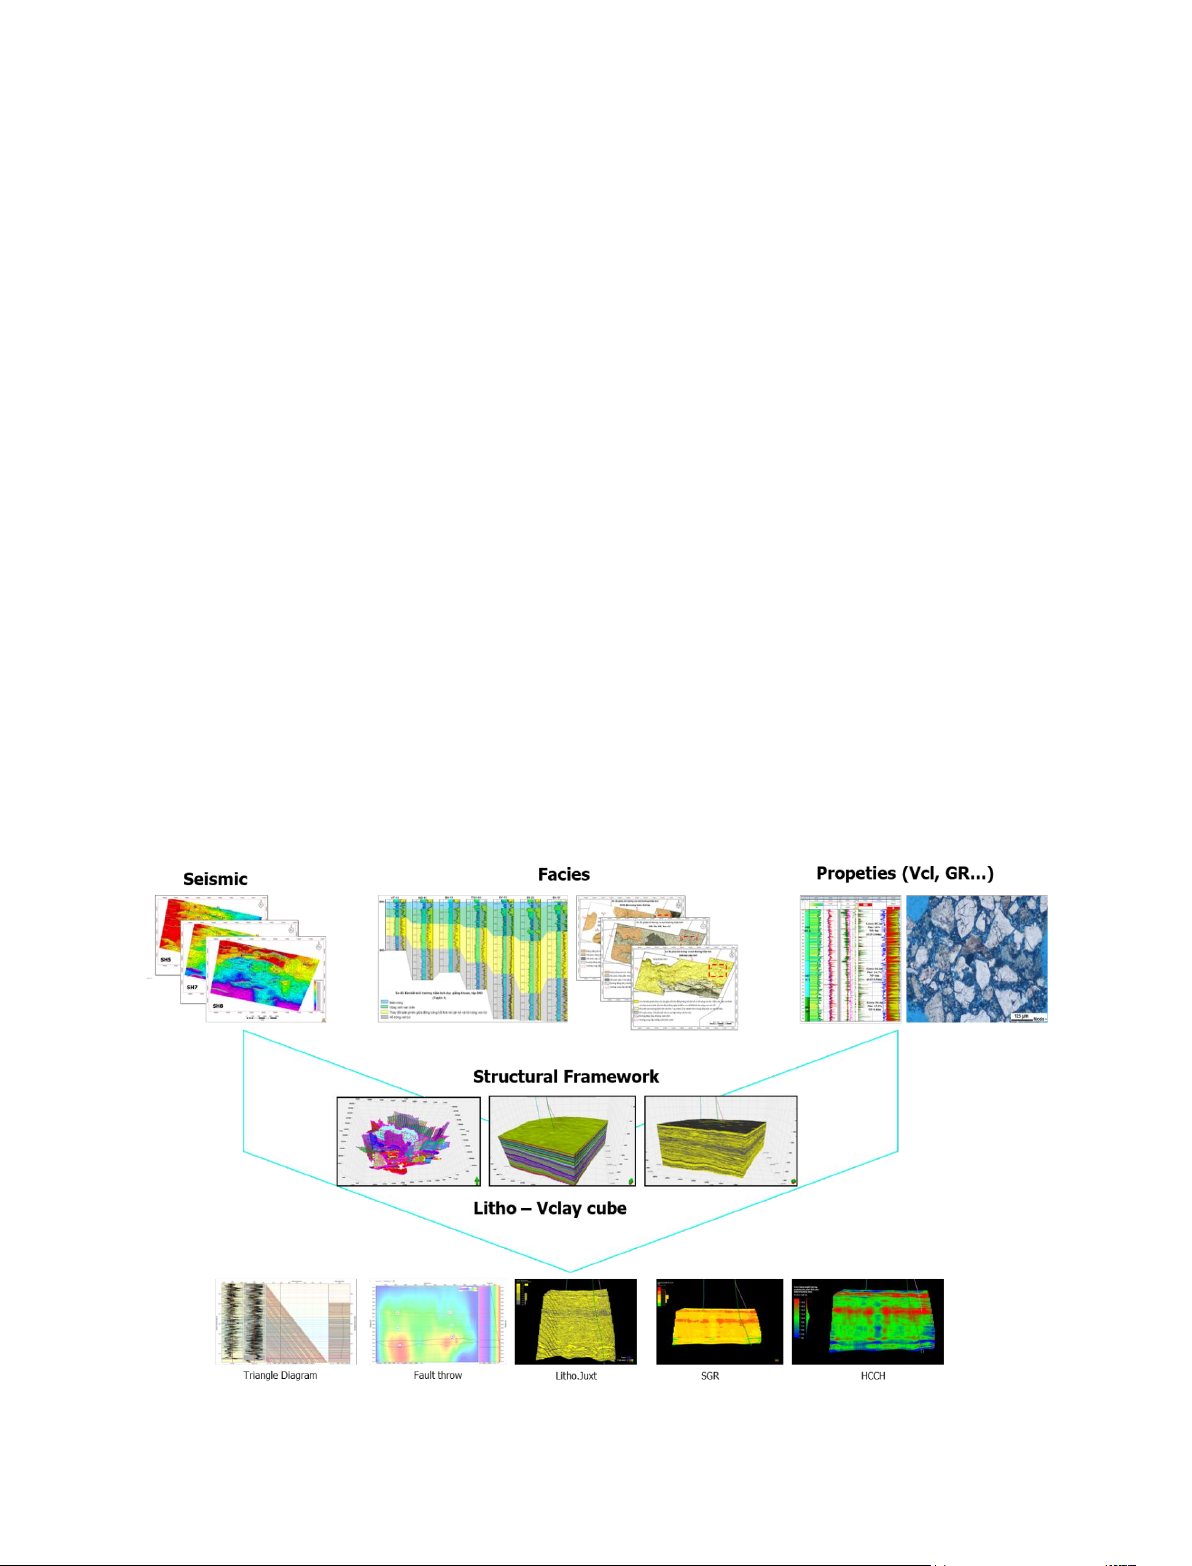
seal). This report will use the second method to
assess the sealing capability of faults, with the
research steps illustrated in Figure 5. More details
of these methods are represented in our previous
paper (Hung et al., 2023).
4. Fault seal analysis for F2 and its influence on
oil and gas migration
The research results on the fault sealing
properties include two parts: 3D Vcl model, 3D
lithological model, and extracted attributes
(displacement amplitude, shale gouge ratio, clay
smear potential, estimated maximum
hydrocarbon column height, etc.) of each fault in
the study area.
The model is built based on input data
including three wells (VS-1X, VS-2X, CV-1X),
reservoir correlations, structural maps (SH3,
SH3_Intra ... SH8_Intra1), and fault system (53
stick faults) that includes 11 selected faults for
assessing their sealing potential. Instead of using
a layered cake sand-shale model like some
previous studies, a fabric distribution model
(lithological model) is constructed for two facies
(sand/shale) defined by a cut-off criterion of shale
content (Vshale <50%). The facies distribution
model is oriented based on seismic attribute
information. The distribution model of shale
content (Vshale) is constructed with orientation
derived from the facies model. The model's results
are reliably evaluated using the available input
data for fault sealing assessment.
Fault F2 is located in the northern part of the
150 km2 VS area. It is a fault with a length of over
10 km, trending in the NNW-SSE direction and
dipping towards the ENE with an average angle of
48 degrees, ranging from 30 to 60 degrees (Figure
6). The fault exhibits the maximum throw of 186
m at the SH8 level, approximately 132 m at SH7,
around 70 m at SH5, and 20m at SH3 (Figure 7).
Figure 5. Workflow for fault seal analysis.


![Quy hoạch tổng thể Cà Mau: Tài liệu [mới nhất/chuẩn nhất]](https://cdn.tailieu.vn/images/document/thumbnail/2025/20250827/tghong1621@gmail.com/135x160/49401756278390.jpg)


![Bài giảng Hàng hải địa văn [chuẩn nhất]](https://cdn.tailieu.vn/images/document/thumbnail/2025/20250729/vijiraiya/135x160/43361753782101.jpg)
![Bài giảng Trắc địa cơ sở [mới nhất]](https://cdn.tailieu.vn/images/document/thumbnail/2025/20250729/vijiraiya/135x160/84_bai-giang-trac-dia-co-so.jpg)


![Atlas tài nguyên nước Việt Nam: Tài liệu [Mô tả/Hướng dẫn/Chi tiết]](https://cdn.tailieu.vn/images/document/thumbnail/2025/20250715/vijiraiya/135x160/348_tai-lieu-atlas-tai-nguyen-nuoc-viet-nam.jpg)
![Hệ thống câu hỏi ôn tập Vùng kinh tế [chuẩn nhất]](https://cdn.tailieu.vn/images/document/thumbnail/2025/20250709/kimphuong1001/135x160/76921752140578.jpg)
