Section on Special Construction Engineering - Vol. 07, No. 01 (Jun. 2024)
100
DEVELOPING THE COMBINED KALMAN-EMD ALGORITHM
TO PROCESS BLASTING SHOCKWAVE SIGNALS
PROPAGATING IN A WATER MEDIUM
Tung Lam Vu1,*, Duc Viet Tran2, Ngoc Lam Bui3, Trong Thang Dam1
1
Institute of Techniques for Special Engineering, Le Quy Don Technical University, Hanoi, Vietnam
2
General Department of Defence Industry, Hanoi, Vietnam
3
X28 Factory, Haiphong, Vietnam
Abstract
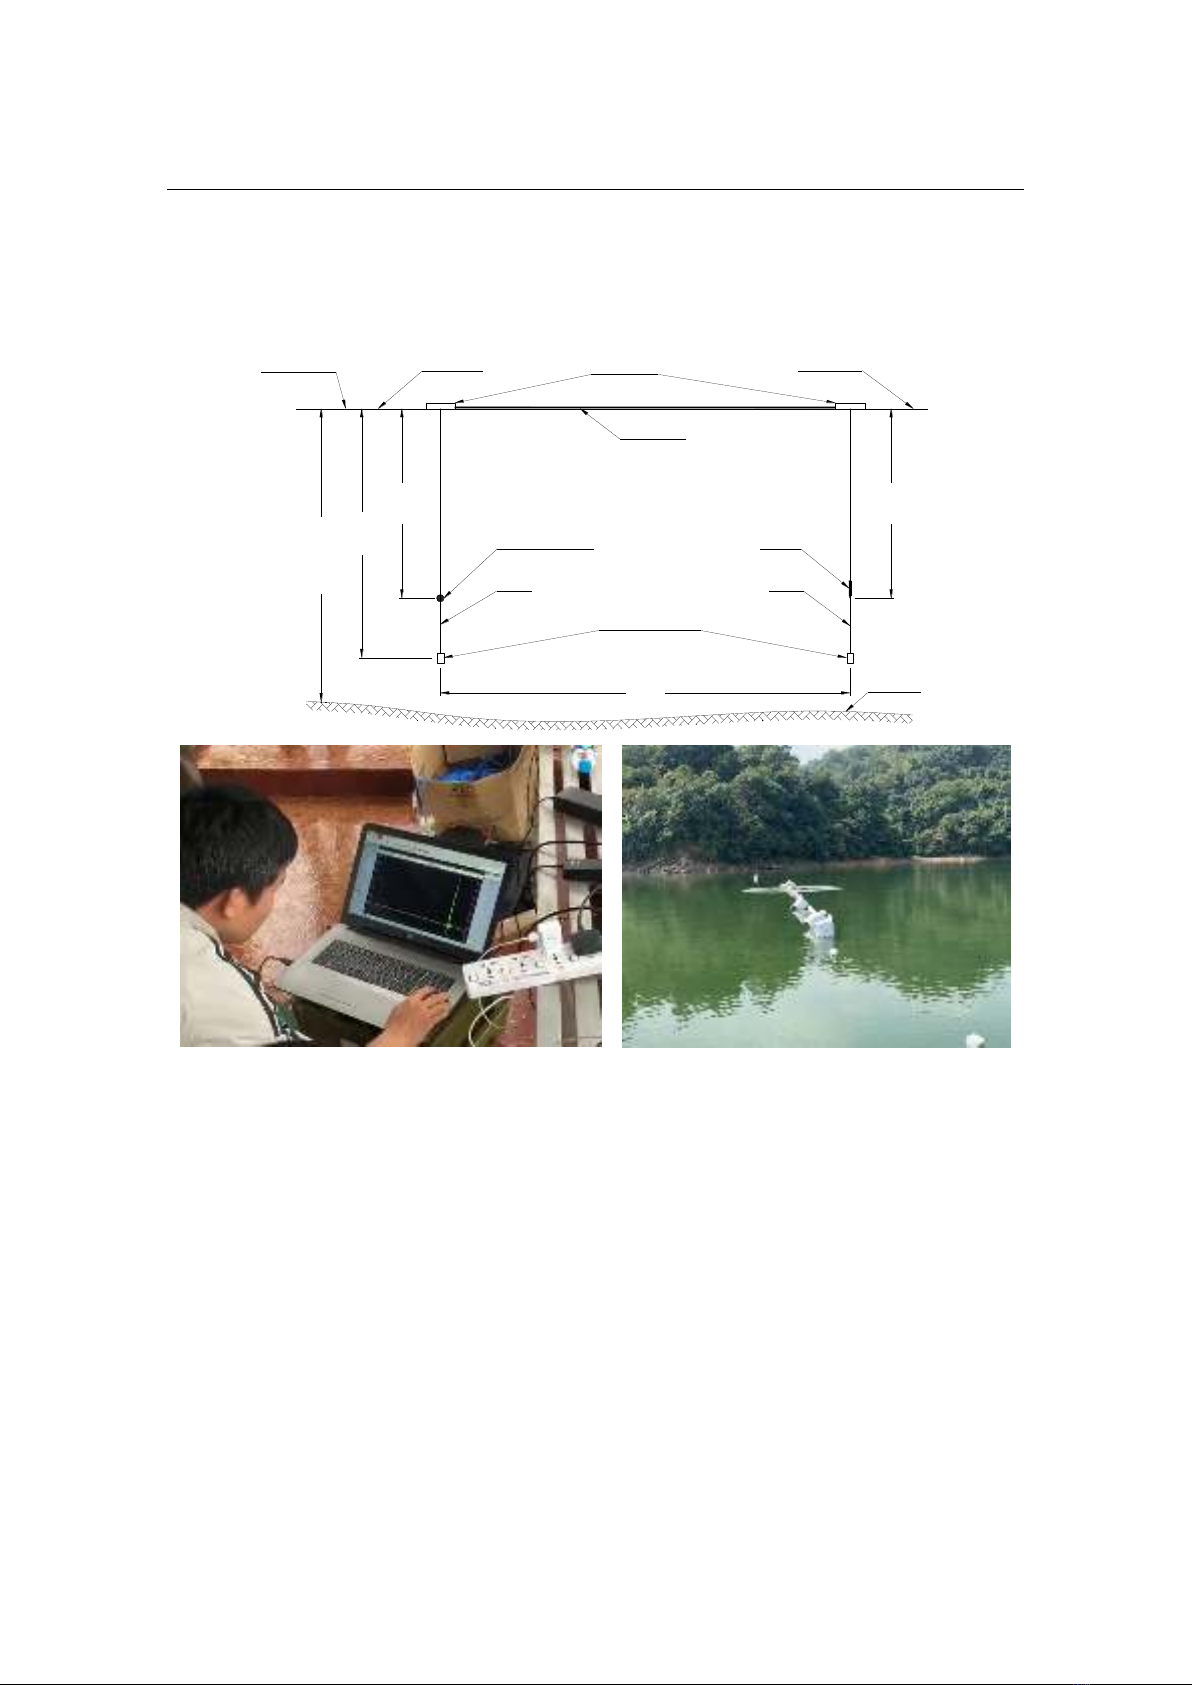
In experiments deploying underwater blast sensors, measured data is always disturbed,
expressed as analog peaks in the obtained signal form. Except for pressure peak pmax, other
parameters of an underwater explosion such as positive impulse I+, positive phase duration
τ+, negative impulse I- and negative phase duration τ- are difficult or almost impossible to
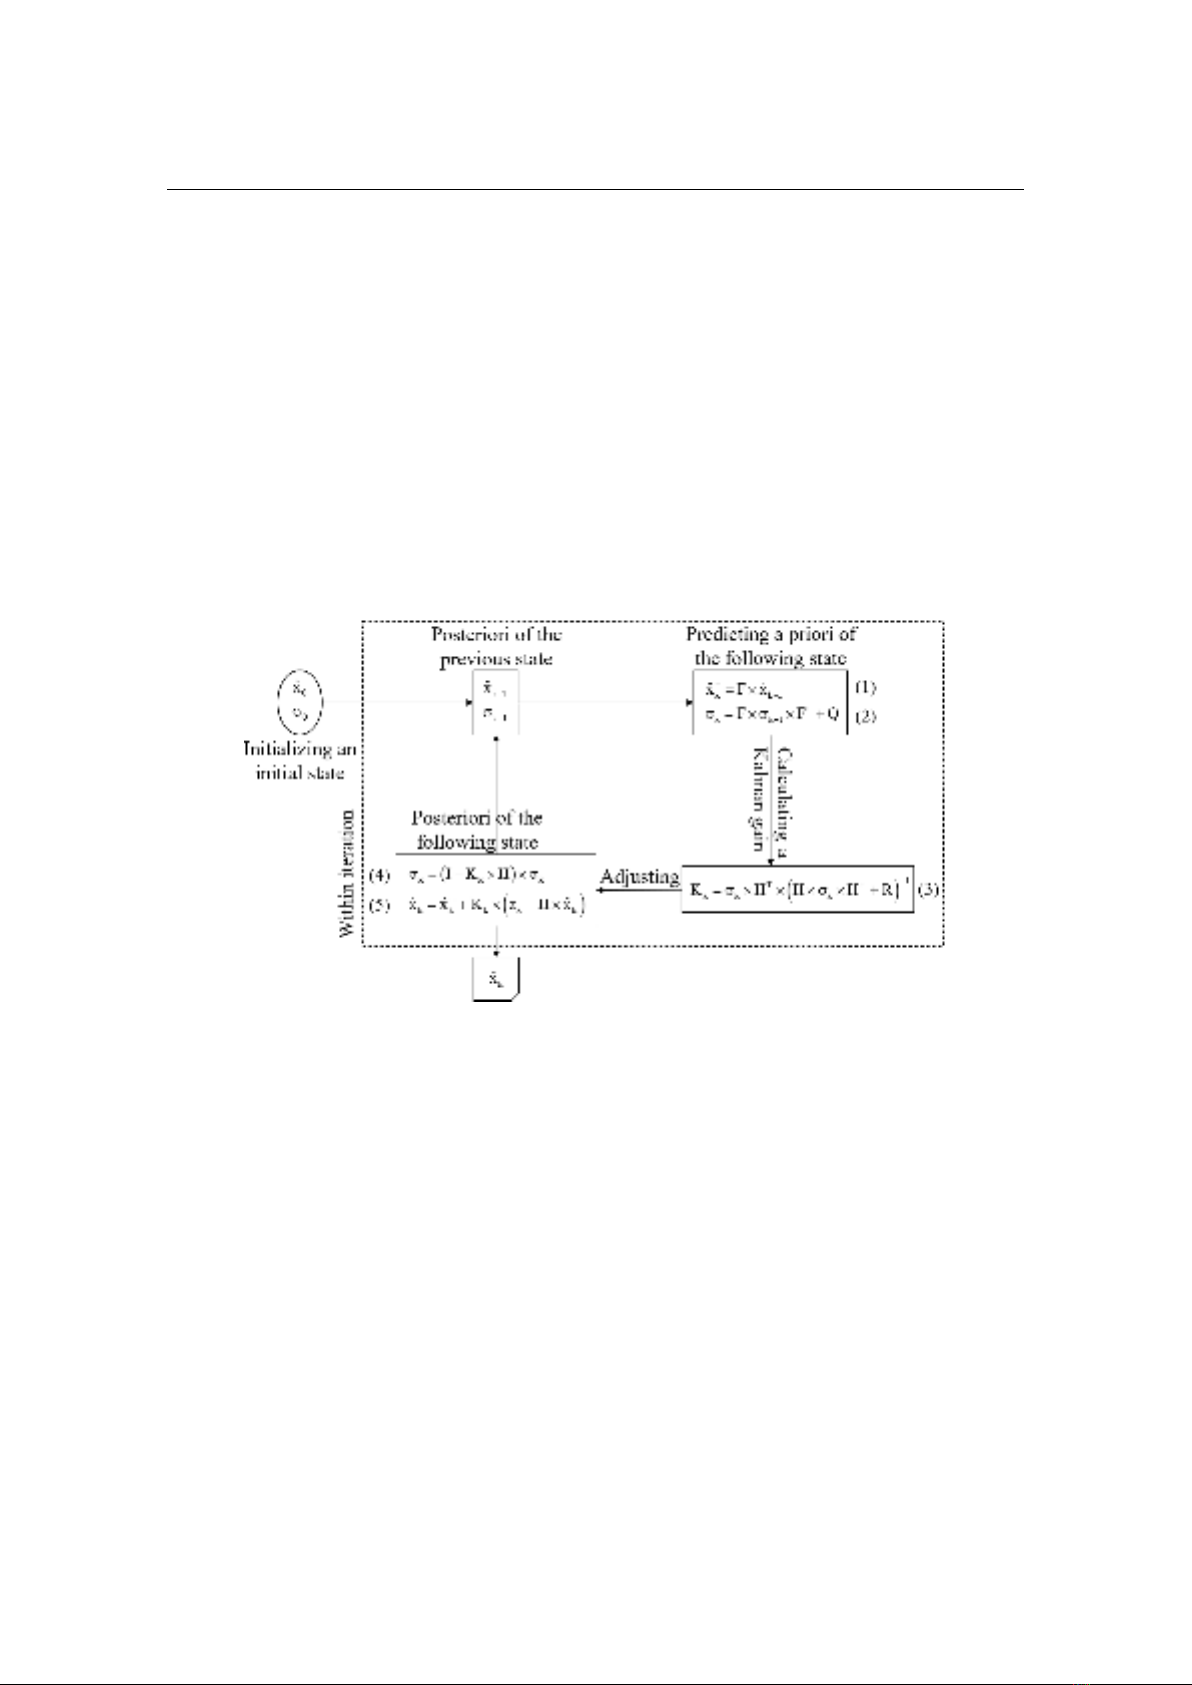
extract from this signal type. This article studies developing an algorithm called Kalman-
EMD with the combination of Kalman filter and empirical mode decomposition for
processing this signal type. The algorithm is applied in 6 data sets measuring the shockwave
pressure of underwater explosions by PCB W138A05 sensors with the same condition that
184 grams of A-IX-2 explosive is detonated underwater. The results show that noise in
signals is significantly eliminated. For the blasting parameters of processed signals, which
can be compared with theory such as I+ and τ+, although it witnesses a small trade-off when
errors of I+ enhance from about 3% to 6%, errors of τ+ are significantly decreased from about
over 30% to only about 3%. Especially other pieces of information, such as I- and τ- can be
extracted from the processed signal, so this trade-off can be acceptable. Hence, this algorithm
can be applied to denoise and extract parameters from shockwave pressure signals of
underwater explosions.
Keywords: Underwater explosions (UNDEX); denoising; Empirical mode decomposition (EMD);
Kalman filter.
1. Introduction
Explosive energy has been widely used both in the world and in Vietnam to save
costs and time. Still, the explosive efficiency of the best explosives today has only about
20% of the explosive energy becoming effective power to break soil and rocks [1, 2], the
rest of that transforms into heat and vibration, affecting the surrounding environment.
Controlling explosive energy to destroy objects at will while limiting negative impacts
on the surrounding environment is an important research area in the blasting work.
*Email: lamvt@lqdtu.edu.vn
DOI: 10.56651/lqdtu.jst.v7.n01.833.sce
Journal of Science and Technique - ISSN 1859-0209
101
The research direction inclined to analyze the dynamic effects of the blasting load,
which is expressed by the parameters of the explosion, is one of the aforementioned
solutions above. Many scientists in the world and Vietnam have researched in this
direction. Typically, the research of author D. T. Thang et al. [3-5] conducted numerous
experiments measuring many parameters of the explosion, including underwater
shockwave pressure. However, there are several reasons [6] leading to distortion of the
original waveform, obscuring important characteristics of the explosion signal, and
making it difficult to further analyze.
Fortunately, there are several denoising methods proposed by scientists. Filtering
algorithms such as Empirical Mode Decomposition (EMD), Ensemble Empirical Mode
Decomposition (EEMD), Complete Ensemble Empirical Mode Decomposition with
Adaptive Noise (CEEMDAN), Kalman filter, Savitski-Golay filter, etc., are effective in
eliminating noise in the field of signal processing. Explosion signals, particularly those
that occur underwater, are a unique type of non-stationary signal that changes its
frequency suddenly and in a short amount of time. EMD and its advanced algorithms,
such as EEMD and CEEMDAN, have been applied by many scientists to denoise
explosion signals. Sun et al. [7], Peng et al. [8], Liu and Peng [9] studied to establish a
model denoising the blasting vibration. Research of V. T. Lam et al. [6] studied noise
reduction of shockwave pressure signal induced by underwater explosions. The authors
admitted that the proposed denoising models are only suitable for certain types of signals
in the research, other types of signals still need further study. It is uncontroversial that
these studies obtained remarkable results, though. Especially, the study [6] effectively
denoised the shockwave pressure signal induced by underwater explosions with a
combination algorithm called EMD-CEEMDAN. However, there is a singular jump that
occurred in the pressure drop form of explosion signals in this study, this is the reason
that the results lack comparisons between the denoised signal and the theoretical pressure
drop law.
This article studies the Kalman-EMD combined algorithm for processing the
shockwave pressure signal when detonating an explosives charge A-IX-2 in an infinite
underwater environment. The denoising model is fine-tuned by the theory of blast wave
propagation underwater, the obtained result is the significant elimination of high-
frequency noise, and the signal is transformed into a typically smooth explosion signal,
close to the theoretical law of pressure drop [10]. Besides, the typical characteristics of
blasting parameters such as the peak pressure pmax, the positive phase duration τ+, and the
impulse I+ are also optimized to be closer to theoretical law than calculated values from
Section on Special Construction Engineering - Vol. 07, No. 01 (Jun. 2024)
102
the original signal, notwithstanding a tiny trade-off about the error of I+. In addition, other
parameters such as I- and τ- can also be extracted.
2. Noise reduction algorithms
This article uses the main algorithm called Kalman filter [11-13] along with a part
of the EMD-CEEMDAN algorithm presented in the document [6], which are combined
into an algorithm called Kalman-EMD.
The Kalman filter is among the most significant and popular estimation algorithms.
The Kalman filter algorithm depends on the rule of a system to predict a priori of a new state
and also depends on an actual measurement value to adjust and make a more accurate value
of this state. The operation of the Kalman filter is described in the following figure below:
Fig. 1. Flow chart of the Kalman filter.
In Fig. 1, F is the state transition matrix from the previous step k-1 to the current
step k; H is the observation matrix that converts the state of measurement space into that
of the observation space; Q and R are the system noise, and the measurement noise,
respectively;
ˆ
x
indicates the value of a state estimate; σ is an estimated error variance; K
is a Kalman gain; z is an actual observation of a state; subscripts consisting of “k”, “k-1”,
- indicate a current state, a previous state and an estimated priori, respectively;
quantities without subscript “-” are considered as posterior ones.
The Kalman gain is a key component of the Kalman filter algorithm, it is used to
determine how much the new measurement data should be trusted relative to the
prediction, a high Kalman gain indicates that the measurement values should be more
trusted than that of prediction, and a low Kalman gain indicates vice versa.
Journal of Science and Technique - ISSN 1859-0209
103
3. Experiments on site
The layout diagram and actual photos of the field experiment, including the location
of the explosive charge and the sensor, are shown in Fig. 2 as follows:
Fig. 2. The layout diagram and actual photos of the field experiment.
In Fig. 2, the floating raft is made from dry bamboo sticks, tied into bundles,
ensuring a straightness and length of 18 m. To increase the buoyancy of the raft, foam
bars with a cross-section of (10×10) cm are added along the length of the bamboo bundle;
at the locations where explosives and sensors are hung on the floating raft, foam floats
with the size of (30×30×30) cm are attached. The floating raft is fixed at both ends with
cables connected to fixed landmarks on the shore. The explosive charge and the sensor
are suspended by steel cables with ϕ3 mm diameter; a 2.5 kg weight is suspended at the
bottom end of the cable to tension the hanging rope, ensuring it is not skewed by the water
flow. This hanging method is also proposed by PCB manufacturer in their installation and
operating manual. The meter is arranged on the boat which is anchored at a position of
Foam bouy
Floating raft
Fixed point Fixed point
Water surface
Explosive charge Sensor
Cable Cable
Plumb bob 2.5 kg
H=10m
H1
=12m
H2=12.5÷14m
L=14m
H=10m
Water bed
Section on Special Construction Engineering - Vol. 07, No. 01 (Jun. 2024)
104
50 m far from the foam buoys, in the opposite direction; the detonating electrical wire
and sensor wires are connected to the boat.
The sensors used in this experiment are the type of underwater blast sensor 138A05
of the PCB Piezotronics manufactures. The measured data is obtained by a multichannel
portable measurement instrument DEWE-3020. Similar to the document [6], a suitable
sampling frequency of 200 kHz is chosen. The depth of the experimental area is measured
by a Hondex PS-7 portable depth sounder and a measuring tape. The distance is measured
by a Nikon laser rangefinder and a measuring tape. The explosive charge used in this
experiment weighs 184 grams, including the detonator, which is made from A-IX-2, with
the heat of explosion being 1540 kcal/kg, and the explosive density being 1.7 g/cm3.
The experiment area was selected carefully, it was a tidal area possessing silent
water flow and also checked by divers to ensure experimental conditions close to the
model described in Fig. 2. Then, a total of 6 underwater explosions were carried out. The
most important in these experiments is to ensure all the blasting parameters such as the
mass, the size of explosives, and the depth of explosive placement meet the blasting
conditions of an infinite medium, allowing the phenomenon of deep underwater
explosion, where the effects of the waterbed and water surface do not exist. These
conditions are tested through 2 coefficients corresponding to water surface influence km
and waterbed influence kd as the following Table 1:
Table 1. Calculated results of km and kd
Equations for km and kd [1, 2]
Results
23
0
2
0
0 314 1 4 2
1
.
m
Hh
..
rH
k
R H h
rr









(6)
km = 1768 > 1
(7)
kd = 7232 > 1
In Table 1, r is the distance from the explosive center to the waterbed, averaging
equal to 2.2 (m); R is the distance from the explosive center to the sensor, equal to