Role of Kupffer cells in pathogenesis of sepsis-induced drug metabolizing dysfunction Tae-Hoon Kim*, Sang-Ho Lee* and Sun-Mee Lee
School of Pharmacy, Sungkyunkwan University, Suwon, South Korea
Keywords CYP450; HMGB1; Kupffer cells; sepsis; Toll-like receptor
Correspondence S.-M. Lee, School of Pharmacy, Sungkyunkwan University, 300 Cheoncheon- dong, Jangan-gu, Suwon-si, Gyeonggi- do 440-746, South Korea Fax: +82 31 292 8800 Tel: +82 31 290 7712 E-mail: sunmee@skku.edu
*These authors contributed equally to this work
(Received 2 December 2010, revised 19 April 2011, accepted 28 April 2011)
The present study aimed to determine the role of Kupffer cells (KCs) in cytochrome P450 (CYP) isozyme activity and the expression of its gene during polymicrobial sepsis. For ablation of KCs, rats were pretreated with gadolinium chloride (GdCl3) at 48 and 24 h before cecal ligation and punc- ture (CLP). The depletion of KCs was confirmed by measuring the mRNA level of the KC marker gene CD163. Serum aminotransferase levels and lipid peroxidation showed an increase and hepatic glutathione content showed a decrease at 24 h after CLP. These changes were prevented by GdCl3 pretreatment. Catalytic activities of CYP1A1, 1A2 and 2E1 showed a significant reduction at 24 h after CLP but were prevented by GdCl3. A reduction in the levels of CYP2E1 protein and CYP2B1 and CYP2E1 mRNA expression was prevented by GdCl3. Phosphorylation of CYP1A1 ⁄ 1A2 markedly increased 24 h after CLP, which was prevented by GdCl3. The increased serum level of high mobility group box 1, hepatic level of Toll-like receptors 2 and 4, and inducible nitric oxide synthase pro- tein expression were prevented by GdCl3. In addition, elevated serum con- centrations of tumor necrosis factor-a and interleukin-6, and increased hepatic mRNA levels of tumor necrosis factor-a and interleukin-6 were decreased by depletion of KCs. Our findings suggest that ablation of KCs protects against hepatic drug-metabolizing dysfunction by modulation of the inflammatory response.
doi:10.1111/j.1742-4658.2011.08148.x
Introduction
Sepsis, severe sepsis and septic shock are worldwide problems and continue to be the most common causes of death in surgical intensive care units [1]. The patho- genesis of sepsis has often been viewed to involve excessive immune inflammation that can lead to lethal multiple organ failure, suggesting that the downregula- tion of immunity could be beneficial [2]. As a result of its major implications in essential metabolic functions and host defense, the liver plays an important role in the development of multiple organ failure [3].
Patients who are diagnosed with sepsis receive vari- ous therapeutic agents because of its complex patho- physiology and varied symptoms; the main clinical concern has been that patients on a stable drug regi- men would have increased exposure to an incidence of adverse drug events. The cytochrome P450 (CYP) enzyme system constitutes one of the major aspects of hepatocyte function and contributes to the metabolism and elimination of exogenous and endogenous sub- stances [4]. In various models and in clinical reports,
FEBS Journal 278 (2011) 2307–2317 ª 2011 The Authors Journal compilation ª 2011 FEBS
2307
Abbreviations ALT, alanine aminotrasferase; AST, aspartate aminotrasferase; CLP, cecal ligation and puncture; CYP, cytochrome P450; GdCl3, gadolinium chloride; GSH, glutathione; GSSG, glutathione disulfide; HMGB1, high mobility group box 1; IL, interleukin; iNOS, inducible nitric oxide synthase; KCs, Kupffer cells; LPS, lipopolysaccharide; MDA, malondialdehyde; NO, nitric oxide; PAP, p-aminophenol; RIPA, radioimmunoprecipitation assay; ROS, reactive oxygen species; TLR, Toll-like receptor; TNF, tumor necrosis factor.
Sham
CLP
GdCl
GdCl3 + CLP
3
CD163
β-actin
inflammation or infection is associated with a decrease in hepatic expression and ⁄ or activities of CYPs [5]. A previous study showed that hepatic CYP-mediated drug metabolism is suppressed during polymicrobial sepsis, particularly in the late phase [6].
including the liver,
T.-H. Kim et al. KCs in drug-metabolizing dysfunction during sepsis
The complex Toll-like receptor (TLR) and associ- ated downstream regulators of immune cells play a crucial role in the innate system as a first line of defense against pathogens [7]. TLR2 and TLR4 expres- sion in multi-organs, lung, heart and spleen, was significantly upregulated in experimen- tal models of sepsis and in patients with sepsis [8]. Ghose et al. [9] reported that the expression of hepatic drug-metabolizing enzymes was regulated by a TLR4- dependent mechanism in a lipopolysaccharide (LPS)- induced inflammation model. In addition, the TLR2 lipoteichoic acid, altered the expression of ligand, hepatic genes involved in drug metabolism and trans- port [10]. Kupffer cells (KCs), the resident hepatic macrophages, mainly mediate inflammatory responses in the liver by presenting TLRs on their surface. TLR4 associates with CD14 on the surface of KCs, mediating LPS-induced signal transduction, and activates KCs to produce several proinflammatory cytokines [11]. In vivo observation by immunoelectronmicroscopy shows the accumulation of TLR2 to the membrane of KCs dur- ing endotoxemia [12]. A recent study reported that KCs can release high mobility group box1 (HMGB1), a critical late mediator of lethal sepsis, triggering the production of proinflammatory cytokines and liver injury [13].
CLP. The serum ALT level in rats who underwent CLP was 1.8-fold that of sham-operated rats at 24 h after CLP, which was significantly attenuated by GdCl3. Similar to the ALT level, the serum aspartate aminotransferase (AST) level increased significantly at 24 h after CLP and this increase was attenuated by GdCl3. The malondialdehyde (MDA) level in CLP rats was 1.8-fold that of sham-operated rats. The increase in the MDA level at 24 h after CLP was significantly prevented by GdCl3 (Table 1).
Therefore, the present study aimed to elucidate the role of KCs in the regulation of CYP isoform activities and gene expression profiles, partly by investigating the inflammatory signaling pathway.
Hepatic glutathione (GSH)
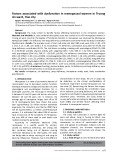
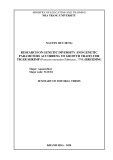
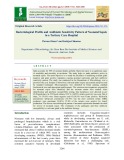
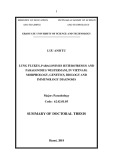
Fig. 1. Effect of GdCl3 on the hepatic CD163 mRNA expression levels 24 h after CLP. Rats were pretreated intravenously with 7.5 mgÆkg)1 GdCl3 or saline alone 48 and 24 h before CLP. The val- ues are represented as the mean ± SEM for eight to ten rats per group. **P < 0.01, significantly different from sham. ++P < 0.01, significantly different from CLP.
Results
Hepatic CD163 mRNA expression
The hepatic GSH concentration showed a significant decrease at 24 h after CLP, and this decrease was pre- vented by depletion of KCs by GdCl3. Although the
Table 1. Effect of GdCl3 on serum aminotransferase activites and lipid peroxidation after CLP. Each value is presented as the mean ± SEM for eight to ten rats per group.
Pretreatment with gadolinium chloride (GdCl3) alone significantly decreased the hepatic mRNA level of CD163 compared to that of sham group. Twenty-four hours after cecal ligation and puncture (CLP), the hepatic mRNA level of CD163 was similar with that of the sham group, which markedly decreased to approximately 7.0% of that of the CLP group (Fig. 1).
Serum aminotransferase activities and lipid peroxidation
Groups ALT (UÆL)1) AST (UÆL)1) MDA (nmolÆmg)1 protein)
22.6 ± 1.6 20.0 ± 1.9 41.4 ± 1.7** 24.7 ± 2.1++ 68.1 ± 3.4 82.6 ± 4.1 143.6 ± 8.9** 119.9 ± 5.0+ 0.98 ± 0.05 1.19 ± 0.07 1.72 ± 0.10** 1.18 ± 0.09++ Sham GdCl3 CLP GdCl3 + CLP
+P < 0.05,
The serum level of alanine aminotransferase (ALT) in sham-operated rats was 22.6 ± 1.6 UÆL)1 at 24 h after
FEBS Journal 278 (2011) 2307–2317 ª 2011 The Authors Journal compilation ª 2011 FEBS
2308
significantly different from sham. **P < 0.01, ++P < 0.01, significantly different from CLP.
T.-H. Kim et al. KCs in drug-metabolizing dysfunction during sepsis
decreases were attenuated by GdCl3 pretreatment. CYP2B1 activity remained unchanged across all experimental groups.
Table 2. Effect of gadolinium chloride on concentrations of GSH, GSSG and GSH ⁄ GSSG ratio after CLP. Each value is presented as the mean ± SEM for eight to ten rats per group.
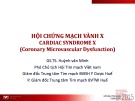
CYP isozyme protein expression
Groups GSH ⁄ GSSG ratio GSH (nmolÆmg)1 liver) GSSG (nmolÆmg)1 liver)
17.61 ± 2.37 16.52 ± 1.86
0.24 ± 0.02 0.24 ± 0.02 0.33 ± 0.03* 0.30 ± 0.01 9.32 ± 0.86** 12.41 ± 0.51+ Sham 4.02 ± 0.25 GdCl3 3.84 ± 0.14 CLP 3.01 ± 0.17** GdCl3 + CLP 3.66 ± 0.17+
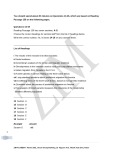
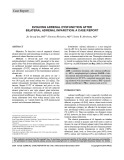
The amount of CYP1A1 and 1A2 protein expression in the microsome showed a significant decrease at 24 h after CLP. GdCl3 pretreatment raised CYP1A1 and 1A2 protein expression levels without statistical signifi- cance. No significant differences in CYP2B1 protein expression level were observed among any experimental groups. The amount of 2E1 protein expression showed a significant decrease at 24 h after CLP. This decrease was prevented by GdCl3 pretreatment (Fig. 2).
CYP1A1 ⁄ 1A2 phosphorylation
GSH disulfide (GSSG) concentration showed a marked increase at 24 h after CLP, GdCl3 pretreatment did not affect the GSSG concentration. The GSH to GSSG ratio showed a significant decline at 24 h after CLP, which was attenuated by GdCl3 pretreatment (Table 2).
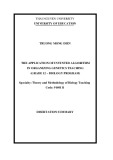
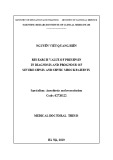
The phosphorylation of CYP1A1 ⁄ 1A2 significantly increased 24 h after CLP, which was attenuated by GdCl3 pretreatment (Fig. 3).
Total hepatic CYP content and NADPH-CYP reductase activity
CYP isozyme mRNA expression
decrease
to
The hepatic microsomal CYP content in the sham group was 0.39 ± 0.03 nmolÆmg)1 protein. At 24 h the hepatic microsomal CYP content after CLP, 0.14 ± 0.01 significant a showed nmolÆmg)1 protein and this decrease was attenuated by GdCl3 treatment. Hepatic microsomal NADPH-CYP reductase activity showed a significant decrease at 24 h after CLP. GdCl3 markedly attenuated this decrease (Table 3).
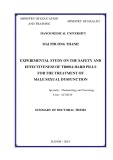
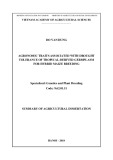
No differences were observed in CYP1A1 and 1A2 mRNA expression between the experimental groups. The level of CYP2B1 mRNA expression showed a sig- nificant decrease at 24 h after CLP, and the decrease was prevented by GdCl3. Similar to CYP2B1, the level of CYP2E1 mRNA expression showed a marked decline at 24 h after CLP, and the reduction was atten- uated by GdCl3 (Fig. 4).
Hepatic microsomal CYP isozyme activities
Hepatic TLR2 and TLR4 protein expression
The hepatic level of TLR2 and TLR4 protein expres- sion showed a marked increase at 24 h after CLP. These increases were significantly attenuated by GdCl3 pretreatment (Fig. 5).
The results for the CYP isozyme activities are summa- rized in Table 4. At 24 h after CLP, CYP1A1, 1A2 and 2E1 activities were reduced to levels approximately 46.2%, 45.8% and 34.3% of that observed in micro- respectively. These somes
in sham-operated rats,
Serum HMGB1 and hepatic inducible nitric oxide synthase (iNOS) protein expression
*P < 0.05, **P < 0.01, significantly different from sham. +P < 0.05, significantly different from CLP.
Table 3. Effect of gadolinium chloride on the total cytochrome P450 content and NADPH-cytochrome P450 reductase activity after CLP. Each value is presented as the mean ± SEM for eight to ten rats per group.
Serum levels of HMGB1 protein expression and hepa- tic iNOS protein expression showed a significant increase at 24 h after CLP. These increases were mark- edly attenuated by pretreatment with GdCl3 (Fig. 6).
Serum tumor necrosis factor (TNF)-a and interleukin (IL)-6 levels
Groups Cytochrome P450 content (nmolÆmg)1 protein) NADPH-cytochrome P450 reductase activity (nmolÆmg)1 protein)
0.39 ± 0.03 0.37 ± 0.04 0.14 ± 0.01** 0.29 ± 0.03+ 72.2 ± 2.1 67.5 ± 2.1 51.6 ± 2.8** 68.9 ± 2.4++ Sham GdCl3 CLP GdCl3 + CLP
+P < 0.05,
Compared to sham-operated rats, serum TNF-a and increase at 24 h IL-6 levels
showed a significant
FEBS Journal 278 (2011) 2307–2317 ª 2011 The Authors Journal compilation ª 2011 FEBS
2309
significantly different from sham. **P < 0.01, ++P < 0.01, significantly different from CLP.
T.-H. Kim et al. KCs in drug-metabolizing dysfunction during sepsis
Table 4. Effect of gadolinium chloride on the hepatic microsomal cytochrome P450 isozyme activities after CLP. Each value is represented as the mean ± SEM for eight to ten rats per group.
Sham CLP GdCl3 GdCl3 + CLP
69.9 ± 2.4 34.5 ± 0.7 18.6 ± 1.8 0.35 ± 0.01 66.4 ± 1.7 25.8 ± 0.4 19.3 ± 2.5 0.36 ± 0.02 32.3 ± 2.3** 15.8 ± 1.4** 16.9 ± 1.2 0.12 ± 0.01** 59.2 ± 4.1++ 32.3 ± 1.9++ 17.2 ± 1.0 0.33 ± 0.02++ Ethoxyresorufin O-deethylase (pmol resorufinÆmg)1 protein) Methoxyresorufin O-demethylase (pmol resorufinÆmg)1 protein) Penthoxyresorufin O-dealkylase (pmol resorufinÆmg)1 protein) Aniline p-hydroxylase (nmol PAPÆmg)1 protein)
Sham GdCl3 CLP GdCl3 + CLP
CYP1A1
β-actin
CYP1A2
β-actin
CYP2B1
β-actin
CYP2E1
β-actin
**P < 0.01, significantly different from sham. ++P < 0.01, significantly different from CLP.
and
+
GdCl3
Fig. 2. Effects of KCs on hepatic CYP1A1, 1A2, 2B1 and 2E1 protein expression levels 24 h after CLP. Rats were pretreated intravenously with 7.5 mgÆkg)1 GdCl3 or saline alone 48 and 24 h before CLP. The values are represented as the mean ± SEM for eight to ten rats per group. *P < 0.05, **P < 0.01, significantly different from sham. +P < 0.05, significantly different from CLP.
–
(450.8 ± 22.6 pgÆmL)1 after CLP 255.1 ± 40.8 pgÆmL)1, respectively). GdCl3 pretreatment atten- uated these increases (Fig. 7).
CLP
+
+
– –
+ –
IP : CYP1A1/1A2
Phospho-CYP1A2 Phospho-CYP1A1
Hepatic TNF-a and IL-6 mNRA expression
Blot : phosphoserine/ threonine
CYP1A2 CYP1A1
As shown in Fig. 8, the hepatic level of TNF-a and IL-6 mRNA expression showed a significant increase at 24 h after CLP, and this increase was attenuated by GdCl3.
Discussion
Several studies have shown that interactions between KCs and endotoxin comprise the initiating event lead- ing to hepatotoxicity in liver injury, including endotox- emia and ischemia ⁄ reperfusion injury [14]. In our studies, we employed GdCl3 to inactivate KCs based on the findings of other investigators showing the destruction of KCs after the intravenous administra- tion of GdCl3 [15]. Hardonk et al. [15] demonstrated that large KCs were no longer present 24 h after GdCl3 treatment. Splenic macrophages are less vulner- able to GdCl3 because only some of the red pulp mac- transiently disappear. The white pulp rophages
FEBS Journal 278 (2011) 2307–2317 ª 2011 The Authors Journal compilation ª 2011 FEBS
2310
Fig. 3. Effects of KCs on the phosphorylation of CYP1A1 ⁄ 1A2 24 h after CLP. Rats were pretreated intravenously with 7.5 mgÆkg)1 GdCl3 or saline alone 48 and 24 h before CLP. The livers samples were subjected to immunoprecipitation (IP) using anti-CYP1A1 ⁄ 1A2 serum. Immunoprecipitates were subjected to immunoblot analysis using anti-phosphoserine ⁄ threonine serum. The values are repre- to ten rats per group. sented as the mean ± SEM for eight *P < 0.05, **P < 0.01, significantly different from sham. +P < 0.05, significantly different from CLP.
Sham GdCl3 CLP GdCl3 + CLP
CYP1A1
β-actin
CYP1A2
β-actin
CYP2B1
β-actin
CYP2E1
β-actin
T.-H. Kim et al. KCs in drug-metabolizing dysfunction during sepsis
Sham GdCl3 CLP GdCl3 + CLP
TLR2
TLR4
[18]. Our
reported
study
β-actin
In humans and animals, infections or inflammatory stimuli cause changes in the activities and expression levels of various forms of CYP in the liver. In most cases, CYPs and their activities are suppressed; how- ever, some are unaffected or induced under these con- on previous ditions abnormalities in microsomal drug-metabolizing func- tion during the late phase of sepsis [6]. However, the underlying mechanisms involved in hepatic dysfunction during sepsis remain elusive.
Among various CYP isoforms, CYP1A1, 1A2, 2B1 and 2E1 are both present in hepatic microsome of human and normal rats. The function and regulation of these isozymes are highly conserved among mam- malian species [19].
and
1A2
activities were
Fig. 4. Effects of KCs on hepatic CYP1A1, 1A2, 2B1 and 2E1 mRNA expression levels 24 h after CLP. Rats were pretreated intravenously with 7.5 mgÆkg)1 GdCl3 or saline alone 48 and 24 h before CLP. The values are represented as the mean ± SEM for eight to ten rats per group. **P < 0.01, significantly different from sham. +P < 0.05, ++P < 0.01, significantly different from CLP.
restored CYP1A1
CYP1A1 is not expressed in normal adult tissues but can be induced several fold by polycyclic or halo- genated hydrocarbons [20]. CYP1A2, which is consti- tutively expressed in the liver, is primarily involved in the oxidative metabolism of xenobiotics and is capable of the metabolic activation of numerous procarcino- gens, including aflatoxin B1 [21]. In the present study, significantly CYP1A1 decreased, with a concomitant decrease in their protein levels during the late phase of sepsis. However, CYP1A1 and 1A2 mRNA expression was not altered. and 1A2 Depletion of KCs activities, whereas protein levels remained decreased. There is evidence showing that oxidative stress contrib- utes to the inhibition of CYP activity observed in the absence of changes in protein expression in rabbit he- patocytes [22]. ROS indirectly reduced the activity of selected isoforms of CYP by inducing phosphorylation of the isoforms [23]. Activated KCs cause oxidative releasing large surrounding tissue, stress on the amounts of ROS during sepsis [24]. Interestingly, phos- phorylation of CYP1A1 ⁄ 1A2 occurred at 24 h after
macrophages are not affected. GdCl3 pretreatment has been demonstrated to have an effect on the prevention reactive oxygen species of LPS-evoked release of (ROS) and proinflammatory cytokines from KCs [16]. Our recent studies have shown that GdCl3 attenuated the imbalanced vascular stress gene expression induced by sepsis [17]. In the present study, the depletion of KCs was confirmed by dramatically reduced expression of the KC marker gene CD163.
FEBS Journal 278 (2011) 2307–2317 ª 2011 The Authors Journal compilation ª 2011 FEBS
2311
Fig. 5. Effects of KCs on hepatic TLR2 and TLR4 protein expres- sion levels 24 h after CLP. Rats were pretreated intravenously with 7.5 mgÆkg)1 GdCl3 or saline alone 48 and 24 h before CLP. The val- ues are represented as the mean ± SEM for eight to ten rats per group. **P < 0.01, significantly different from sham. ++P < 0.01, significantly different from CLP.
Sham GdCl3 CLP GdCl3 + CLP
HMGB1
iNOS
β-actin
T.-H. Kim et al. KCs in drug-metabolizing dysfunction during sepsis
CLP GdCl3 + CLP
Sham GdCl3
TNF-α β-actin
IL-6 β-actin
Fig. 6. Effects of KCs on serum HMGB1 and hepatic iNOS protein expression levels 24 h after CLP. Rats were pretreated intravenously with 7.5 mgÆkg)1 GdCl3 or saline alone 48 and 24 h before CLP. The values are represented as the mean ± SEM for eight to ten rats per group. **P < 0.01, significantly different from sham. ++P < 0.01, significantly different from CLP.
Fig. 7. Effects of KCs on serum TNF-a and IL-6 levels 24 h after CLP. Rats were pretreated intravenously with 7.5 mgÆkg)1 GdCl3 or saline alone 48 and 24 h before CLP. The values are represented as the mean ± SEM for eight to ten rats per group. **P < 0.01, significantly different from sham. ++P < 0.01, significantly different from CLP.
CLP, and GdCl3 pretreatment attenuated this phos- phorylation. GdCl3 pretreatment also prevented lipid peroxidation and a decrease in hepatic GSH ⁄ GSSG ratio during sepsis. Thus, the results of the present study suggest that ROS produced by KCs mediate the sepsis-induced decrease in CYP1A1 and 1A2 activities partly through a post-translational phosphorylation.
decreases were attenuated by GdCl3 pretreatment. Our results suggest that KCs are involved in the sepsis- induced downregulation of CYP2E1 at the transcrip- tional level.
Depression of CYP-dependent hepatic drug metabo- lism in inflammatory reactions and infectious diseases has been attributed to the inflammatory events. TLRs play a critical role in the immune system by providing an early recognition of pathogen invasion and a facili- tation of the body’s subsequent immune responses [27]. The stimulation of these receptors activates inflamma- tory responses characterized by the release of a wide including IL-6 range of proinflammatory cytokines,
Upregulation of CYP2E1 has been reported in vari- including able experimental pathological conditions, carbon tetachloride-induced hepatic fibrosis, alcohol- induced liver diseases and hepatic ischemia ⁄ reperfusion injury, which were implicated in the activation of KCs [25]. The expression and activity of CYP2E1 were line after the downregulated in a rat hepatoma cell administration of proinflammatory cytokines, leading to a loss of catalytic activity. This downregulation was at the level of transcription [26]. In the present study, the activity and protein and mRNA levels of CYP2E1 showed a significant decrease at 24 h after CLP. These
FEBS Journal 278 (2011) 2307–2317 ª 2011 The Authors Journal compilation ª 2011 FEBS
2312
Fig. 8. Effects of KCs on hepatic TNF-a and IL-6 mRNA expression levels 24 h after CLP. Rats were pretreated intravenously with 7.5 mgÆkg)1 GdCl3 or saline alone 48 and 24 h before CLP. The val- ues are represented as the mean ± SEM for eight to ten rats per from sham. +P < 0.05, group. *P < 0.05, significantly different ++P < 0.01, significantly different from CLP.
be elucidated; however, our results show that KCs dif- ferentially regulate the expression of each form of CYP among the various CYP subfamilies. These dif- ferential regulations were attributed to the ability of KCs to develop exaggerated inflammatory responses through TLR overexpression, the release of HMGB1 and the upregulation of proinflammatory cytokines.
T.-H. Kim et al. KCs in drug-metabolizing dysfunction during sepsis
Materials and methods
Animals
Male Sprague-Dawley rats, weighing 280–320 g, were sup- plied by the Jeil Animal Breeding Company (Deajeon, Korea). The animals were housed in cages located in tem- perature controlled rooms under a 12 : 12 h light ⁄ dark photocycle, and received water and food ad libitum for at least 1 week. All animal procedures were approved by the Sungkyunkwan University Animal Care Committee and were performed in accordance with the guidelines of the National Institutes of Health.
and TNF-a. KCs strongly express all TLRs, except TLR5 [28]. TLR4 and TLR2 in hepatic and splenic macrophages were significantly upregulated in mice with experimental peritonitis induced by CLP [29]. It has been reported that the regulation of hepatic CYP gene expression elicited by chemically-induced inflam- matory bowel disease was entirely dependent on TLR4 [30]. However, hepatic inflammation induced by Cit- robacter rodentium infection was mainly TLR4-inde- pendent because hepatic CYPs mRNA expression was similarly downregulated and cytokine mRNAs were similarly induced in both wild-type and TLR4-mutant mice [31]. Recently, the TLR2 ligand, lipoteichoic acid, altered the expression of hepatic genes associated with drug metabolism and transport [10]. The results of the present study show that inactivation of KCs by GdCl3 pretreatment attenuates any increases in hepatic TLR4 and TLR2 protein expression levels at 24 h after CLP. KCs mediated the specific downregulation of CYP2B1 via the release of TNF-a in a KCs ⁄ hepatocyte cocul- ture system [32]. Moreover, proinflammatory cytokines released from KC, although not the direct effects of LPS, play an important role in downregulating hepatic CYP1A2 expression in sepsis [33]. In the present study, increased serum levels of TNF-a and IL-6 and the pro- tein expression of iNOS were markedly suppressed by GdCl3 treatment. This result suggests that septic insult stimulates both TLR4 and TLR2 expression on KCs, resulting in the release of proinflammatory mediators and the downregulation of CYP enzymes in hepato- cytes.
HMGB1,
a DNA-binding nuclear protein,
Treatment with GdCl3 and experimental groups For depletion of KCs in vivo, 7.5 mgÆkg)1 of GdCl3 was injected via the tail vein at 48 and 24 h before the perfor- mance of CLP or sham operation, based on the findings of other investigators who showed the destruction of KCs after the intravenous administration of GdCl3, where large KCs were no longer present at 24 h after GdCl3 treatment [15]. In vehicle-treated rats, physiological saline solution was injected with the same volume and in the same manner as GdCl3. Four treatment groups were studied: (a) vehicle- treated sham (sham); (b) GdCl3-treated sham (GdCl3); (c) vehicle-treated CLP (CLP); and (d) GdCl3-treated CLP (GdCl3 + CLP).
CLP
that
is released actively by monocytes ⁄ macrophages and pas- sively by cell death, and plays a critical role in the mediation of immune responses in several inflamma- tory disorders [34]. The delayed secretion of HMGB1 was observed both in vitro and in vivo, and these delayed secretions were crucial to the increased mortal- ity in septic patients and experimental animals [35]. The findings reported in recent in vitro studies suggest that some of the effects of HMGB1 result from its interaction with TLR2 or TLR4, leading to the media- tion of various cellular responses and the release of proinflammatory cytokines [36]. There is evidence that LPS stimulation increases HMGB1 mRNA expression in both cultured primary hepatocytes and KCs. How- ever, only KCs release HMGB1 protein into the cul- ture media [13]. In the present study, the inactivation of KCs by GdCl3 treatment attenuated the increase in serum HMGB1 and improved the survival rate at 24 h after CLP (data not shown).
Polymicrobial sepsis was induced by CLP in accordance with the method previously described by Chaudry et al. [37]. After anesthetization with ether, a 2 cm ventral mid- line incision was performed. The cecum was then carefully exposed, ligated just distal to the ileocecal valve to avoid intestinal obstruction, and punctured twice with an 18-gauge needle. The punctured cecum was squeezed to expel a small amount of fecal material and returned to the abdominal cavity, and the abdominal incision was closed in two layers. Sham-operated animals underwent the same surgical procedure, except the cecum was neither ligated, nor punctured. All animals received normal saline (3 mLÆ100 g)1 body weight) subcutaneously immediately after surgery (i.e. fluid resuscitation). At 24 h (i.e. late phase of sepsis) after CLP, blood was obtained from the
The full complexity of the regulatory mechanisms underlying the alteration of CYP enzymes remains to
FEBS Journal 278 (2011) 2307–2317 ª 2011 The Authors Journal compilation ª 2011 FEBS
2313
abdominal aorta. The left and median lobes of the liver were isolated immediately, and stored at )75 (cid:2)C until assayed.
Isolation of hepatic microsomal fraction
iNOS (Transduction 2E1 (Gentest, Woburn, MA, USA); Laboratories, San Jose, CA, USA); TLR4 and TLR2 (Santa Cruz Biotechnology, Santa Cruz, CA, USA); and HMGB1 (Abcam, Cambridge, MA, USA). Binding of all of the anti- bodies was detected using an ECL detection system (iNtRON Biotechnology, Seoul, Korea) in accordance with the manu- facturer’s instructions. The intensity of the immunoreactive bands was determined using densitometric analysis software (image gauge, version 3.12; Fujifilm, Tokyo, Japan).
Immunoprecipitation
The excised liver was minced and then homogenized in four volumes of ice-cold 1.15% KCl for 1 g of liver, and centri- fuged at 9000 g for 60 min. The supernatant was collected and centrifuged at 105 000 g for 60 min, and the precipi- tates (microsomal fractions) were resuspended with four volumes of 0.1 m phosphate buffer at pH 7.4, for 1 g of liver microsome and stored at )75 (cid:2)C until assayed.
Analytical procedures
Liver tissues were homogenized with ice-cold radioimmuno- precipitation assay (RIPA) buffer (150 mm NaCl, 50 mm Tris, 1% Triton X-100, 1% deoxycholic acid, 0.1% SDS, pH 7.4) containing protease and phosphatase inhibitor cocktail set (Calbiochem, La Jolla, CA, USA). Aliquots of 500 lg of protein diluted to 1 mgÆmL)1 in RIPA buffer were precleared with protein A ⁄ G agarose beads (Santa Cruz Biotechnology) for 30 min and then incubated overnight at 4 (cid:2)C with anti-CYP1A1 ⁄ 1A2 serum (Abcam) with a con- stant rotation of the samples. Protein A ⁄ G agarose beads was then added, and the samples were incubated for a fur- ther 3 h at 4 (cid:2)C with constant rotation. The immune com- plexes were washed three times in a RIPA buffer for 30 s. After the third wash, the immunoprecipitants were resus- pended in Laemmli sample buffer. The samples were then analyzed by western blotting using the polyclonal anti-phos- phoserine ⁄ threonine serum (Abcam) as the primary anti- body. Binding of all of the antibodies was detected using an ECL detection system (iNtRON Biotechnology) in accor- dance with the manufacturer’s instructions. The intensity of the immunoreactive bands was determined using densito- metric analysis software (image gauge, version 3.12).
Total RNA extraction and RT-PCR
the method
respectively,
Serum ALT and AST activities were determined by stan- dard spectrophotometric procedures using a diagnostic kit (Sigma Chemical Co., St Louis, MO, USA). Lipid peroxide was assayed by the method of Buege and Aust [38], and 1,1,3,3-tetraethoxypropane (MDA tetraethyl acetal) was used as the standard. Total GSH was determined in liver homogenates after precipitation with 1% picric acid, using yeast GSH reductase, 5,5¢-dithio-bis(2-nitrobenzoic acid) and NADPH at 340 nm. GSSG was determined by the same method in the presence of 2-vinylpyridine and reduced GSH was calculated from the difference between total glu- tathione and GSSG [39]. CYP content was calculated using the molar extinction coefficient for the absorbance differ- ence between 450 and 480 nm, as measured with a differen- tial spectrophotometer [40]. The activity of NADPH-CYP reductase was indirectly determined by its NADPH-cyto- chome c reductase activity [41]. The catalytic activity of CYP1A1, 1A2 and 2B1 in liver microsomal fractions was measured as 7-ethoxyresourfin O-deethylase, methoxyre- sourfin O-demethylase and pentoxyresourfin O-dealkylase activities, previously using described by Burke et al. [42]. Microsomal CYP2E1 activity was determined by measurement of 4-hydroxylation of aniline to p-aminophenol (PAP) [43].
ELISA
Serum concentrations of TNF-a and IL-6 were determined using ELISA kits in accordance with the manufacturer’s instructions (BD Biosciences, San Diego, CA, USA).
Western blot immunoassay
Isolation of total RNA was carried out in accordance with the method previously described by Chomczynski and Sacchi [44]. Reverse transcription of total RNA was performed for synthesis of the first strand of cDNA using the oligo12–18 pri- mer and SuperScript(cid:3) II RNase H) Reverse Transcriptase (Tech-Line(cid:3); Invitrogen Carlsbad, CA, USA). The PCR reaction was performed with a diluted cDNA sample and amplified in each 20 lL reaction volume. The final reaction concentrations were: primers (Table 5), 10 pmol; dNTP mix, 250 lL; 10· PCR buffer; and Ex Taq DNA polymerase, 0.5 U per reaction. All PCR reactions had an initial denatur- ation step at 94 (cid:2)C for 5 min, and a final extension at 72 (cid:2)C for 5 min using the GeneAmp 2700 thermocycler (Applied Biosystems, Foster City, CA, USA). PCR amplification cycling conditions comprised: 94 (cid:2)C for 30 s, 55 (cid:2)C for 30 s, 72 (cid:2)C for 60 s, 30 cycles for CD163; 94 (cid:2)C for 30 s, 57 (cid:2)C for 30 s, 72 (cid:2)C for 60 s, 30 cycles for CYP1A1; 94 (cid:2)C for
Protein samples (10–20 lg per well) from liver tissue and serum were separated by 10–12% SDS ⁄ PAGE, and were transferred to nitrocellulose membranes using a semi-dry transfer process. Bands were immunologically detected using polyclonal antibodies against rat CYP1A1, 1A2, 2B1 and
FEBS Journal 278 (2011) 2307–2317 ª 2011 The Authors Journal compilation ª 2011 FEBS
2314
T.-H. Kim et al. KCs in drug-metabolizing dysfunction during sepsis
T.-H. Kim et al. KCs in drug-metabolizing dysfunction during sepsis
appropriate Bonferroni correction being made for multiple comparisons.
Table 5. PCR primers used in the present study.
Product length (bp) Gene (accession number) Primer sequences (5¢- to 3¢)
Acknowledgements
This research was supported by Basic Science Research Program through the National Research Foundation of Korea (NRF) funded by the Ministry of Education, Science and Technology (2010-0028646).
CD163 Sense: 736 AGCTGGGCTGTGCAGACAACG (XM_053094.2) Antisense: TGAATGACCCCCGAGGATTTCAGC CYP1A1 Sense: 331 CTGGTTCTGGATACCCAGCTG (X00469) Antisense: CCTAGGGTTGGTTACCAGG
References
1 Jacob A, Zhou M, Wu R & Wang P (2009) The role of hepatic cytochrome P-450 in sepsis. Int J Clin Exp Med 2, 203–211.
2 Llewelyn M & Cohen J (2002) Superantigens: microbial agents that corrupt immunity. Lancet Infect Dis 2, 156– 162.
3 Aninat C, Seguin P, Descheemaeker PN, Morel F, Mal- ledant Y & Guillouzo A (2008) Catecholamines induce an inflammatory response in human hepatocytes. Crit Care Med 36, 848–854.
4 Anzenbacher P & Anzenbacherova E (2001) Cyto-
chromes P450 and metabolism of xenobiotics. Cell Mol Life Sci 58, 737–747.
5 Aitken AE, Richardson TA & Morgan ET (2006) Regu- lation of drug-metabolizing enzymes and transporters in inflammation. Annu Rev Pharmacol Toxicol 46, 123– 149.
6 Lee SH & Lee SM (2005) Suppression of hepatic cyto- chrome p450-mediated drug metabolism during the late stage of sepsis in rats. Shock 23, 144–149.
7 van der Poll T & Opal SM (2008) Host-pathogen inter-
actions in sepsis. Lancet Infect Dis 8, 32–43.
8 Cinel I & Opal SM (2009) Molecular biology of inflam-
mation and sepsis: a primer. Crit Care Med 37, 291–304.
9 Ghose R, White D, Guo T, Vallejo J & Karpen SJ
(2008) Regulation of hepatic drug-metabolizing enzyme genes by Toll-like receptor 4 signaling is independent of Toll-interleukin 1 receptor domain-containing adaptor protein. Drug Metab Dispos 36, 95–101.
10 Ghose R, Guo T & Haque N (2009) Regulation of gene expression of hepatic drug metabolizing enzymes and transporters by the Toll-like receptor 2 ligand, lipotei- choic acid. Arch Biochem Biophys 481, 123–130.
30 s, 60 (cid:2)C for 30 s, 72 (cid:2)C for 60 s, 23 cycles for CYP2E1; 94 (cid:2)C for 30 s, 62 (cid:2)C for 30 s, 72 (cid:2)C for 60 s, 22 cycles and 23 cycles for CYP1A2 and CYP2B1, respectively; and 94 (cid:2)C for 30 s, 54 (cid:2)C for 30 s, 72 (cid:2)C for 60 s, 26 cycles, 25 cycles and 25 cycles for TNF-a, IL-6 and b-actin, respectively. After RT-PCR, 10 lL samples of the amplified products were resolved by electrophoresis in 1.5% agarose gel, and stained with ethidium bromide. The intensity of each PCR product was semi-quantitatively evaluated using a digital camera (DC120; Eastman Kodak, New Haven, CT, USA) and densitometric scanning analysis software (1d main; Advanced American Biotechnology, Fullerton, CA, USA).
Statistical analysis
11 Miyaso H, Morimoto Y, Ozaki M, Haga S, Shinoura S, Choda Y, Murata H, Katsuno G, Huda K, Takahashi H et al. (2006) Protective effects of nafamostat mesilate on liver injury induced by lipopolysaccharide in rats: possible involvement of CD14 and TLR-4 downregula- tion on Kupffer cells. Dig Dis Sci 51, 2007–2012.
12 Ojaniemi M, Liljeroos M, Harju K, Sormunen R, Vuol- teenaho R & Hallman M (2006) TLR-2 is upregulated
All results are presented as the mean ± SEM. Overall sig- tested by one-way analysis of variance. nificance was P < 0.05 was considered statistically significant for differ- ences between groups at specific time points, with the
FEBS Journal 278 (2011) 2307–2317 ª 2011 The Authors Journal compilation ª 2011 FEBS
2315
CYP1A2 Sense: 302 CAGTCACAACAGCCATCTTC (X01031) Antisense: CCACTGCTTCTCATCATGGT CYP2B1 Sense: 443 TTGTTTGGTGCTGGGACAGAG (XM_342078) Antisense: GGCTAGGCCCTCTCCTGCACA 311 CYP2E1 Sense: AAACTTCATGAAGAAATTGAC (M20131) Antisense: TCTCCAACACACACACGCTTTCC 346 Sense: GTAGCCCACGTCGTAGCAAA TNF-a (X66539) Antisense: CCCTTCTCCAGCTGGAAGAC 678 IL-6 Sense: GAAAGTCAACTCCATCTGCC (NM_012589) Antisense: CATAGCACACTAGGTTTGCC 764 Sense: TTGTAACCAACTGGGACGATATGG b-actin (BC063166) Antisense: GATCTTGATCTTCATGGTGCTAG
27 Kumar H, Kawai T & Akira S (2009) Toll-like recep- tors and innate immunity. Biochem Biophys Res Com- mun 388, 621–625.
and mobilized to the hepatocyte plasma membrane in the space of Disse and to the Kupffer cells TLR-4 dependently during acute endotoxemia in mice. Immunol Lett 102, 158–168.
28 Wu J, Meng Z, Jiang M, Zhang E, Trippler M, Broer- ing R, Bucchi A, Krux F, Dittmer U, Yang D et al. (2010) Toll-like receptor-induced innate immune responses in non-parenchymal liver cells are cell type- specific. Immunology 129, 363–374.
13 Zhao ZF, Han DW, Liu MS, Zhang GY, Zhang Y, Yang H & Yang LX (2007) [Expression of HMGB-1 and its extracellular release of cultured primary hepatic parenchymal cells and Kupffer cells induced by LPS]. Zhonghua Gan Zang Bing Za Zhi 15, 676–680.
29 Tsujimoto H, Ono S, Majima T, Kawarabayashi N, Ta- kayama E, Kinoshita M, Seki S, Hiraide H, Moldawer LL & Mochizuki H (2005) Neutrophil elastase, MIP-2, and TLR-4 expression during human and experimental sepsis. Shock 23, 39–44.
30 Chaluvadi MR, Nyagode BA, Kinloch RD & Morgan
14 Gregory SH & Wing EJ (2002) Neutrophil-Kupffer cell interaction: a critical component of host defenses to sys- temic bacterial infections. J Leukoc Biol 72, 239–248. 15 Hardonk MJ, Dijkhuis FW, Hulstaert CE & Koudstaal J (1992) Heterogeneity of rat liver and spleen macro- phages in gadolinium chloride-induced elimination and repopulation. J Leukoc Biol 52, 296–302.
ET (2009) TLR4-dependent and -independent regula- tion of hepatic cytochrome P450 in mice with chemi- cally induced inflammatory bowel disease. Biochem Pharmacol 77, 464–471.
16 Xu DX, Wei W, Sun MF, Wu CY, Wang JP, Wei LZ & Zhou CF (2004) Kupffer cells and reactive oxygen species partially mediate lipopolysaccharide-induced downregulation of nuclear receptor pregnane X receptor and its target gene CYP3a in mouse liver. Free Radic Biol Med 37, 10–22.
31 Richardson TA, Sherman M, Antonovic L, Kardar SS, Strobel HW, Kalman D & Morgan ET (2006) Hepatic and renal cytochrome p450 gene regulation during cit- robacter rodentium infection in wild-type and toll-like receptor 4 mutant mice. Drug Metab Dispos 34, 354–360.
17 Lee SH, Clemens MG & Lee SM (2010) Role of Kupf- fer cells in vascular stress genes during trauma and sep- sis. J Surg Res 158, 104–111.
32 Milosevic N, Schawalder H & Maier P (1999) Kupffer cell-mediated differential down-regulation of cyto- chrome P450 metabolism in rat hepatocytes. Eur J Pharmacol 368, 75–87.
18 Morgan ET (2001) Regulation of cytochrome p450 by inflammatory mediators: why and how? Drug Metab Dispos 29, 207–212.
19 Paine AJ (1995) Heterogeneity of cytochrome P450 and its toxicological significance. Hum Exp Toxicol 14, 1–7.
20 Gonzalez FJ (1988) The molecular biology of cyto-
chrome P450s. Pharmacol Rev 40, 243–288.
33 Wu R, Cui X, Dong W, Zhou M, Simms HH & Wang P (2006) Suppression of hepatocyte CYP1A2 expression by Kupffer cells via AhR pathway: the central role of proinflammatory cytokines. Int J Mol Med 18, 339–346. 34 Sims GP, Rowe DC, Rietdijk ST, Herbst R & Coyle AJ (2010) HMGB1 and RAGE in inflammation and can- cer. Annu Rev Immunol 28, 367–388.
35 Ulloa L, Ochani M, Yang H, Tanovic M, Halperin D,
21 Shimada T & Fujii-Kuriyama Y (2004) Metabolic acti- vation of polycyclic aromatic hydrocarbons to carcino- gens by cytochromes P450 1A1 and 1B1. Cancer Sci 95, 1–6.
Yang R, Czura CJ, Fink MP & Tracey KJ (2002) Ethyl pyruvate prevents lethality in mice with established lethal sepsis and systemic inflammation. Proc Natl Acad Sci USA 99, 12351–12356.
22 El-Kadi AO, Bleau AM, Dumont I, Maurice H & du Souich P (2000) Role of reactive oxygen intermediates in the decrease of hepatic cytochrome P450 activity by serum of humans and rabbits with an acute inflamma- tory reaction. Drug Metab Dispos 28, 1112–1120.
23 Rhee SG (1999) Redox signaling: hydrogen peroxide as
intracellular messenger. Exp Mol Med 31, 53–59.
36 Park JS, Svetkauskaite D, He Q, Kim JY, Strassheim D, Ishizaka A & Abraham E (2004) Involvement of toll-like receptors 2 and 4 in cellular activation by high mobility group box 1 protein. J Biol Chem 279, 7370– 7377.
24 Spolarics Z (1998) Endotoxemia, pentose cycle, and the oxidant ⁄ antioxidant balance in the hepatic sinusoid. J Leukoc Biol 63, 534–541.
37 Chaudry IH, Wichterman KA & Baue AE (1979) Effect of sepsis on tissue adenine nucleotide levels. Surgery 85, 205–211.
38 Buege JA & Aust SD (1978) Microsomal lipid peroxida-
tion. Methods Enzymol 52, 302–310.
25 Rivera CA, Bradford BU, Hunt KJ, Adachi Y, Schrum LW, Koop DR, Burchardt ER, Rippe RA & Thurman RG (2001) Attenuation of CCl(4)-induced hepatic fibro- sis by GdCl(3) treatment or dietary glycine. Am J Phys- iol Gastrointest Liver Physiol 281, G200–207. 26 Hakkola J, Hu Y & Ingelman-Sundberg M (2003)
39 Anderson ME (1985) Determination of glutathione and glutathione disulfide in biological samples. Methods Enzymol 113, 548–555.
40 Omura T & Sato R (1964) The carbon monoxide-bind- ing pigment of liver microsomes. II. Solubilization,
Mechanisms of down-regulation of CYP2E1 expression by inflammatory cytokines in rat hepatoma cells. J Pharmacol Exp Ther 304, 1048–1054.
FEBS Journal 278 (2011) 2307–2317 ª 2011 The Authors Journal compilation ª 2011 FEBS
2316
T.-H. Kim et al. KCs in drug-metabolizing dysfunction during sepsis
purification, and properties. J Biol Chem 239, 2379– 2385.
of substrates to distinguish between different induced cytochromes P-450. Biochem Pharmacol 34, 3337–3345.
43 Schenkman JB, Remmer H & Estabrook RW (1967)
Spectral studies of drug interaction with hepatic micro- somal cytochrome. Mol Pharmacol 3, 113–123.
41 Vermilion JL & Coon MJ (1978) Identification of the high and low potential flavins of liver microsomal NADPH-cytochrome P-450 reductase. J Biol Chem 253, 8812–8819.
42 Burke MD, Thompson S, Elcombe CR, Halpert J,
Haaparanta T & Mayer RT (1985) Ethoxy-, pentoxy- and benzyloxyphenoxazones and homologues: a series
44 Chomczynski P & Sacchi N (1987) Single-step method of RNA isolation by acid guanidinium thiocyanate- phenol-chloroform extraction. Anal Biochem 162, 156–159.
FEBS Journal 278 (2011) 2307–2317 ª 2011 The Authors Journal compilation ª 2011 FEBS
2317
T.-H. Kim et al. KCs in drug-metabolizing dysfunction during sepsis