Lecture 19

Recap
Checking an Algorithm Analysis
Limitations of Big-Oh Analysis
MATLAB Environment
Command Window
Command History
Workspace Window
Current Folder Window
Document Window

Graphics Window
The graphics window launches automatically when
request to a graph is made
To demonstrate this feature, first create an array of x
values:
x = [1 2 3 4 5];
Now create a list of y values:
y = [10 20 30 40 50];
To create a graph, use the plot command:
plot(x,y)
The graphics window opens automatically
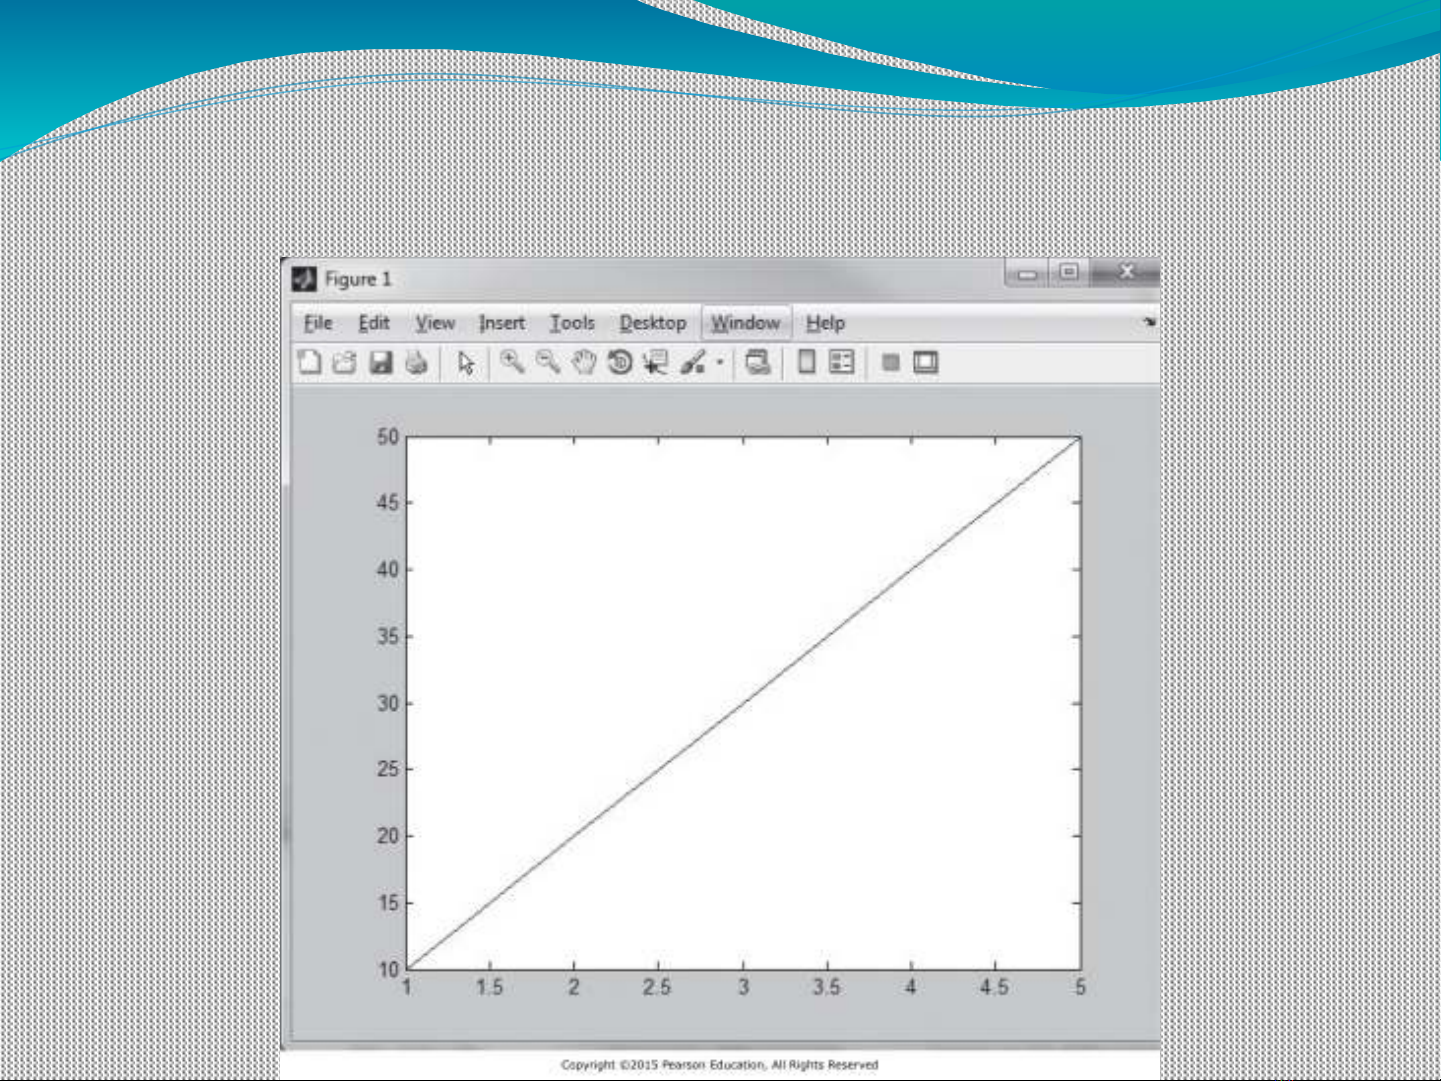
Graphic Window

Edit Window
To open the edit window, choose File from the menu bar,
then New , and, finally
Script ( File ->New ->Script )
This window allows to type and save a series of
commands without executing them
Edit window can also be opened by typing edit at the
command prompt or by selecting the New Script button
on the toolbar