EURASIP Journal on Applied Signal Processing 2005:18, 2979–2990 c(cid:1) 2005 Hindawi Publishing Corporation
The Effects of Noise on Speech Recognition in Cochlear Implant Subjects: Predictions and Analysis Using Acoustic Models
Jeremiah J. Remus Department of Electrical & Computer Engineering, Pratt School of Engineering, Duke University, P.O. Box 90291, Durham, NC 27708-0291, USA Email: jeremiah.remus@duke.edu
Leslie M. Collins Department of Electrical & Computer Engineering, Pratt School of Engineering, Duke University, P.O. Box 90291, Durham, NC 27708-0291, USA Email: lcollins@ee.duke.edu
Received 1 May 2004; Revised 30 September 2004
Cochlear implants can provide partial restoration of hearing, even with limited spectral resolution and loss of fine temporal structure, to severely deafened individuals. Studies have indicated that background noise has significant deleterious effects on the speech recognition performance of cochlear implant patients. This study investigates the effects of noise on speech recognition using acoustic models of two cochlear implant speech processors and several predictive signal-processing-based analyses. The results of a listening test for vowel and consonant recognition in noise are presented and analyzed using the rate of phonemic feature transmission for each acoustic model. Three methods for predicting patterns of consonant and vowel confusion that are based on signal processing techniques calculating a quantitative difference between speech tokens are developed and tested using the listening test results. Results of the listening test and confusion predictions are discussed in terms of comparisons between acoustic models and confusion prediction performance.
Keywords and phrases: speech perception, confusion prediction, acoustic model, cochlear implant.
1.
INTRODUCTION
and the structure of the noise and speech signals. Not all of these relationships are well understood. It is generally pre- sumed that increasing the level of noise will have a nega- tive effect on speech recognition. However, the magnitude and manner in which speech recognition is affected is more ambiguous. Particular speech processing strategies may be more resistant to the effects of certain types of noise, or noise in general. Other devices parameters, such as the number of channels, number of stimulation levels, and compression mapping algorithms, have also been shown to influence how speech recognition will be affected by noise [4, 5, 6]. The effects of noise also depend on the type of speech materi- als and the linguistic knowledge of the listener. With all of these interdependent factors, the relationship between noise and speech recognition is quite complex and requires careful study.
The purpose of a cochlear implant is to restore some degree of hearing to a severely deafened individual. Among indi- viduals receiving cochlear implants, speech recognition per- formance varies, but studies have shown that a high level of speech understanding is achievable by individuals with suc- cessful implantations. The speech recognition performance of individuals with cochlear implants is measured through listening tests conducted in controlled laboratory settings, which are not representative of the typical conditions in which the devices are used by the individuals in daily life. Numerous studies have indicated that a cochlear implant pa- tient’s ability to understand speech effectively is particularly susceptible to noise [1, 2, 3]. This is likely due to a variety of factors, such as limited spectral resolution, loss of fine tem- poral structure, and impaired sound-localization abilities.
The goals of this study were to analyze and predict the effects of noise on speech processed by two acoustic mod- els of cochlear implant speech processors. The listening test was conducted to examine the effects of noise on speech
The manner and extent to which noise affects cochlear implantee’s speech recognition can depend on individual characteristics of the patient, the cochlear implant device,
2980
EURASIP Journal on Applied Signal Processing
subjects are often only indicative of trends in cochlear im- plant patient’s performance; absolute levels of performance tend to disagree [1, 11]. There are several sources of discrep- ancies between the performance of cochlear implant subjects and normal-hearing subjects using acoustic models, such as experience with the device, acclimation to spectrally quan- tized speech, and the idealistic rate of speech information transmission through the acoustic model. However, acous- tic models are still an essential tool for cochlear implant re- search. Their use is validated by numerous studies where cochlear implant patient’s results were successfully verified and by the flexibility they provide in testing potential speech processing strategies [12, 13].
recognition scores using a complete range of noise levels. Information transmission analysis was performed to illus- trate the results of the listening test and to verify assump- tions regarding the acoustic models. The confusion predic- tion methods were developed to investigate whether a signal processing algorithm would predict patterns of token confu- sion similar to those seen in the listening test. The use of the similarities and differences between speech tokens for pre- diction of speech recognition and intelligibility has a basis in previous studies. M¨usch and Buus [7, 8] used statistical decision theory to predict speech intelligibility by calculating the correlation between variations of orthogonal templates of speech tokens. A mathematical model developed by Svirsky [9] used the ratio of frequency-channel amplitudes to locate phonemes in a multidimensional perceptual space. A study by Leijon [10] used hidden Markov models to approximate the rate of information transmitted through a given acoustic environment, such as a person with a hearing aid.
Subjects Twelve normal-hearing subjects were recruited to participate in a listening test using two acoustic models for vowel and consonant materials in noise. Prior to the listening tests, sub- jects’ audiograms were measured to evaluate thresholds at 250 Hz, 500 Hz, 1 kHz, 2 kHz, 4 kHz, and 8 kHz to confirm normal hearing, defined in this study as thresholds within two standard deviations of the subject group’s mean. Sub- jects were paid for their participation. The protocol and im- plementation of this experiment were approved by the Duke University Institutional Review Board (IRB).
The motivation for estimating trends in token confusions and overall confusion rate, based solely on information in the processed speech signal, is to enable preliminary anal- ysis of speech materials prior to conducting listening tests. Additionally, a method that estimates token confusions and overall confusion rate would have applications in the devel- opment of speech processing methods and noise mitigation techniques. Sets of processed speech tokens that are readily distinguishable by the confusion prediction method should also be readily distinguishable by cochlear implantees, if the prediction method is well conceived and robust.
Speech materials Vowel and consonant tokens were taken from the Revised Cochlear Implant Test Battery [14]. The vowel tokens used in the listening test were {had, hawed, head, heard, heed, hid, hood, hud, who’d}. The consonants tested were {b, d, f, g, j, k, m, n, p, s, sh, t, v, z} presented in /aCa/ context. The listening test was conducted at nine signal-to-noise ra- tios: quiet, +10 dB, +8 dB, +6 dB, +4 dB, +2 dB, +1 dB, 0 dB, and −2 dB. Pilot studies and previous studies in the literature [3, 5, 15, 16] indicated that this range of SNRs would provide a survey of speech recognition ability over the range of scores from nearly perfect correct identification to performance on par with random guessing. Speech-shaped noise, that is, ran- dom noise with a frequency spectrum that matches the av- erage long-term spectrum of speech, is added to the speech signal prior to acoustic model processing.
The rest of this paper is organized as follows. Section 2 discusses the listening test conducted in this study. The ex- perimental methods using normal-hearing subjects and the information transmission analysis of vowel and consonant confusions are detailed. Results, in the form of speech recog- nition scores and information transmission analyses, are pro- vided and discussed. Section 3 describes the methods and re- sults of the vowel and consonant confusion predictions de- veloped using signal processing techniques. The methods of speech signal representation and prediction metric calcula- tion are described, and potential variations are addressed. Results are presented to gauge the overall accuracy of the in- vestigated confusion prediction methods for vowels and con- sonants processed with each of the two acoustic models.
2. LISTENING TEST
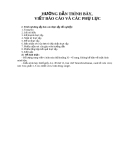
Signal processing This experiment made use of two acoustic models imple- mented by Throckmorton and Collins [17], based on acous- tic models developed in [18, 19]. The models will be re- ferred to as the 8F model and the 6/20F model, named for the number of presentation and analysis channels. A block diagram of the general processing common to both acoustic models is shown in Figure 1. With each model, the incoming speech is prefiltered using a first-order highpass filter with a 1 kHz cutoff frequency, to equalize the spectrum of the in- coming signal. It is then passed through a 6th-order antialias- ing Butterworth lowpass filter with an 11 kHz cutoff. Next, the filterbank separates the speech signal into M channels using 6th-order Chebyshev filters with no passband overlap.
The listening test measured normal-hearing subjects’ abil- ities to recognize noisy vowel and consonant tokens pro- cessed by two acoustic models. Using acoustic models to test normal-hearing subjects for cochlear implant research is a widely used and well-accepted method for collecting exper- imental data. Normal-hearing subjects provide a number of advantages: they are more numerous and easier to recruit, the experimental setups tend to be less involved, and there are not subject variables, such as experience with cochlear implant device, type of implanted device, cause of deafness, and quality of implantation, that affect individual patient’s performance. Results of listening tests using normal-hearing
Predicting Token Confusions in Implant Patients
2981
Bandpass filterbank Amplitude modulation/ channel comparator Ch. 1
(cid:1)
Ch. 2 Speech Discrete envelope detector X cos(2π fc1) X cos(2π fc2) Model output Highpass prefiltering/ lowpass antialias filtering .. . .. . .. . 6/20F only .. . .. .
Ch. 8 (8F) or Ch. 20 (6/20F) X cos(2π fcN )
Figure 1: Block diagram of acoustic model. Temporal resolution is equivalent in both models, with channel envelopes discretized over 2- millisecond windows. In each 2-millisecond window, the 8F model presents speech information from 150 Hz to 6450 Hz divided amongst eight channels, whereas the 6/20F model presents six channels, each with narrower bandwidth, chosen from twenty channels spanning 250 Hz to 10823 Hz.
Each channel is full-wave rectified and lowpass filtered us- ing an 8th-order Chebyshev with 400 Hz cutoff to extract the signal envelope for each frequency channel. The envelope is discretized over the processing window of length L using the root-mean-square value.
and sources of background noise, with stimuli stored on disk and presented through headphones. Subjects recorded their responses using the computer mouse and graphical user in- terface to select what they had heard from the set of tokens. Subjects were trained prior to the tests on the same speech materials processed through the acoustic models to provide experience with the processed speech and mitigate learning effects. Feedback was provided during training.
The numbers of channels and channel cutoff frequen- cies for the two acoustic models used in this study were chosen to mimic two popular cochlear implant speech pro- cessors. For the 8F model, the prefiltered speech is filtered into eight logarithmically spaced frequency channels cover- ing 150 Hz to 6450 Hz. For the 6/20F model, the prefiltered speech is filtered into twenty frequency channels covering 250 Hz to 10823 Hz, with linearly spaced cutoff frequencies up to 1.5 kHz and logarithmically spaced cutoff frequencies for higher filters. The discrete envelope for both models is calculated over a two-millisecond window, corresponding to 44 samples for speech recorded at a sampling frequency of 22050 Hz.
Testing began in quiet and advanced to increasingly noisy conditions with two repetitions of a randomly ordered vowel or consonant token set for training, followed by five repe- titions of the same randomly ordered token set for testing. The order of presentation of test stimuli and acoustic mod- els were randomly assigned and balanced among subjects to neutralize any effects of experience with the previous model or test stimulus in the pooled results. Equal numbers of test materials were presented for each test condition, defined by the specific acoustic model and signal-to-noise ratio.
The model output is assembled by determining a set of presentation channels, the set of frequency channels to be presented in the current processing window, then amplitude modulating each presentation channel with a separate sine- wave carrier and summing the set of modulated presentation channels. In each processing window, a set of N (N ≤ M) channels is chosen to be presented. All eight frequency chan- nels are presented (N = M = 8) with the 8F model. With the 6/20F model, only the six channels with the largest am- plitude in each processing window are presented (N = 6, M = 20). The carrier frequency for each presentation chan- nel corresponds to the midpoint on the cochlea between the physical locations of the channel bandpass cutoff frequen- cies. The discrete envelopes of the presentation channels are amplitude modulated with sinusoidal carriers at the calcu- lated carrier frequencies, summed, and stored as the model output.
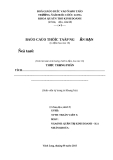
Results The subjects’ responses from the vowel and consonant tests at each SNR for each acoustic model were pooled for all twelve subjects. The results are plotted for all noise levels in Figure 2. Statistical significance, indicated by asterisks, was determined using the arcsine transform [20] to calculate the 95% confidence intervals. The error bars in Figure 2 indicate one standard deviation, which were also calculated using the arcsine transform. The vowel recognition scores show that the 6/20F model significantly outperforms the 8F model at all noise levels. An approximately equivalent level of perfor- mance was achieved with both acoustic models on the con- sonant recognition test, with differences between scores at most SNRs not statistically significant. Vowel recognition is heavily dependent on the localization of formant frequen- cies, so it is reasonable that subjects using the 6/20F model, with 20 spectral channels, perform better on vowel recogni- tion.
Procedure The listening tests were conducted in a double-walled sound- insulated booth, separate from the computer, experimenter,
At each SNR, results of the vowel and consonant test were pooled across subjects and tallied in confusion matrices, with
2982
EURASIP Journal on Applied Signal Processing
100 100
90 90
80 80
)
)
70 70
%
%
(
(
60 60
t c e r r o C
t c e r r o C
50 50
40 40
30 30
20 20
10 10
−2
−2
0 0 0 2 4 6 8 10 Quiet 0 2 4 6 8 10 Quiet SNR (dB) SNR (dB)
6/20F 8F 6/20F 8F (a) (b)
Figure 2: (a) Vowel token recognition scores. (b) Consonant token recognition scores.
applied to vowels, classified by the first formant frequency, the second formant frequency, and duration. The feature classification matrices are shown in Table 2. Information transmission analysis calculates the transmission rate of these individual features, providing a summary of the distribution of incorrect responses, which contains useful information unavailable from a simple token recognition score.
rows corresponding to the actual token played, and columns indicating the token chosen by the subject. An example con- fusion matrix is shown in Table 1. Correct responses lie along the diagonal of the confusion matrix. The confusion matri- ces gathered from the vowel and consonant test can be an- alyzed based on the arrangement and frequency of incorrect responses. One such method of analysis is information trans- mission analysis, developed by Miller and Nicely in [21]. In each set of tokens presented, it is intuitive that some incor- rect responses will occur more frequently than others, due to common phonetic features of the tokens. The Miller and Nicely method groups tokens based on the common pho- netic features and calculates information transmission using the mean logarithmic probability (MLP) and mutual infor- mation T(x; y) which can be considered the transmission from x to y in bits per stimulus. In the equations below, pi is the probability of confusion, N is the number of entries in the matrix, ni is the sum of the ith row, n j is the sum of the jth column, and ni j is a value from the confusion ma- trix resulting from grouping tokens with common phonetic features:
(cid:2)
MLP(x) = −
pi log pi,
i
T(x; y) = MLP(x) + MLP(y) − MLP(xy)
(1)
(cid:2)
= −
.
ni j N log2
nin j Nni j
i, j
Figure 3 shows the consonant feature percent trans- mission, with percent correct recognition or “score” from Figure 2 included, for the 6/20F model and 8F model. The plots exhibit some deviation from the expected monotonic result; however, this is likely due to sample variability and variations in the random samples of additive noise used to process the tokens. It appears that increasing levels of noise deleteriously affect all consonant features for both acoustic models. It is interesting to note that consonant recognition scores for the 6/20F model and 8F model are nearly identical, but feature transmission levels are quite different. The dif- ferences in the two acoustic models result in two distinct sets of information that result in approximately the same level of consonant recognition. A previous study by Fu et al. [3] performed information transmission analyses on consonant data for 8-of-8 and 6-of-20 models and calculated closely grouped feature transmission rates at each SNR for both models, resembling the 8F results shown here. Both Fu et al. models as well as the 8F model in this study have similar model bandwidths, and it is possible that the inclusion of higher frequencies in the 6/20F model and their effect on channel location and selection of presentation channels results in the observed spread of feature transmission rates. Further comments on these results are presented in the discussion.
The consonant tokens were classified using the five fea- tures in Miller and Nicely—voicing, nasality, affrication, du- ration, and place. Information transmission analysis was also
Predicting Token Confusions in Implant Patients
2983
Table 1: Example confusion matrix for 8F vowels at +1 dB SNR. Responses are pooled from all test subjects.
8F acoustic model, SNR = 1 dB Responded
Played
had hawed head heard heed hid hood hud who’d
hawed 10 53 2 2 0 2 2 19 1
head 12 0 19 4 1 15 4 1 1
heard 3 1 5 34 6 2 6 2 7
heed 0 1 3 1 31 6 4 0 2
had 29 0 9 0 2 2 0 1 1
hid 0 0 14 4 0 26 2 0 1
hood 1 0 5 9 7 2 26 3 12
hud 5 4 2 3 0 3 4 31 0
who’d 0 1 1 3 13 2 12 3 35
Table 2: Information transmission analysis classification matrices for (a) consonants and (b) vowels. The numbers in each column indicate which tokens are grouped together for analysis of each of the features. For some features, multiple groups are defined.
at all noise levels using the 6/20F model translate to greater transmission of all vowel features at all noise levels. Hence, the better performance of the 6/20F model is not due to more effective transmission of any one feature.
(a)
3. CONFUSION PREDICTIONS
Consonants
Several signal processing techniques were developed in the context of this research to measure similarities between pro- cessed speech tokens for the purpose of predicting patterns of vowel and consonant confusions. The use of the similarities and differences between speech tokens has a basis in previous studies predicting speech intelligibility [7, 8], and investigat- ing the perception of speech tokens presented through an impaired auditory system [10] and processed by a cochlear implant [9].
b d f g j k m n p s sh t v z
Voicing Nasality Affrication Duration Place 0 0 1 0 0 0 0 0 0 1 1 0 1 1
0 0 0 0 0 0 0 0 0 1 1 0 0 1
0 1 0 4 3 4 0 1 0 2 3 1 0 2
0 0 0 0 0 0 1 1 0 0 0 0 0 0
1 1 0 1 1 0 1 1 0 0 0 0 1 1
(b)
Vowels
Duration
F1
F2
The three prediction methods that are developed in this study use two different signal representations and three dif- ferent signal processing methods. The first method is to- ken envelope correlation (TEC), which calculates the cor- relation between the discrete envelopes of each pair of to- kens. The second method is dynamic time warping (DTW) using the cepstrum representation of the speech token. The third prediction method uses the cepstrum representation and hidden Markov models (HMMs). These three methods provide for comparison a method using only the tempo- ral information (TEC), a deterministic measure of distance between the speech cepstrums (DTW), and a probabilistic distance measure using a statistical model of the cepstrum (HMM).
had hawed head heard heed hid hood hud who’d
2 2 1 1 0 1 1 2 0
1 0 1 0 1 1 0 0 0
2 1 1 1 2 0 0 0 0
Dynamic time warping For DTW [22], the (ith, jth) entry in the prediction metric matrix is the value of the minimum-cost mapping through a cost matrix of Euclidean distances between the cepstrum coefficients of the ith given token and the jth response to- ken. To calculate the (ith, jth) entry in the prediction metric matrix, the cepstrum coefficients are computed from energy- normalized speech tokens. A cost matrix is constructed from the cepstrums of the two tokens. Each row of the cost matrix
The patterns of feature transmission are much more con- sistent between the two acoustic models for vowels, as shown in Figure 4. The significantly higher vowel recognition scores
2984
EURASIP Journal on Applied Signal Processing
100 100 90 90
80 80
)
)
%
%
70 70
60 60
( n o i s s i
( n o i s s i
50 50
m s n a r T
m s n a r T
40 40
30 30
20 20
10 10
−2
−2
0 0 0 2 4 6 8 10 Quiet 0 2 4 6 8 10 Quiet SNR (dB) SNR (dB)
Voicing Nasality Affrication Duration Place Score Voicing Nasality Affrication Duration Place Score
(a) (b)
Figure 3: (a) 6/20F consonant information transmission analysis. (b) 8F consonant information transmission analysis.
direction, and weighting parameter, the cumulative cost ma- trix is calculated as
(cid:12)
(cid:11)
(cid:12)
1.5 · dn+1,m+1 + min if min
Dn,m, Dn+1,m, Dn,m+1
(cid:11) Dn,m, Dn+1,m, Dn,m+1 = Dn,m, (cid:12)
Dn+1,m+1 =
specifies a vector of cepstrum coefficients calculated during one window of the given signal, each column corresponds to a vector of cepstrum coefficients calculated during one win- dow of the response signal, and the entry in the cost ma- trix is a measure of distance between the two vectors. In this project, the coefficient vector differences were quantified us- ing the Euclidean distance d2(x, y),
(cid:11) Dn,m, Dn+1,m, Dn,m+1
dn+1,m+1 + min
(cid:11)
(cid:12)
if min
Dn,m, Dn+1,m, Dn,m+1
(cid:2)= Dn,m.
N(cid:2)
(cid:3) (cid:4) (cid:4) (cid:4) (cid:5)
(cid:6) (cid:6)2.
(3)
(cid:6) (cid:6)xk − yk
(2)
d2(x, y) =
k=1
The value of the minimum-cost path from (1,1) to (N, M) is DN,M. The final value of the prediction metric is the mini- mum cost DN,M divided by the number of steps in the path to normalize values for different token lengths. Diagonal steps are counted as two steps when determining the path length.
Token envelope correlation For TEC, the (ith, jth) entry in the prediction metric ma- trix is the normalized inner product of the discrete envelopes of two processed speech tokens that have been temporally aligned using dynamic time warping. The discrete envelope was originally calculated as a step in the acoustic model pro- cessing. The discrete envelope used in TEC is similar to the discrete envelope calculated in the acoustic model, with a lower cutoff frequency on the envelope extraction filter.
The minimum-cost path is defined as the contiguous se- quence of cost matrix entries from (1,1) to (N, M), where N is the length of the given token cepstrum and M is the length of the response token cepstrum, such that the sum of the sequence entries is minimized. To reduce the complex- ity of searching for the minimum-cost path, sequence steps are restricted to three cases: horizontal (n, m + 1), vertical (n + 1, m), and diagonal (n + 1, m + 1). Additionally, since the shortest path from (1,1) to (N, M) will be nearly diagonal, the cost matrix entry is multiplied with a weighting parame- ter in the case of a diagonal step, to prevent the shortest path from becoming the default minimum-cost path. The value for the weighting parameter, equal to 1.5 in this study, can be increased or decreased resulting in a lesser or greater propen- sity for diagonal steps.
Next, the cumulative minimum-cost matrix Di j contain- ing the sum of the entries for the minimum-cost path from (1,1) to any point (n, m) in the cost matrix is calculated. Given the restrictions on sequence-step-size, sequence step
The cepstrums of the ith processed given token and the jth processed response token are used in the DTW proce- dure to calculate the minimum-cost path for the two tokens. The minimum-cost path is then used to temporally align the two discrete envelopes, addressing the issue of different token
Predicting Token Confusions in Implant Patients
2985
100 100
90 90
80 80
)
)
%
%
70 70
( n o i s s i
( n o i s s i
60 60
50 50
m s n a r T
m s n a r T
40 40
30 30
20 20
10 10
−2
−2
0 0 0 2 4 6 8 10 Quiet 0 2 4 6 8 10 Quiet SNR (dB) SNR (dB)
Duration F1 F2 Score Duration F1 F2 Score
(a) (b)
Figure 4: (a) 6/20F vowel information transmission analysis. (b) 8F vowel information transmission analysis.
lengths in a more elegant manner than simple zero padding. Using DTW to align the signals injects flexibility in the align- ment to account for potential listener ambiguity regarding the starting point and pace of the speech token.
After alignment of the given token and response token,
the final value of the prediction metric can be calculated as
random values. A k-means algorithm was used to initialize the state-observation probability distributions. The proba- bility of an observation was determined using the forward al- gorithm [23] to calculate P(O1O2 · · · OT , qT = Si | λ), where Oi is the ith element in the observation sequence, qT = Si in- dicates that the model is in the ith state at time T, and λ are the HMM parameters.
(cid:13)
,
(4)
Mi, j =
xi T xi
T y j (cid:14) y j
xi
T y j
where xi is the discrete envelope of the ith given token, y j is the discrete envelope of the jth response token, and Mi, j is the (ith, jth) entry in the prediction metric matrix.
Prediction performance The accuracy of each prediction method was verified using the vowel and consonant confusion matrices generated in the listening test as basis for comparison. The confusion matrices at each of the eight noise levels and in quiet were pooled to produce a general pattern of confusions independent of any specific noise level. Combining the confusion matrices across noise levels was justified by information transmission analy- ses, which indicated that increasing the amount of additive noise most significantly affected the rate of confusions rather than the pattern of confusions.
The first
test of confusion prediction performance gauged the ability to predict the most frequent incorrect re- sponses (MFIRs). The prediction of MFIRs was measured in terms of successful near predictions, defined as the case where one token in the set of MFIRs matches one token in the predicted set of MFIRs. Sets of two tokens were used for vowel near predictions (25% of possible incorrect re- sponses), three tokens for consonants (23% of possible in- correct responses). For example, if the two MFIRs for “head” were “hid” and “had,” then either “hid” or “had” would have to be one of the two predicted MFIRs for a successful near prediction. Measuring prediction performance using near
Hidden Markov models The third prediction method is based on hidden Markov models (HMMs) [22, 23]. Using HMMs, the (ith, jth) entry in the prediction metric matrix is the log-likelihood that the cepstrum of the ith given token is the observation produced by the HMM for the cepstrum of the jth response token. To calculate the (ith, jth) entry in the prediction metric matrix using HMMs, a continuous-observation HMM was trained for each speech token using a training set of 100 tokens. All training data were collected from a single male speaker in quiet. HMMs were trained for different numbers of states Q and numbers of Gaussian mixtures M, with Q ranging from two to six and M ranging from two to four. Training was per- formed using the expectation-modification method to iter- atively determine the parameters that locally maximize the probability of the observation sequence. The state transition matrix and Gaussian mixture matrix were initialized using
2986
EURASIP Journal on Applied Signal Processing
)
%
g n i k n a r
100 9 90 8 80 7 70 6 60
( n o i t c i d e r p r a e n
l
u f s s e c c u s
l e w o v F 8 d e t c i d e r p C E T
f o e t a R
5 50 R2 = 0.1111 40 4 30 3 20 2 10 0 0 1 2 3 4 5 6 7 8 9 Vowels 8F Vowels 6/20F Consonants 8F Consonants 6/20F Ranking of 8F vowel experiment percent correct
TEC TEC HMM DTW Chance
Figure 6: Scatter plot for 8F vowel predicted rankings using TEC versus actual recognition rankings. Includes regression line and R2 value, corresponding to top-left value in Table 3a.
Figure 5: Most frequent incorrect response (MFIR) near predic- tions for each combination of speech material (vowel, consonant) and acoustic model (8F, 6/20F). Chance scores are included for comparison.
predictions satisfies the objective of predicting patterns in the confusions, rather than strictly requiring that the predicted MFIR was indeed the most frequent incorrect response. The purpose of measuring near predictions is to test whether the methods are distributing the correct tokens to the extremes of the confusion response spectrum.
Figure 5 shows the percentages for successful near predic- tion of the MFIR tokens for each acoustic model and token set. Percentages of successful near prediction were calculated out of possible nine trials for vowels (N = 9) and fourteen trials for consonants (N = 14). Near-perfect performance is achieved using DTW. The HMM method performs at a similarly high level. The TEC method consistently underper- forms the two methods utilizing the cepstrum coefficients for confusion prediction. Chance performance is also shown for comparison.
The fit of the predicted token recognition rankings to the actual recognition rankings was represented using linear re- gression. The coefficient of determination R2 [24] was calcu- lated for the linear regression of a scatter plot with one set of rankings plotted on the ordinate and another on the ab- scissa. R2 values were calculated for two different sets of scat- ter plots. The first set of scatter plots was created by plotting the predicted recognition rankings and token length rank- ings against the true recognition rankings. A ranking of token lengths was included to investigate any potential effects of to- ken length on either the calculation of the prediction metrics or the listening test results. Figure 6 displays an example scat- ter plot for TEC predicted 8F vowels rankings including the regression line and R2 value. Each token is represented by one point on the chart. The x-axis value is determined by token rank in terms of recognition rate in the listening test, and the y-axis value is determined by the token’s predicted recogni- tion ranking using TEC. Similar scatter plots (not shown) were created for the other prediction methods. All of the R2 values with listening test rankings on the x-axis are shown in Table 3a. A second set of scatter plots was created by assign- ing token length rankings to the x-axis, rather than listening test rankings, and using predicted rankings and listening test rankings for the y-axis values (Table 3b).
The second test of confusion prediction performance an- alyzed the ability of each method to discern how frequently each individual token will be confused, as represented by the main diagonal of the confusion matrices. Rather than pre- dicting the absolute rate of confusion, which would be de- pendent on noise level, the test evaluates the accuracy of a predicted ranking of the tokens from least to most recog- nized, or most often to least-often confused.
Table 3 shows the R2 values for the two different meth- ods of plotting. With the percent correct plotted on the x- axis, the HMM is shown to perform very well for vowel recognition rankings with either acoustic model. DTW and HMM perform similarly on 8F consonants, but not at the level of HMM on vowels. HMM performance is weaker for 6/20F consonants than for 8F consonants. Predicted recog- nition rankings for any material set using TEC do not appear promising.
To calculate the predicted ranking of the individual- token recognition rates, the off-diagonal values in each row of the prediction metric matrix were averaged and ranked, as a means of evaluating each token’s uniqueness. The more separation between the played token and the set of incorrect responses, where separation is measured by the prediction metrics, the less likely it is that an incorrect response will oc- cur.
Predicting Token Confusions in Implant Patients
2987
Table 3: Summary of coefficient of determination for linear fittings. R2 values calculated for percent correct along x-axis (a) and length along x-axis (b).
(a)
Percent correct along x-axis
Method
TEC DTW HMM Length
8F vow. 0.1111 0.0336 0.6944 0.3463
6/20F vow. 0.3403 0.0278 0.5136 0.0544
8F cons. 0.0073 0.4204 0.4261 0.0257
6/20F cons. 0.003 0.4493 0.2668 0.0333
(b)
Length along x-axis
Method
8F cons. 0.0146 0.01 0.09 0.0257
6/20F cons. 0.3443 0.0136 0.2759 0.033
TEC DTW HMM Correct (%)
8F vow. 0.0711 0.16 0.64 0.34
6/20F vow. 0.0044 0.444 0.5378 0.0544
essentially an average of the token recognition rankings cal- culated in the second task, another measure of prediction performance for which TEC scored poorly, the poor perfor- mance using TEC for this task is not surprising. However, the HMM prediction metric performed very well on the first two tasks. Based on that performance, the failure of HMMs was unexpected, especially with the accuracy of the predicted trends using DTW.
4. DISCUSSION
Investigating the potential relationship between token length and predicted recognition rankings leads to the ob- servation that HMM predicted rankings for vowels with both acoustic models and DTW predicted rankings for 6/20F vow- els appear to correspond to token length. The true recogni- tion ranking also appears related to length for 8F vowels. The relationship between HMM predicted rankings and token length can potentially be explained by the structure of the HMM. The state transition probabilities are adapted to ex- pect tokens of a certain length; longer or shorter tokens can cause state transitions that are forced early or delayed. This would affect the calculated log-likelihood values, and could result in artifacts of token length in the predicted recognition rankings.
The third task tested whether the performance gap seen in the listening test between the token sets with different materials and acoustic models was forecast by any of the prediction methods. DTW was the only method that ap- peared to have any success predicting the differences in to- ken correct identification for the different acoustic mod- els and token sets. The token identification trend lines for vowels and consonants are shown in Figure 7a. The over- all level of token recognition for any combination of to- ken set and acoustic model was predicted with DTW by averaging the off-diagonal prediction metrics. The average confusion distance is plotted as a constant versus SNR in Figure 7b since the metric is not specific to the performance at any particular noise level, and indicates that the pattern of the trends of recognition levels is reasonably well pre- dicted.
Information transmission analysis using the method devel- oped by Miller and Nicely [21] calculates how effectively the two acoustic models transmitted the features of vowels and consonants. The increased spectral resolution of the 6/20F model, credited for the better performance of the 6/20F model for vowel token recognition, also appeared in the in- formation transmission results, with proportionally greater transmission of both the F1 and F2 features. The results of the consonant feature analyses are more difficult to clas- sify. A reasonable hypothesis would be that the 8F model should more effectively transmit broadband features, since it has a continuous frequency spectrum with greater band- width than the 6/20F model. The 6/20F model should bet- ter transmit frequency-specific consonant features due to greater frequency resolution. However, many outcomes from the consonant feature transmission analysis disagree with this hypothesis. Affrication, a broadband feature, is transmit- ted with similar efficiency by both acoustic models. Voicing is relatively narrowband and suspected to be more effectively transmitted by the 6/20F model; however, it is also trans- mitted with similar efficiency by both acoustic models. The 6/20F model transmits place and duration more effectively than the 8F model. Duration is essentially a temporal fea- ture, and differences between the acoustic models should not
Predicted trends for TEC and HMM are not shown, but did not accurately indicate the trends in the listening test. The failure of TEC at the third task supports the conclusion that the strictly temporal representation lacks sufficient dis- tinguishing characteristics. Since the measure for this task is
2988
EURASIP Journal on Applied Signal Processing
25
100
20 90
80
15 70
)
%
(
e c n a t s i d n o i s u f n o c
60
50 10
t c e r r o C
e g a r e v A
40
30 5
20
10 0
−2
0 0 2 4 6 8 10 SNR (dB)
6/20F vowels 8F vowels 6/20F consonants 8F consonants 6/20F vowels 8F vowels 6/20F consonants 8F consonants
(a) (b)