
REGULAR ARTICLE
Nuclear data correlation between different isotopes via integral
information
Dimitri A. Rochman
1,*
, Eric Bauge
2
, Alexander Vasiliev
1
, Hakim Ferroukhi
1
, and Gregory Perret
1
1
Laboratory for Reactor Physics Systems Behaviour, Paul Scherrer Institut, Villigen, Switzerland
2
CEA, DAM, DIF, 91297 Arpajon Cedex, France
Received: 15 September 2017 / Received in final form: 24 January 2018 / Accepted: 19 March 2018
Abstract. This paper presents a Bayesian approach based on integral experiments to create correlations
between different isotopes which do not appear with differential data. A simple Bayesian set of equations is
presented with random nuclear data, similarly to the usual methods applied with differential data. As a
consequence, updated nuclear data (cross sections, n,fission neutron spectra and covariance matrices) are
obtained, leading to better integral results. An example for
235
U and
238
U is proposed taking into account the
Bigten criticality benchmark.
1 Introduction
It was recently demonstrated that an uncertainty decrease
and non-zero correlation terms between different nuclear
data reactions can be obtained when using integral
information such as criticality benchmarks [1] (see Refs.
[2–4] for other examples). In reference [1], cross-correlation
terms between n(emitted neutrons per fission), x(fission
neutron spectra) and s
(n,f)
(fission cross section) were
calculated in the case of the 239PU isotope with specificPu
benchmarks in the fast neutron range. Such approach can be
useful to lower calculated uncertainties on integral quantities
based on nuclear data covariance matrices, without
artificially decreasing cross section uncertainties below
reasonable and unjustified values. This is appropriate when
the propagation of uncertainties from differential data to
large-scale systems indicates an apparent discrepancies
between uncertainties on measured integral data (neutron
multiplication factor, boron concentration, isotopic con-
tents) and the calculated ones. In this reference, the
correlation terms between reactions for a specific isotope
and the decrease of differential uncertainties were calculated
using a simple Bayesian Monte Carlo method. In the present
work, the same method is applied (1) to obtain correlation
terms this time between different isotopes, and (2) to
decrease the uncertainties for important reactions, using
again criticality-safety benchmarks. The approach and the
equations used in the present work are the same as in [1].
In the following, the case of the
235
U and
238
U isotopes
will be considered and the Bayesian update will be
performed using a specific criticality benchmark with high
sensitivity to these isotopes: the intermediate metal fast
number 7 benchmark, or imf7 (also known as Bigten) [5].
First the method will be recalled in simple terms, then the
application with the imf7 benchmark will be presented.
The updated benchmark value, cross sections, correlations
and uncertainties will be compared to the prior values, thus
demonstrating the results for the differential quantities.
This is of interest in the context of nuclear data
evaluations, where both nominal values and covariance
matrices can reflect the present results.
2 Correlation from integral benchmarks
The basic principles of the method were already presented
in [1]. We will outline here the major equations. The
Bayesian updates of the prior information is obtained using
a Monte Carlo process:
–random nuclear data are produced following specific
probability density functions (pdf). Such pdf were
obtained as follows: starting from uniform distributions,
comparisons between calculations and differential meas-
urements (from EXFOR) were performed. Following the
description of reference [6] (and as presented below for
integral data), weights are derived from such compar-
isons and pdf of TALYS model parameters are updated.
The next step is to sample from these specific parameter
pdf to produce random nuclear data;
–each random nuclear data is used in the benchmark
simulation;
*e-mail: dimitri-alexandre.rochman@psi.ch
EPJ Nuclear Sci. Technol. 4, 7 (2018)
©D.A. Rochman et al., published by EDP Sciences, 2018
https://doi.org/10.1051/epjn/2018006
Nuclear
Sciences
& Technologies
Available online at:
https://www.epj-n.org
This is an Open Access article distributed under the terms of the Creative Commons Attribution License (http://creativecommons.org/licenses/by/4.0),
which permits unrestricted use, distribution, and reproduction in any medium, provided the original work is properly cited.
–the random calculated quantities are compared to the
measured one, and;
–finally each random nuclear data is weighted according to
the agreement between the calculated and measured
quantities (see below for details on the definition of such
weights).
In the present work, the k
eff
value of the imf7
benchmark is used as the only integral quantity: the
reported value in [5]isk
exp
= 1.00450 with an experimental
uncertainty of Dk= 70 pcm. As a prior for the nuclear data,
the random
235
U and
238
U cross sections (and emitted
particles and spectra) are obtained from the TENDL-2014
library [7]. The T6 system [8] was used to generate so-called
random ENDF-6 and ACE files, containing all necessary
random nuclear data. This way, the same file production
and processing is followed, based on TALYS and NJOY
[8,9]. In the case of the imf7 benchmark, the k
eff
value is
very sensitive to the unresolved resonance range [10] and
the ENDF-6 files are processed with the PURR module of
NJOY. Each ENDF-6 and ACE files are similar in format,
but different in content. They are based on sampling of
model parameters of the different nuclear models according
to specific independent probability distributions (see the
TMC, BMC, UMC-B and BFMC methods [6], [11–13] for
details). Model parameters are sampled a large number of
times (with the index i=1…n) to generate full cross
sections and other nuclear data quantities for
235
U and
238
U
from 0 to 20 MeV (see for instance [14] for the testing of
such file distributions). The sampling between these two
isotopes is performed in independent manner, so that no
correlation between
235
U and
238
U can exist other than
from the model themselves. The prior correlation matrices
for
235
U and
238
U are simply obtained from the nrandom
files, using the conventional covariance and standard
deviation formula.
The nrandom ACE files are then used in nMCNP6
simulations [15], leading to nvalues of calculated k
eff,i
with
ivarying from 1 to n. The comparison between nrandom
calculated k
eff,i=1...n
and the experimental value k
exp
is
performed with the simplified chi-2 Q
i
values and
associated weights w
i
(here, chi-2 is called Q
i
to differenti-
ate it from the neutron spectra x):
Qi¼keff;ikexp
Dk
2
ð1Þ
wi¼exp Qi
2
:ð2Þ
Such formulation can easily be linked to the usual Bayesian
likelihood [13,16]. The weights are then assigned to the
corresponding
235
U and
238
U nuclear data files (for both
isotopes together) which lead to k
eff,i
. Considering n
random files for each isotopes, there is n
2
possible
combinations; in the following, we will consider only n
combinations such as (1,1), (2,2),…(i,i).
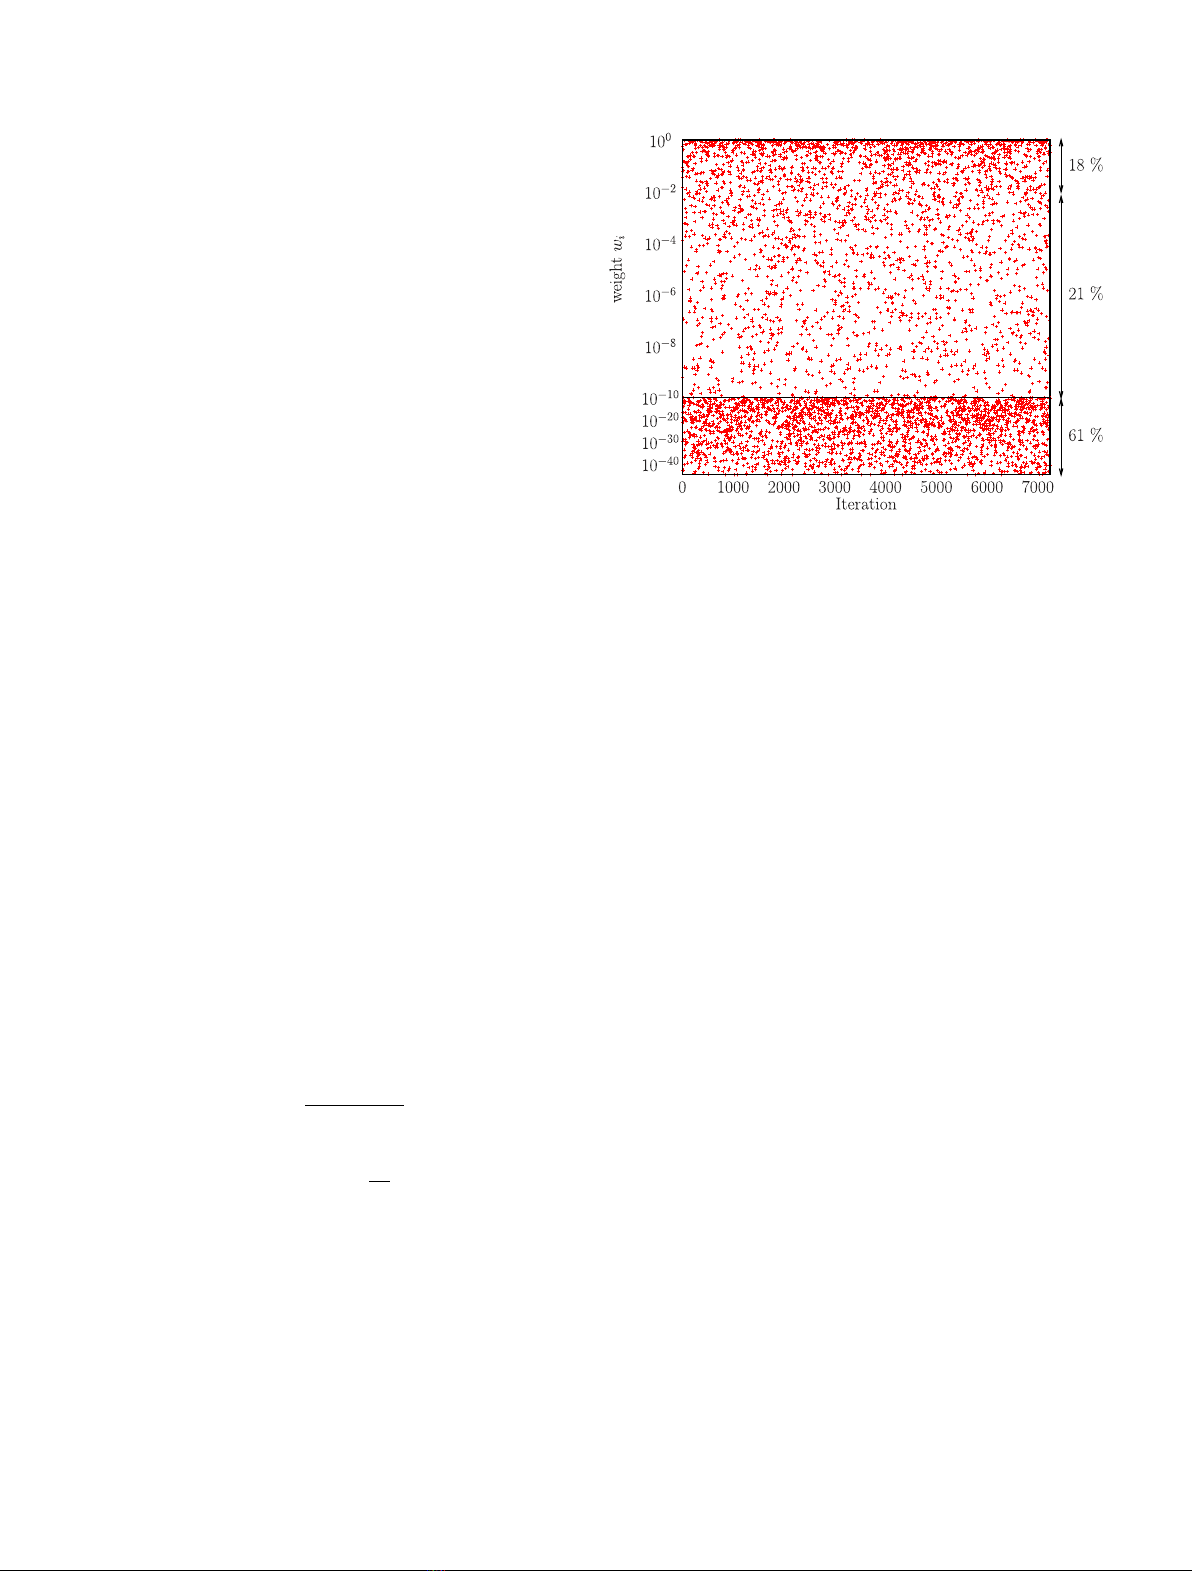
Examples for the weights of the random
235
U and
238
U
nuclear data are presented in Figure 1. In this example, one
iteration icorresponds to the use of one specific random file
for
235
U and another one for
238
U. As observed, the
distribution of the weights w
i
strongly varies from values
close to 1 (for Q
i
≈0, indicating a good performance of the
random files i) to very small values (almost 0 for large
discrepancies between k
exp
and k
eff,i
). Due to this large
range of weights, a large number of random files is
necessary to obtain meaningful results. In the case of 7000
random files for each U isotope, about 18% of the weights
are higher than 0.01.
The final quantity for a specific benchmark consists of a
matrix containing [i,s
i
(
235
U), s
i
(
238
U), w
i
] for i=1…n,
where s
i
stands for all nuclear data quantities as a function
of energy. As previously mentioned, the value of n= 7000 is
considered in this work. The correlation r(s
a
,s
b
) can be
calculated for specific values of the incident neutron
energies for s
a
(E
k
) and s
b
(E
p
). For instance, s
a
is the
fission cross section of
235
U and s
b
is the capture cross
section of
238
U, both at a specific energy E
k
and E
p
,
respectively. Considering the vector [i,s
i
(
235
U), s
i
(
238
U),
w
i
], rcan be calculated as follows. Using the definition of
weighted averages:
v¼X
n
i
wi
vsa¼X
n
i
wi⋅sa;i=v
8
>
>
>
<
>
>
>
:
and the definition of the weighted variance/covariance
factors:
varsaX
n
i
½saivsa
2⋅wi=v
varsbX
n
i
½sbivsb
2⋅wi=v
covsasbX
n
i
½saivsa⋅sbivsb⋅wi=v
8
>
>
>
>
>
>
>
>
<
>
>
>
>
>
>
>
>
:
Fig. 1. Calculated weights w
i
for the 7000 random cases
considered in this work. The number on the right are the percent
of weights within the space defined by the arrows.
2 D.A. Rochman et al.: EPJ Nuclear Sci. Technol. 4, 7 (2018)
the correlation r(s
a
,s
b
) between s
a
and s
b
is given by
rðsa;sbÞ¼ covsasb
ffiffiffiffiffiffiffiffiffiffiffiffiffiffiffiffiffiffiffiffiffiffiffiffi
a
avarsa⋅varsb
p:ð3Þ
Such correlation rcan be obtained for different E
K
and E
p
,
thus defining a full correlation matrix between the same
cross section and the same isotope, between different cross
sections for the same isotopes, and between isotopes. As
quantities in these equations (average cross sections,
standard deviations and correlation factors) come from a
Monte Carlo process, one has to check their convergence as
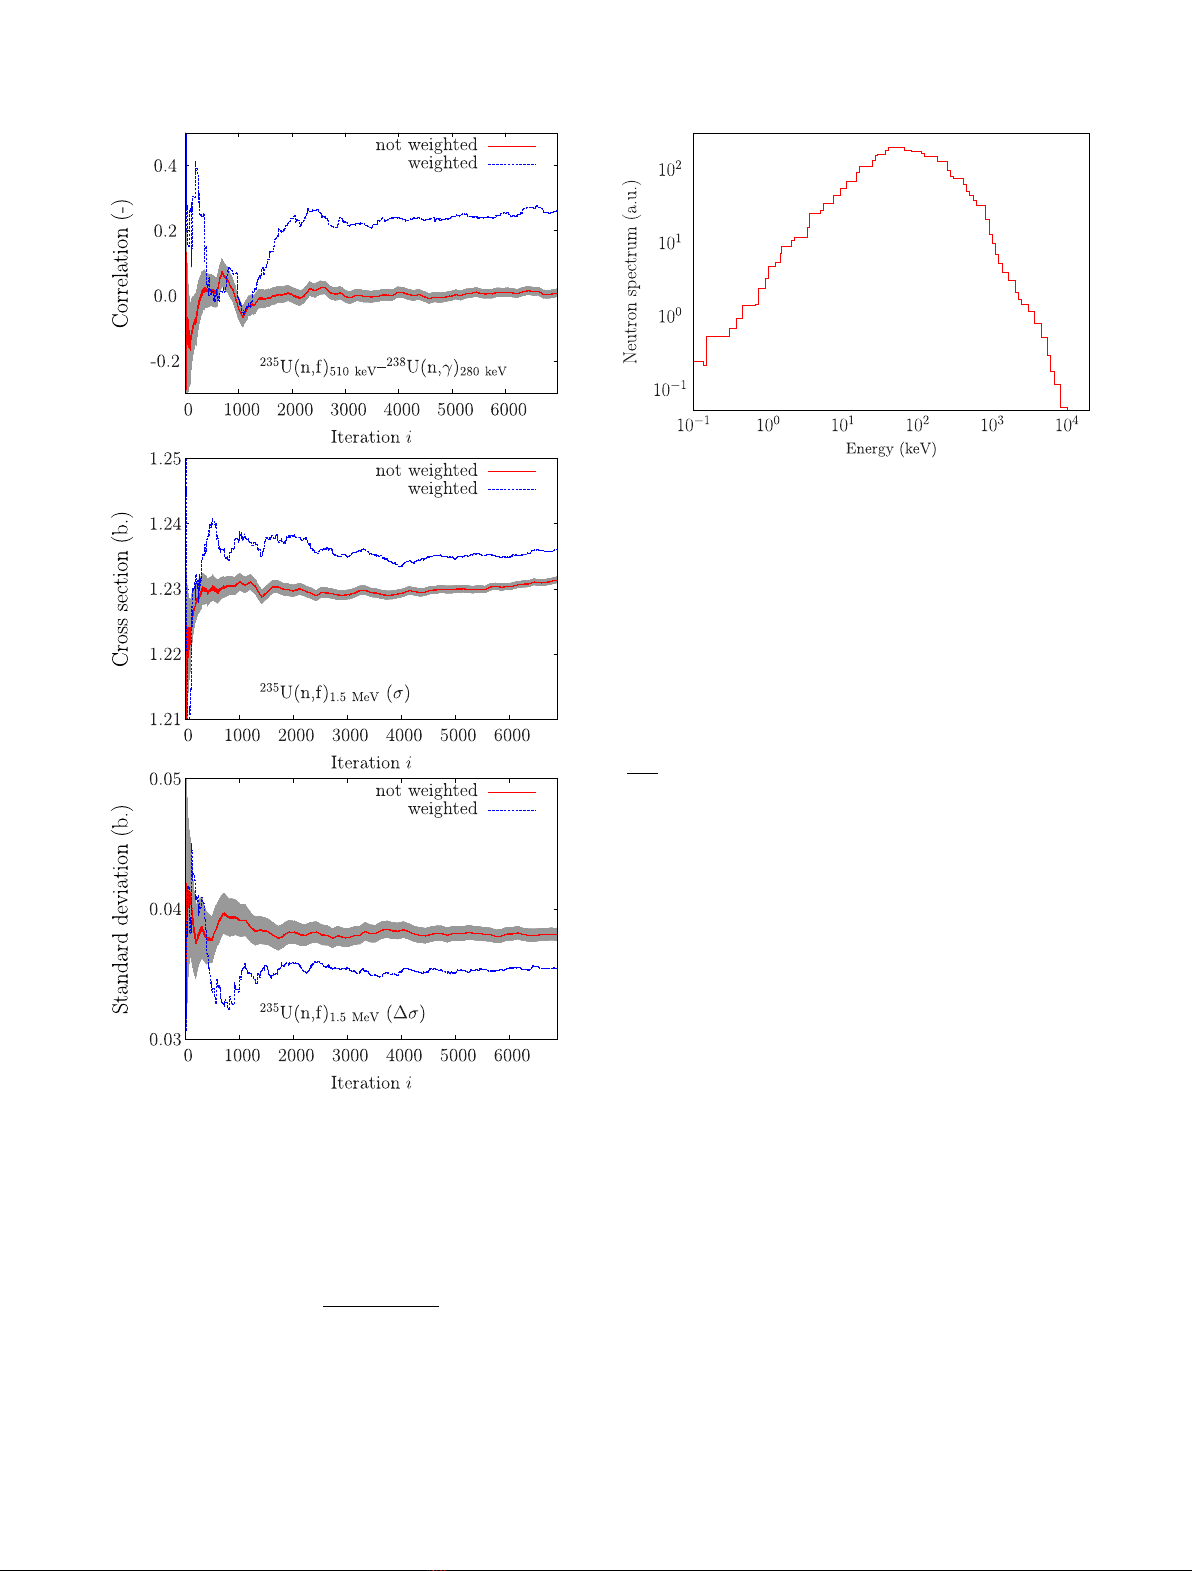
a function of the iteration number, as presented in Figure 2.
One can see that in both cases (considering or not
weights w
i
), the final correlation values are different, and
the difference is outside the standard errors (defined as
ffiffiffiffiffiffiffiffi
1r2
n2
qfor the non weighted case). As it can be seen on this
figure, the non weighted running correlation evolves
smoothly with the increasing number of samples, while
the weighted running correlation exhibits large jumps for
low iteration iwhere high weight samples are added to the
calculation (as seen in [16] showing same kind of behavior).
In the following, more details will be given on the imf7
benchmark together with the results regarding the prior
and posterior information for the uranium isotopes.
3 Application to
235
U and
238
U
The work presented in [1] was limited to the single
239
Pu
isotope, since it was applied to integral experiments from
the PMF subtype (Plutonium Metal Fast) of the ICSBEP
collection [5], for which only
239
Pu nuclear data dominate
the benchmark calculation result. Following the same
idea, the imf7 benchmark is selected as its k
eff
is highly
impacted by both
235
Uand
238
U.
3.1 The imf7 benchmark
The imf7 benchmark (intermediate enrichment uranium
metallic fast number 7), also known as Bigten, is a highly
enriched uranium core, surrounded by a massive natural
uranium reflector. It is characterized as a fast system, as
the majority of the neutron spectrum is above 100 keV.
Bigten is a cylindrical assembly with a core composed
entirely of fissionable material in metal form. There are
three distinct regions: a nearly homogeneous cylindrical
central core made of uranium enriched at 10% in
235
U,
Fig. 2. Example of the running correlation rbetween
235
U(n,f) at
510 keV and
238
U(n,g) at 280 keV (top), average cross section
(middle) and standard deviation (bottom). The weight comes
from the imf7 benchmark. The gray band is the standard error on
the correlation factors without weights.
Fig. 3. Neutron spectrum of the imf7 ICSBEP benchmark
calculated by MCNP6 using TENDL-2014 nuclear data. This
spectrum is averaged for the whole benchmark. In the
238
U
blanket, the average neutron energy is 345 keV, while in the
235
U
core, it is 580 keV.
D.A. Rochman et al.: EPJ Nuclear Sci. Technol. 4, 7 (2018) 3
surrounded by a heterogeneous core volume made of
natural uranium and highly enriched uranium (93%) and a
cylindrical reflector, made of depleted uranium, completely
surrounding the core. Figure 3 shows the neutron spectrum
averaged over imf7, calculated using MCNP6 with
TENDL-14 nuclear data, and average energies for fission
and capture are presented in Table 1. It has a typical fast
spectrum with an average neutron energy of 530 keV.
This imf7 configuration has long been known by
evaluators to be sensitive to nuclear data for both
235
U
and
238
U isotopes. This double dependency is so strong that
mixing nuclear data for
235
U from one source (e.g. ENDF/B-
VII.1 [17]) with data for
238
U from another source (e.g. JEFF-
3.3) in a imf7 benchmark calculation, results in a poor
restitution of the measured k
eff
value. Some examples are
presented in Table 2 by repeating the benchmark calculation
with different nuclear data evaluations for
235
Uand
238
U.
As observed, if both uranium isotopes come from the
same library, the calculated k
eff
is close to the experimen-
tal value. On the other hand, a mixture of the library of
origin leads to very different calculated k
eff.
These cases
can be interpreted as the effective presence of correlated
isotopes in current evaluated nuclear data libraries.
3.2 Correlations
By extending the methodology described in reference [1],
such cross-isotopes correlations can be rigorously quanti-
fied. All combinations of neutron incident energy,
observables (cross sections, prompt fission neutron spectra,
nubar, etc.), and target isotopes are possible, as illustrated
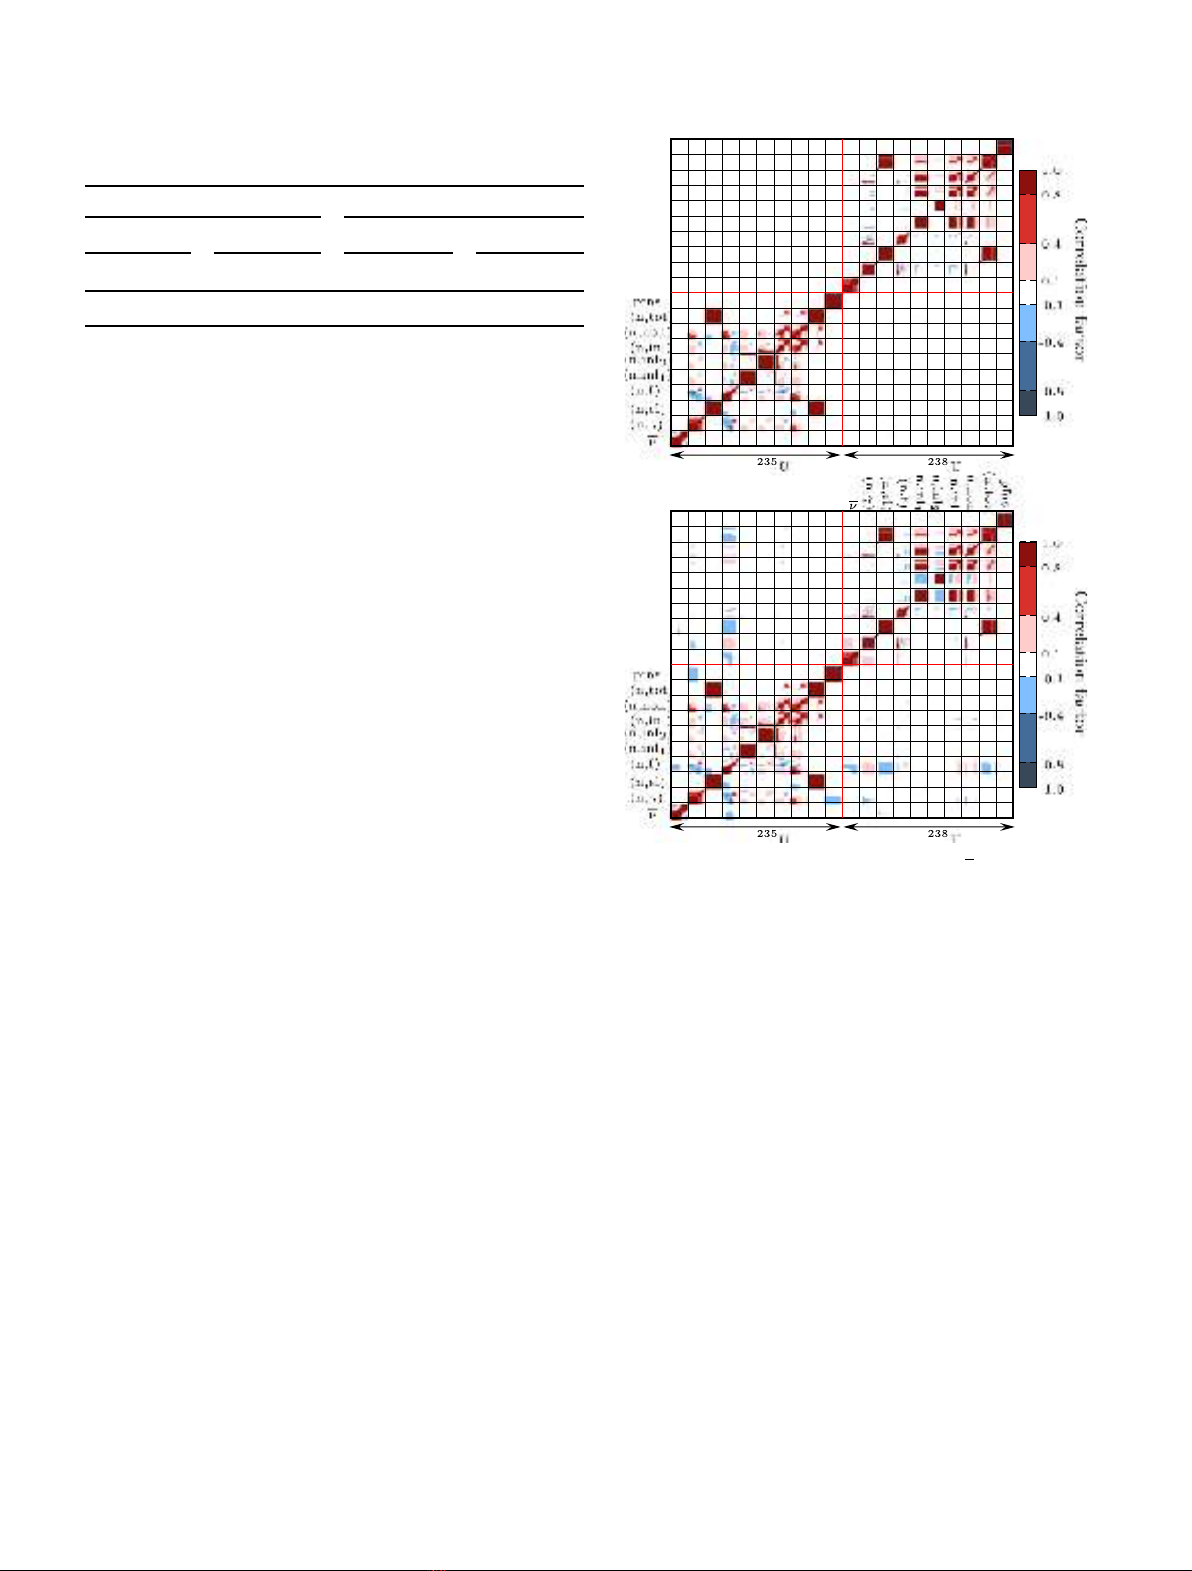
in Figure 4.
Correlation matrices for a selection of cross sections,
nubar and pfns in the case of
235
U and
238
U. Top:
correlation without taking into account the imf7 bench-
mark; bottom: same, but taking into account imf7. See text
for details. In each sub-block, the cross sections are
presented as a function of the incident neutron energy (the
lower-left part corresponds to the lower neutron energy
range, whereas the higher-right part corresponds to the
higher neutron energy).
The upper panel of Figure 4 shows the full
235
U-
238
U
correlation matrix for the prior (unweighted), Total
Monte-Carlo (TMC) [11] samples for
235
U and
238
U, as
computed from the TENDL-2014 library. Four blocks are
separated by two red lines, each block represents the
correlation and cross-correlation for these isotopes:
bottom-left:
235
U-
235
U, bottom-right:
235
U-
238
U, top-left:
238
U-
235
U and top-right:
238
U-
238
U. As it can be seen, cross-
isotopes correlations between isotopes are zero, since model
parameters for both isotopes were independently sampled
in this study.
The lower panel shows the full
235
U-
238
U correlation
matrix for the TMC samples of
235
Uand
238
U, weighted
according to equation (2), where k
exp
is the experimental
value of the imf7 benchmark, and k
eff,i
that derived from the
235
Uand
238
U sampled files, indexed by i. Obviously, that
lower panel exhibits cross-isotopes correlations contrary to
the upper one, and it also exhibits correlations between
different types of observables like those discussed in [1].
Although the TMC treatment allows the constructions
of covariance matrices between all the nuclear data
observables, the matrices shown in Figure 4 are restricted
to the observables which are expected to have a strong
influence of k
eff
; hence the (n,p), (n,2n), and other cross
sections are not shown in this figure. The color coding of the
amplitude of the correlation in Figure 4 reflects four levels
of correlations: zero or very low (white), low (lighter blue or
red), moderately strong (intermediate blue or red), and
very strong (darker blue or red), with red identifying
positive correlations, and blue negative ones. The corre-
lations between observables from different isotopes (in the
off-diagonal blocks) sit in the low range. The
235
Uor
238
U
Table 1. Average neutron energy in keV causing fission or
capture in the two main zones of the imf7 benchmark.
235
U
238
U
core Blanket core Blanket
(n,f) (n,g) (n,f) (n,g) (n,f) (n,g) (n,f) (n,g)
507 227 285 162 3070 281 3060 182
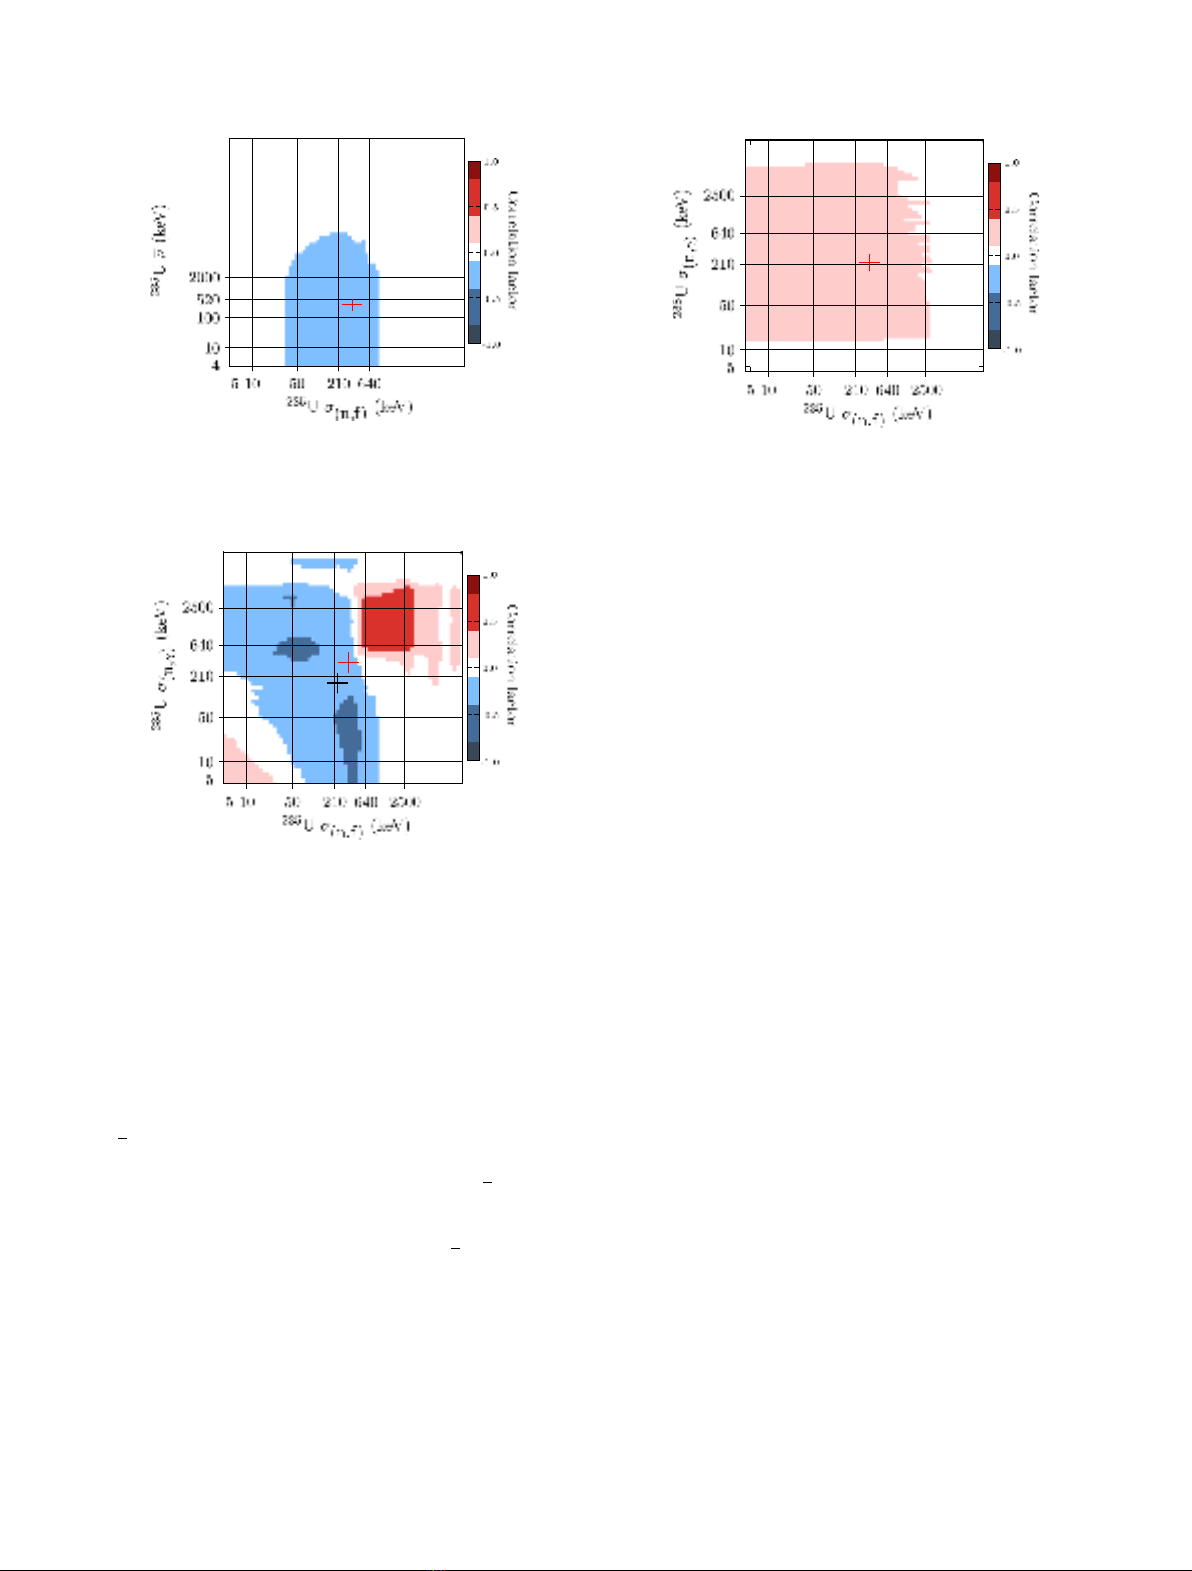
Fig. 4. Correlation sub-matrix between the nof
235
U and the
fission cross section of
235
U. The red cross indicates the average
energy of the neutron causing fission events (Tab. 1).
4 D.A. Rochman et al.: EPJ Nuclear Sci. Technol. 4, 7 (2018)
sub-matrices display some stronger correlations, mostly
along the diagonal, but also for observables derived from
the optical model potential (total, non elastic and elastic
cross sections), highlighting the role played by that model
in inducing correlations in nuclear data.
As expected, similarly to the conclusions of references
[1,16], a weak negative correlation for the posterior is
observed (see Fig. 5 for an enlarged sub-matrix) between
the nof
235
U and its fission cross section, for energies close
to the mean energy of neutrons causing fission in
235
U
(Tab. 1). This anti-correlation results from nand s
(n,f)
being two factors in the product describing the neutron
source term in the neutronic transport equation: a stronger
s
(n,f)
is exactly compensated by a weaker n.
The correlation matrix between the
235
U capture and
fission cross sections (Fig. 6) is harder to interpret, since it
exhibits a complex structure. Although the crosses materi-
alizing the mean energies leading to fission and capture
reactions inthe core and blanket regions of the assembly both
sit in the weak correlation region of the map (close to the
negligible correlations zone (white), there are regions of
stronger correlation, both positive and negative, nearby. The
moderate positive correlation for neutron energies seen
above 500 keV can be understood as
235
U(n,f) driving the
source term of the neutronic transport equation and
235
U
(n,g) being a contributor to the absorption term of that
equation. For lower neutron energies, two zones of moderate
negative correlation are observed, one for low (E <200keV)
neutron energy inducing fission, and one for low neutron
energy inducing capture. That complex structure of the
235
U capture and fission correlation might result from the
interplay between
235
U in the core region (fast spectrum) and
the blanket region (slower neutronic spectrum).
From Figure 4, one can also note two important aspects:
–anti-correlation for
235
U between xand (n,g): in order to
compensate for a higher neutron capture, the fission
spectrum becomes harder, thus producing more neutrons
at higher energy;
–especially in the case of
238
U, anti-correlation appears in
the updated matrices between the inelastic cross sections
themselves. Again, this can be understood in order to
compensate for the loss of neutrons caused from a specific
inelastic cross section (for instance (n,inl)) by another
one (for instance (n,inl
2
)).
In the off-diagonal cross-isotope correlation blocks, a
prevalent weak positive correlations can be observed
between
235
U(n,f) and
238
U(n,g) at energies where the
neutronic spectrum is strong (see Fig. 7 for an enlarged sub-
matrix). Again, that positive correlation is explained by
235
U(n,f) driving the source term and
238
U(n,g) being the
other strong contributor to the absorption term of the
neutronic transport equation.
A very prevalent weak anti-correlation can also be
observed between the fission cross section of
235
U and the
total elastic cross section of
238
U (presented in an enlarged
format in Fig. 8). They are anti-correlated since a weaker
fission cross section of
235
U can be compensated by a more
efficient neutron reflector (
238
U(n,el)), which reflects
leaking neutrons back into the
235
U core for another
attempt to fission
235
U.
3.3 Updated cross sections and variances
The weighting of TMC samples according to equations (1)
and (2) not only introduces correlations between observ-
ables, but it also leads to modifications of the central values
Fig. 5. As in Figure 4: correlation sub-matrix between the fission
and capture cross sections of
235
U. The red and black crosses
indicate the average energy of the neutron causing fission and
capture events in the core and blanket regions, respectively.
Fig. 6. As in Figure 4: correlation sub-matrix between the fission
cross section of
235
U and the capture cross section of
238
U. The
cross indicate the average energy of the neutron causing
235
U
fission and
238
U capture events.
Fig. 7. As in Figure 4: correlation sub-matrix between the fission
cross section of
235
U and the elastic cross section of
238
U.
D.A. Rochman et al.: EPJ Nuclear Sci. Technol. 4, 7 (2018) 5


![Ngân hàng trắc nghiệm Kỹ thuật lạnh ứng dụng: Đề cương [chuẩn nhất]](https://cdn.tailieu.vn/images/document/thumbnail/2025/20251007/kimphuong1001/135x160/25391759827353.jpg)