
* Corresponding author.
E-mail address: mm_marzouk@yahoo.com (M. Marzouk)
© 2019 by the authors; licensee Growing Science, Canada.
doi: 10.5267/j.dsl.2019.6.002
Decision Science Letters 8 (2019) 373–392
Contents lists available at GrowingScience
Decision Science Letters
homepage: www.GrowingScience.com/dsl
On the use of multi-criteria decision making methods for minimizing environmental emissions
in construction projects
Mohamed Marzouka* and Eslam Mohammed Abdelakderb
aProfessor of construction Engineering and Management, Structural Engineering Department, Faculty of Engineering, Cairo
University, Egypt
bPh.D. Candiate, Department of Building, Civil and Environmental Engineering, Concordia University, Montreal, QC, Canada
C H R O N I C L E A B S T R A C T
Article history:
Received June 1, 2019
Received in revised format:
June 2, 2019
Accepted June 30, 2019
Available online
June 30, 2019
There are huge amounts of emissions associated with construction industry during its different
stages from cradle till building demolition. This study presents a methodology that integrates
multi-objective optimization and multi-criteria decision making (MCDM) in order to enable
construction decision-makers to select the most sustainable construction alternatives. Four
objectives functions are investigated, which are: construction time, lifecycle cost, environmental
impact and primary energy in order to construct the Pareto front. A novel hybrid MCDM is
designed based on seven multi-criteria decision making techniques to select the best solution
among the set of the Pareto optimal solutions. Sensitivity analysis is performed in order to
determine the most sensitive attribute and construction stages that influence environmental
emissions. The analysis illustrates that WSM, COPRAS and TOPSIS provided the best rankings
of the alternatives, primary energy is the most sensitive attribute for different MCDM methods.
Moreover, PROMETHEE II is the most robust MCDM method.
.by the authors; licensee Growing Science, Canada 2018©
Keywords:
Environmental pollution
Construction industry
Multi-objective optimization
Multi-criteria decision making
Pareto front
Sensitivity analysis
1. Introduction
Climate change is a mandatory phenomenon. Environmental pollution contributes significantly to the
climate change. Greenhouse gases contribute significantly in the climate change, whereas these gases
have a great influence on global temperature. According to the US National Oceanic and Atmospheric
Administration, the year 2015 was recorded as the hottest year since records started in 1880. Moreover,
the 16 year-period from 1998 to 2015 is considered as the warmest period ever. The increase in the heat
waves occurred due to the climate change, causes heat stroke, viral fever, and dehydration (Olivier et
al., 2016; Pires et al., 2016).
Many countries have perceived the importance of reducing greenhouse gases which led to some
agreements and protocols, whereas the parties are required to minimize the greenhouse gas emissions
below a specific baseline. Kyoto protocol is an international agreement that was introduced in
December 1997 and it was linked to the United Nations Framework Convention on Climate Change to
define the reduction targets in greenhouse gases. During the first commitment, the industrialized
countries and the European community have agreed to reduce the greenhouse gas emissions by 8%
below 1990 levels in the five-year period from 2008 to 2012. During the second commitment, the

374
industrialized countries and the European community have agreed to reduce the greenhouse gas
emissions by 18% below 1990 levels in the eight-year period from 2013 to 2020 (Heidrich et al., 2016).
The United States offered to reduce the greenhouse gas emissions by 17% below 2005 levels by 2020
at the United Nations climate change conference in Copenhagen in 2009. Then, Under Paris agreement
in 2015, the United States targeted to reduce greenhouse gases by 26%-28% below 2005 levels by 2025
(Parker & Karlsson, 2018).
Building sector is possibly one of the most resource-intensive industries. Building sector is regarded as
one of the main contributors of the environmental emissions. The amount of greenhouse gases has
increased remarkably due to the rapid growth in urbanization and inefficiencies of the existing building
stock. Building sector consumes over than 30% of the global energy consumption and nearly 30% of
the global energy-related CO2 emissions (Dean et al., 2016).
Based on the afore-mentioned statistics, dealing with environmental emissions became undoubtedly
one of the greatest challenges in the recent century and minimizing environmental emissions produced
from the building sector is immense. The main objectives of the present study are as follows:
1- Build a hybrid optimization decision-making model to select the most sustainable materials.
2- Study the robustness and sensitivity of the different multi-criteria decision making
Several efforts were done in the field of evaluation of environmental emissions and estimation. Huang
et al. (2017) introduced a calculation methodology for the carbon footprint of urban buildings in
Xiamen city in China. They concluded that the energy use phase and material production phase are
responsible for 45% and 40% of the carbon footprint, respectively. They highlighted that the
implementation of low-carbon strategies can result in the reduction of energy consumption of urban
buildings by 2.98% in 2020. Barati and Shen (2017) presented a methodology to minimize the operation
emissions for on-road construction equipment. They stated that the emissions of the construction
equipment increase significantly by increasing the payload of the equipment and the road slope. Seo et
al. (2016) analyzed the CO2 emissions produced from the material production phase, transportation
phase, and construction phase. They highlighted that the manufacturing phase is the largest contributor
of CO2 emissions with 93.4% followed by construction phase, and finally the transportation phase.
Abdallah et al. (2015) designed an optimization model that is capable of selecting the optimum building
upgrade measures by minimizing the energy consumption while taking into consideration the budget
constraints. The optimization model incorporates the analysis of the following systems, which are:
interior and exterior lighting systems, HVAC (heating, ventilation and air conditioning) systems, water
heaters, hand dryers, and renewable energy systems. Cho and Chae (2016) analyzed the emissions
produced from low-carbon buildings and compared it with the emissions produced from the reference
buildings. They highlighted that the low-carbon buildings can result in a 25% reduction in the carbon
emissions. They illustrated that operation and maintenance phase represents the highest weight of CO2
emissions followed by manufacturing phase while construction phase represents the least contributor
to CO2 emissions.
Motuzienệ et al. (2016) compared between the environmental impacts of three types of envelopes which
are: masonry, log, and timber frame buildings. Several attributes were considered such as life cycle
cost, primary energy consumption, global warming, and ozone layer depletion. The weights of
attributes were obtained using Analytical Hierarchy Process. Based on the previous literature review,
most research contributions had the following limitations which are: 1) some researches did not take
into account all the different phases of construction project in the calculation of emissions and energy
consumption, and 2) some researches did not consider air pollutants which constitute in the total
equivalent amount of carbon dioxide such as carbon dioxide, methane, nitrous oxide, and fluorinated
gases. Most researches focused on carbon dioxide emissions only, and 3) most researches did not
consider other types of environmental emissions such as particular matter, sulfur dioxide, etc.
M. Marzouk and E. M. Abdelakder / Decision Science Letters 8 (2019)
375
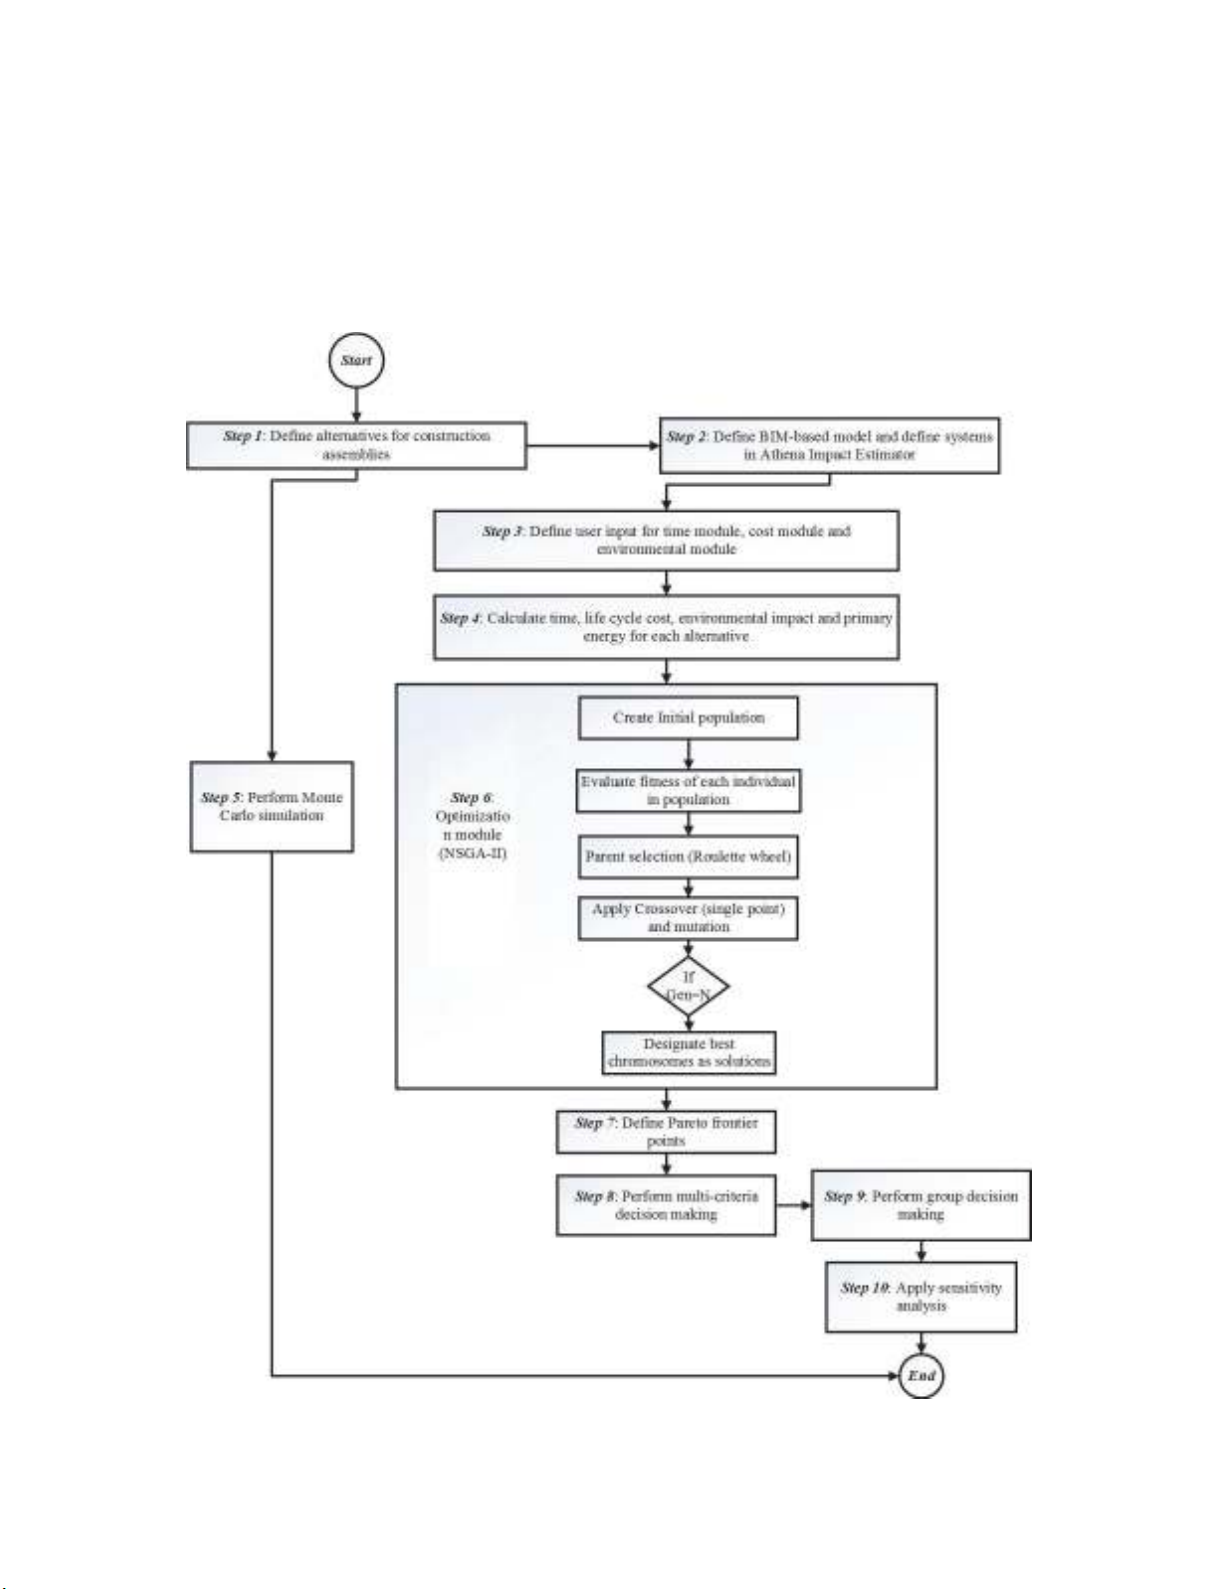
2. Research methodology
A methodology is proposed in order to select the best scenario to construct the project. The proposed
model considers different project components such as plain concrete, reinforced concrete, beams, slabs,
walls, etc. Each project component is divided into a group of alternatives. The proposed model accounts
for different project phases which are: manufacturing phase, transportation on-site and off-site phases,
construction phase, maintenance phase, recycling/reuse phase, and deconstruction/demolition. The
steps of the proposed model are depicted in Fig. 1. The set of all possible alternatives for different
project components are depicted in Table 1.
Fig. 1. Framework of the proposed methodology
376
Table 1
Available alternatives of the case study
Project Assemblies Alternative No. Alternative Description
Excavation 1 5 crews
2 6 crews
3 7 crews
4 8 crews
5 9 crews
6 10 crews
Plain concrete 1 4 crews of carpentering+1 crew of pouring concrete - concrete type 1 (average fly ash)
2 5 crews of carpentering+2 crews of pouring concrete -concrete type 1(average fly ash)
3 4 crews of carpentering+1 crew of pouring concrete - concrete type 2 (25% fly ash)
4 5 crews of carpentering+2 crews of pouring concrete -concrete type 2(25% fly ash)
5 4 crews of carpentering+1 crew of pouring concrete - concrete type 3 (35% fly ash)
6 5 crews of carpentering+2 crews of pouring concrete -concrete type 3(35% fly ash)
Reinforced concrete
1
4 crews of carpentering+15 crews of fixing reinforcement+ 1 crew of pouring concrete -
concrete type 1 (average fly ash)
2 5 crews of carpentering+17 crews of fixing reinforcement+ 2 crews of pouring concrete -
concrete type 1 (average fly ash)
3 4 crews of carpentering+16 crews of fixing reinforcement+ 1 crew of pouring concrete -
concrete type 2 (25% fly ash)
4 5 crews of carpentering+17 crews of fixing reinforcement+ 2 crews of pouring concrete -
concrete type 2 (25% fly ash)
5 4 crews of carpentering+16 crews of fixing reinforcement+ 1 crew of pouring concrete -
concrete type 3 (35% fly ash)
6 5 crews of carpentering+17 crews of fixing reinforcement+ 2 crews of pouring concrete -
concrete type 3 (35% fly ash)
Backfilling 1 10 crews
2 11 crews
3 12 crews
4 13 crews
Foundations' insulation
1 Blown cellulose
2 Mineral wool batt R50
3 Polyiscoyanurate foam
4 Fiberglass batt R50
5 Polystyrene extruded
Slabs 1 Cast in situ Concrete 30 MPa with average fly ash
2 Cast in situ Concrete 30 MPa with 25% fly ash
3 Cast in situ Concrete 30 MPa with 35% fly ash
4 Wood based system
5 Steel based system
6 Glulam based system
7 Precast concrete
Columns 1 Softwood lumber
2 Glulam
3 Laminated veneer lumber
4 Hollow structural steel
5 Precast concrete
6 Cast in situ concrete
Beams 1 Glulam
2 Laminated veneer lumber
3 Wide flange
4 Precast concrete
5 Cast in situ concrete
Walls 1 Cast in situ Concrete 30 MPa with average fly ash
2 Cast in situ Concrete 30 MPa with 25% fly ash
3 Cast in situ Concrete 30 MPa with 35% fly ash
4 Wood based system
5 Steel based system
6 Insulated concrete form (average fly ash)
7 Insulated concrete form (25% fly ash)
8 Insulated concrete form (35% fly ash)
9 Structural insulated panels
10 Precast concrete (average fly ash)
11 Precast concrete (25% fly ash)
12 Precast concrete (35% fly ash)
13 Curtain wall (metal spandrel panels)
14 Curtain wall (glass spandrel panels)
15 Concrete bricks
Thermal insulation 1 Polyethylene 3 mil thickness
2 Polyethylene 6 mil thickness
3 Polypropylene scrim Kraft
M. Marzouk and E. M. Abdelakder / Decision Science Letters 8 (2019)
377
Table 2
Available alternatives of the case study (Continued)
Project Assemblies Alternative No. Alternative Description
Painting 1 Alkyd solvent based paint
2 Vamish solvent based paint
3 Latex water based paint
Cladding 1 cedar cladding
2 Concrete bricks cladding
3 Vinyl cladding
4 Fiber cement cladding
5 Insulated metal panels cladding
6 Metal cladding
7 Modular bricks cladding
8 Natural stone cladding
9 Ontario bricks cladding
10 Precast panels cladding
11 Precast insulated panels with brick veneer cladding
12 Precast insulated panels
13 Spruce cladding
14 Stucco cladding
15 Pine cladding
Ceiling finishing 1 Gypsum fiber BD 1/2"
2 Gypsum fiber BD 5/8"
3 Gypsum fire rated type 1/2"
4 Gypsum fire rated type 5/8"
5 Gypsum regular type 1/2"
6 Gypsum regular type 5/8"
7 Gypsum moisture resistant type 1/2"
8 Gypsum moisture resistant type 5/8"
Roofing system 1 Black EPDM membrane 60 mil thickness.
2 White EPDM membrane 60 mil thickness
3 Clay tiles
4 Concrete tiles
5 PVC membrane 48 mil thickness
6 Standard modified bitumen membrane
7 Ballast (aggregate stones) membrane
8 Extreme white TPO membrane 60 mil
9 Extreme white TPO membrane 70 mil
10 Extreme white TPO membrane 80 mil
11 white TPO membrane 60 mil
12 white TPO membrane 80 mil
The model inputs are divided into two main clusters which are: model external inputs and model user
inputs. The second step is to develop a BIM-based model using Autodesk Revit (Autodesk Revit 2015)
and to define systems in Athena Impact Estimator (Athena Impact Estimator 5.0.0105). The BIM model
constitutes a database. Revit DB link is a plug-in that enables all data concerning 3D model to be sent
to Microsoft Access. A SQL statement is written inside the developed model to retrieve the data of the
building information model from Microsoft Access to the proposed application. Athena Impact
Estimator calculates different environmental emissions which are; greenhouse gases footprint,
acidification potential, human health (HH) particulate, eutrophication potential, ozone depletion and
smog for different project life cycle phases. Different properties of building systems should be defined
in Athena Impact Estimator including; material type, geometry of building systems and size of
reinforcement.
The proposed application calculates time, life cycle cost, environmental impact and primary energy of
each scenario independently. The third step is to define the needed user inputs for each module in the
proposed application. The proposed application is divided into three modules which are time module,
cost module and environmental module. The windows application is developed using C#.net
programming language. The user is asked to determine certain inputs in each module. The user is asked
to enter number of crews, productivity of each crew and nature of crews (single-based crews or range-
based crews) for each scenario for the time module. Interface of user input for the time module is
depicted in Figure 2. "Check values" button is used to make sure that all the needed data are entered.
For the cost module, the user is asked to enter some information to calculate total life cycle cost as
Minimum attractive rate of return (MARR), maintenance cost per year (if exist), maintenance cost per
a specific period of time (if exist) and to determine this period of time (e.g. 2 years, 5 years, 10 years,


![Câu hỏi ôn tập Môi trường và phát triển [năm]](https://cdn.tailieu.vn/images/document/thumbnail/2025/20250710/kimphuong1001/135x160/2361752136158.jpg)
![Câu hỏi ôn tập Con người và môi trường: Tổng hợp [mới nhất/chuẩn nhất]](https://cdn.tailieu.vn/images/document/thumbnail/2025/20250704/kimphuong1001/135x160/8741751592841.jpg)
![Câu hỏi ôn tập môn Môi trường [chuẩn nhất]](https://cdn.tailieu.vn/images/document/thumbnail/2025/20250702/kimphuong555/135x160/62401751441591.jpg)
![Tài liệu tập huấn quản lý và bảo tồn đất ngập nước [mới nhất]](https://cdn.tailieu.vn/images/document/thumbnail/2025/20250627/vijiraiya/135x160/30351751010876.jpg)


![Đề thi Con người và môi trường cuối kì 2 năm 2019-2020 có đáp án [kèm file tải]](https://cdn.tailieu.vn/images/document/thumbnail/2025/20250523/oursky06/135x160/4691768897904.jpg)


![Đề cương ôn tập Giáo dục môi trường cho học sinh tiểu học [mới nhất]](https://cdn.tailieu.vn/images/document/thumbnail/2025/20251212/tambang1205/135x160/621768815662.jpg)


