
Protein stabilization by compatible solutes
Effect of diglycerol phosphate on the dynamics of
Desulfovibrio gigas
rubredoxin
studied by NMR
Pedro Lamosa
1
, David L. Turner
1,2
, Rita Ventura
1
, Christopher Maycock
1
and Helena Santos
1
1
Instituto de Tecnologia Quı´mica e Biolo
´gica, Universidade Nova de Lisboa, Oeiras, Portugal;
2
Department of Chemistry,
University of Southampton, UK
Heteronuclear NMR relaxation measurements and hydro-
gen exchange data have been used to characterize protein
dynamics in the presence or absence of stabilizing solutes
from hyperthermophiles. Rubredoxin from Desulfovibrio
gigas was selected as a model protein and the effect of
diglycerol phosphate on its dynamic behaviour was studied.
The presence of 100 m
M
diglycerol phosphate induces a
fourfold increase in the half-life for thermal denaturation
of D. gigas rubredoxin [Lamosa, P., Burke, A., Peist, R.,
Huber, R., Liu, M.Y., Silva, G., Rodrigues-Pousada, C.,
LeGall, J., Maycock, C. & Santos, H. (2000) Appl. Environ.
Microbiol. 66, 1974–1979]. A model-free analysis of the
protein backbone relaxation parameters shows an average
increase of generalized order parameters of 0.015 reflecting
a small overall reduction in mobility of fast-scale motions.
Hydrogen exchange data acquired over a temperature span
of 20 C yielded thermodynamic parameters for the struc-
tural opening reactions that allow for the exchange. This
shows that the closed form of the protein is stabilized by an
additional 1.6 kJÆmol
)1
in the presence of the solute. The
results seem to indicate that the stabilizing effect is due
mainly to a reduction in mobility of the slower, larger-scale
motions within the protein structure with an associated
increase in the enthalpy of interactions.
Keywords: chemical exchange; compatible solutes; protein
dynamics; rubredoxin; thermostability.
Protein stability, activity and dynamics are interrelated
issues with great importance not only in physiological
processes but also in protein engineering. The evolution of
protein structures towards extreme thermostability was vital
for hyperthermophiles, microorganisms thriving near the
boiling point of water. In general, the proteins of these
organisms are intrinsically resistant to heat denaturation.
However, hyperthermophiles also possess intracellular pro-
teins that are not particularly stable, implying the existence
of alternative strategies for their stabilization in vivo [1,2].
Hyperthermophiles accumulate high levels of charged
organic osmolytes in response to supra-optimal growth
temperatures, and this observation led to the hypothesis that
these compounds play a role in thermoprotection of
macromolecules in vivo [3,4]. This view is supported by
in vitro studies showing that these osmolytes protect proteins
against heat [1,5–8]. Nevertheless, the molecular basis for
this well established stabilization phenomenon remains
elusive.
Several possible mechanisms for protein stabilization
by osmolytes have been proposed [9–11]. Arakawa and
Timasheff [12,13] proposed a preferential hydration model
to explain protein stabilization by compatible solutes: solute
molecules are excluded from the protein surface, thereby
making denaturation entropically less favourable. In con-
formity, exclusion factors have been measured for a variety
of organic solutes and salts [14–16], however, the correlation
between exclusion factors and the degree of protection a
solute can bestow upon a particular protein is neither
unequivocal nor general [17,18]. These apparent inconsis-
tencies have sometimes been interpreted as being due to
specific protein–solute interactions [7,19]. In fact, the
magnitude of the stabilizing effect depends on the particular
solute–protein pair examined [5,8,19].
Another approach, proposed by Bolen and coworkers,
describes the stabilizing or destabilizing nature of inter-
actions between solutes and exposed groups in the protein
structure [20,21]. In this proposal, the stabilizing effect is
attributed mainly to a large contribution from interactions
with exposed backbone groups in a partially unfolded state,
with side-chain interactions modulating the specificity of the
effect. Overall, the interactions should cause a contraction
of the protein structure with a concomitant decrease in
internal mobility [21,22]. Indeed, the higher thermal stability
of hyperthermophilic proteins has often been correlated
with structure rigidification [23,24]. Structural data, both
from X-ray and NMR, on series of homologous proteins
show evidence for stronger local interactions and/or
improved packing of the polypeptide chain, which would
bring about a higher conformational rigidity [23]. More-
over, the lower catalytic efficiency observed in hyperther-
mophilic enzymes is usually explained by the decreased
Correspondence to H. Santos, Instituto de Tecnologia Quı
´mica e
Biolo
´gica, Apartado 127, 2780-156 Oeiras, Portugal.
Fax: + 351 21 4428766, Tel.: + 351 21 4469828,
E-mail: santos@itqb.unl.pt
Abbreviations: DGP, diglycerol phosphate; RdDg, Rubredoxin from
Desulfovibrio gigas.
(Received 4 July 2003, revised 22 September 2003,
accepted 2 October 2003)
Eur. J. Biochem. 270, 4606–4614 (2003) FEBS 2003 doi:10.1046/j.1432-1033.2003.03861.x

flexibility of the active site, corroborated by the fact that
mutations increasing thermostability while maintaining
low-temperature activity are extremely rare [25]. In fact,
this rigidification has been revealed by H–D exchange
experiments [23,26]. However, this view was recently
challenged by the observation of relatively fast exchange
rates in the rubredoxin from Pyrococcus furiosus,themost
stable protein known to date [27]. In this context, assessing
the changes in the dynamic behaviour of proteins in the
presence of solutes is expected to shed light on the
stabilization phenomenon.
Desulfovibrio gigas rubredoxin (RdDg), a small iron–
sulfur protein with a hydrophobic core formed by the side
chains of six invariant residues, a three-stranded b-sheet,
and an exposed hairpin loop, was chosen as a model
protein. Its NMR solution structure was recently obtained
[28]. Also, RdDg is highly stabilized by diglycerol phosphate
(DGP), a solute accumulated by the hyperthermophilic
archaeon Archaeoglobus fulgidus [7,29]. Addition of 100 m
M
DGP yields a fourfold increase in the half-life for thermal
denaturation of RdDg, measured by UV–visible spectros-
copy at 90 C[7].
We used NMR for these studies because it provides a
wide range of time-scales for the dynamic analyses.
Heteronuclear NMR relaxation data, from which general-
ized order parameters can be derived, provides a tool to
probe the dynamic behaviour of proteins in various
conditions [30–32]. Hydrogen exchange rates of labile
protons, such as the amide protons of protein backbones,
can also provide dynamic information on longer time-
scales. Amide protons that are buried inside the protein
structure and/or involved in hydrogen bonds require a local
structural opening to allow exchange with solvent protons
[33,34]. Therefore, the measurement of amide exchange
rates can be used to evaluate the relationship between
stability and the rigidity of several parts of the protein
structure [35,36].
Materials and methods
Rubredoxin production
Plasmid pRPPL1 [7] harbouring the RdDg gene was
digested with NdeIandEcoRI restriction enzymes. The
175-bp DNA fragment obtained was purified from an
agarose gel (2%) and inserted into vector pT7-7 [37]
previously digested with the same restriction enzymes. The
resulting construct was named pMSPL1. Escherichia coli
strain BL21(DE) was transformed with pMSPL1 and
grown in medium containing: KH
2
PO
4
,4.5gÆL
)1
;
K
2
HPO
4
,10.5gÆL
)1
;NaCl,0.5gÆL
)1
;Mg
2
SO
4
Æ7H
2
O, 0.5
gÆL
)1
;FeCl
3
Æ3H
2
O6mgÆL
)1
;U
15
N-(NH
4
)
2
SO
4
,2gÆL
)1
;
glucose, 4 gÆL
)1
; vitamin solution, 10 mLÆL
)1
; trace element
solution 10 mLÆL
)1
and ampicillin 100 mgÆL
)1
. One litre of
vitamin solution contained 500 mg aminobenzoic acid,
200 mg nicotinic acid, 100 mg pantothenic acid, 500 mg
pyridoxine, 100 mg thiamine, 200 mg thioctic acid, 200 mg
biotin, 100 mg folic acid and 100 mg riboflavin. The
trace element solution contains per litre: CaCl
2
,1.06g;
MnSO
4
Æ5H
2
O, 50 mg; CuSO
4
Æ5H
2
O, 8 mg; ZnSO
4
Æ7H
2
O
40 mg; NaMoO
4
Æ2H
2
O, 8 mg; CoCl
2
Æ6H
2
O, 8 mg; H
3
BO
3
,
6mg.
Transformed E. coli cells were grown until D¼0.3 and
RdDg production induced with isopropyl thio-b-
D
-galacto-
side (IPTG; 25 lgÆL
)1
final concentration). At this time the
culture was supplemented with glycerol (4 mLÆL
)1
)and
ZnCl
2
(5 mgÆL
)1
final concentration) and incubated for 8 h.
Purification of the recombinant protein was performed as
described previously [7].
A yield of approximately 10 mgÆL
)1
of the zinc form of
RdDg uniformly labelled with
15
Nwasobtained.
Sample preparation
Purified uniformly
15
N-labelled RdDg (Zn form) was
concentrated and the buffer removed by ultrafiltration
using a YM3 membrane (Amicon). Two samples were
prepared in 10%
2
H
2
O at a final concentration of 4m
M
.
In one sample, DGP (potassium salt) was added to a final
concentration of 100 m
M
, while in the other sample KCl
was added to the same concentration. The pH was adjusted
to 6.9 in both samples and an antibiotic cocktail was added
with 70 l
M
ampicillin, 50 l
M
kanamicin, 50 l
M
rifampicin
and 50 l
M
chloroamphenicol.
For the
1
H–
2
H exchange experiments RdDg (Zn form)
was used at a final concentration of 1m
M
. KCl or DGP
was added to the protein in 2-mL Eppendorf tubes to a final
concentration of 100 m
M
, the pH was adjusted to 6 in the
unlabelledsamplesandto5inthe
15
N-labelled RdDg, and
the samples were freeze-dried. The dried samples were then
dissolved in
2
H
2
O, the pH readjusted (if necessary), and
placed in the spectrometer at the desired temperature. After
allowing a period for temperature equilibration, series of 1D
1
H(or2D
1
H-
15
N HSQC for the labelled samples) spectra
were acquired.
NMR spectroscopy
Unless otherwise stated all spectra were recorded at 303 K
in a DRX500 Bruker spectrometer equipped with a 5-mm
inverse detection probe head with internal B
0
gradient coils.
(Bruker, Rheinstetten, Germany). Temperature was con-
trolled using a Eurotherm 818 unit with a B-CU 05 cooling
unit. One-dimensional
1
H spectra for the exchange experi-
ments were acquired with 72 transients, and continuous
low-power water saturation during the relaxation delay of
2.0 s. A series of
1
H–
15
N correlation spectra was acquired
to measure the
15
N relaxation constants R
1
and R
2
,and
heteronuclear
1
H–
15
N NOE using the procedures outlined
in Kay et al. [38], modified to include a Watergate 3-9-19
water suppression scheme [39]. Values of R
1
and R
2
were
obtained by fitting the intensities (measured as peak-
volumes) over time to a single exponential decay. NOE
enhancements were taken from the mean value of three
integrations of peak volumes in spectra recorded with and
without proton saturation. The 2D
15
N–
1
H HSQC spectra
were recorded with standard Bruker pulse programs. In
these experiments 4096
1
H·512
15
N data points were
collected using a delay of 2.7 ms for evolution of magneti-
zation in the INEPT transfer sequence. The 3D
15
N–
1
H
HSQC-TOCSY spectrum (4096
1
H·32
15
N·64
1
Hdata
points) was recorded using a delay of 2.7 ms evolution of
magnetization in the INEPT transfer sequence and a
TOCSY mixing time of 80 ms. The data were processed
FEBS 2003 Effect of DGP on rubredoxin dynamics (Eur. J. Biochem. 270) 4607
with standard
BRUKER
software (Bruker). Polynomial
baseline corrections were applied in both dimensions of all
2D spectra.
Results
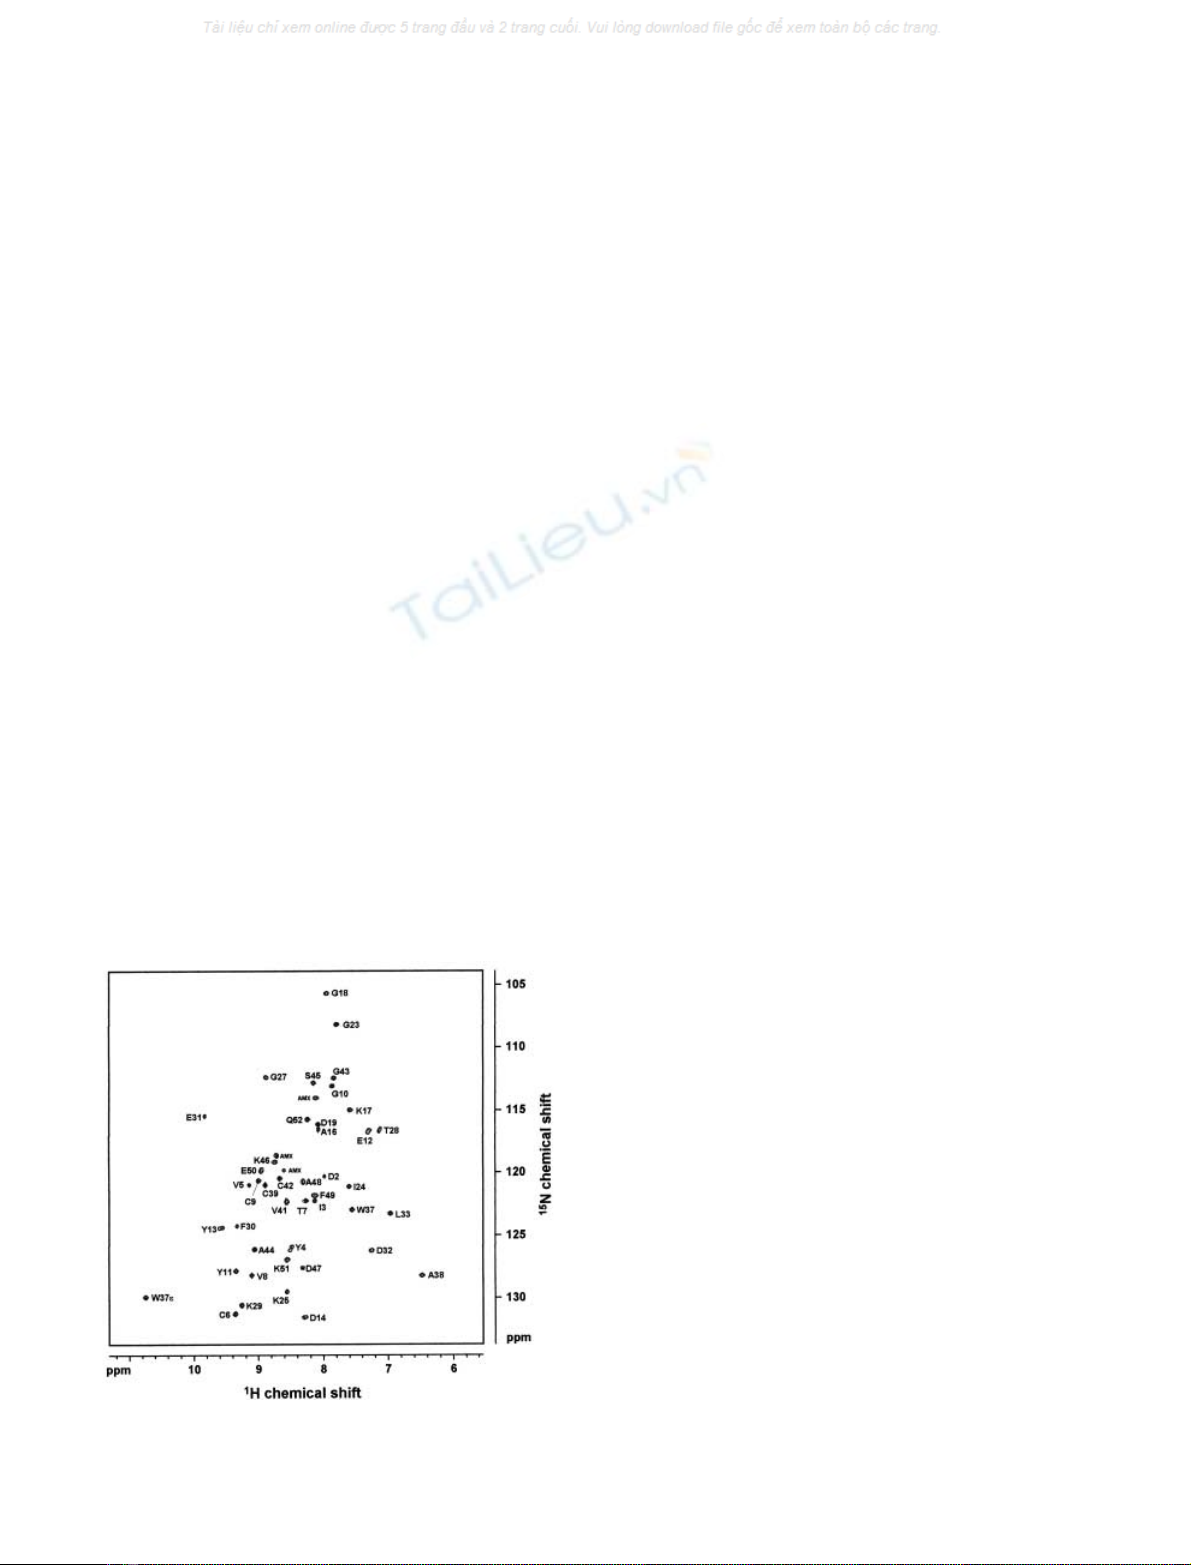
1
H and
15
N chemical shifts
The 2D
1
H-
15
N-HSQC spectrum of RdDg was assigned
with the aid of a 3D
1
H–
15
N TOCSY-HSQC spectrum and
published proton chemical shift data [28] (Fig. 1). Ambigu-
ities in signal assignment due to overlap in the
1
Hdimension
were solved through spin-system analysis of the 3D
TOCSY-HSQC spectrum, but three signals with AMX
type spin-systems could not be assigned unequivocally.
The temperature dependence of the
1
Hand
15
Nchemical
shifts was investigated in the presence of 100 m
M
KCl or
DGP by acquiring a series of
1
H–
15
N HSQC spectra over a
temperature span of 50 C (from 30 to 80 C). At 30 C, the
addition of DGP had little or no influence on the proton
NH chemical shifts of RdDg. In fact, chemical shift
displacement upon solute addition seems random, with
most shift changes within experimental error, an average
value of 0.004 p.p.m., and a maximum value of 0.087 p.p.m.
(Phe30). The displacement of
15
N chemical shifts follows a
similar pattern, with an average value of 0.031 p.p.m and a
maximum value of 0.607 p.p.m. (Ala48). These results agree
with previous findings [28], in which DGP addition caused
no visible change in the proton spectrum.
The chemical shifts of amide protons in RdDg present a
small, linear dependence on temperature (up to 80 C), both
in the presence of 100 m
M
KCl and DGP. The variation of
chemical shift with temperature seems random with average
slope of )0.0029 ± 0.0028 p.p.m.ÆK
)1
throughout the
protein, with the error given as the standard deviation of
the slopes. The segment 25–32 in the protein sequence shows
the largest temperature dependences with an average of
)0.0066 ± 0.0045 p.p.m.ÆK
)1
. The addition of DGP does
not significantly change this pattern. In fact, the difference
in chemical shift temperature dependence with or without
DGP is random and within the experimental error. Amide
15
N chemical shifts display both positive and negative
correlations with temperature, which seem unrelated to
protein sequence or residue type and present a relatively
small range of values (from 0.018 p.p.m.ÆK
)1
in Val5 to
)0.047 p.p.m.ÆK
)1
in Phe49). In some residues, such as Ile3,
Tyr11, Gly23, Lys25, Phe30 or Ser45, the chemical shifts
are temperature independent. Many of the plots of
15
N
chemical shift against temperature are nonlinear. This also
seems unrelated to protein structure or residue nature.
Upon solute addition, all signals still exhibit little tempera-
ture dependence and tend to maintain their positive or
negative correlations.
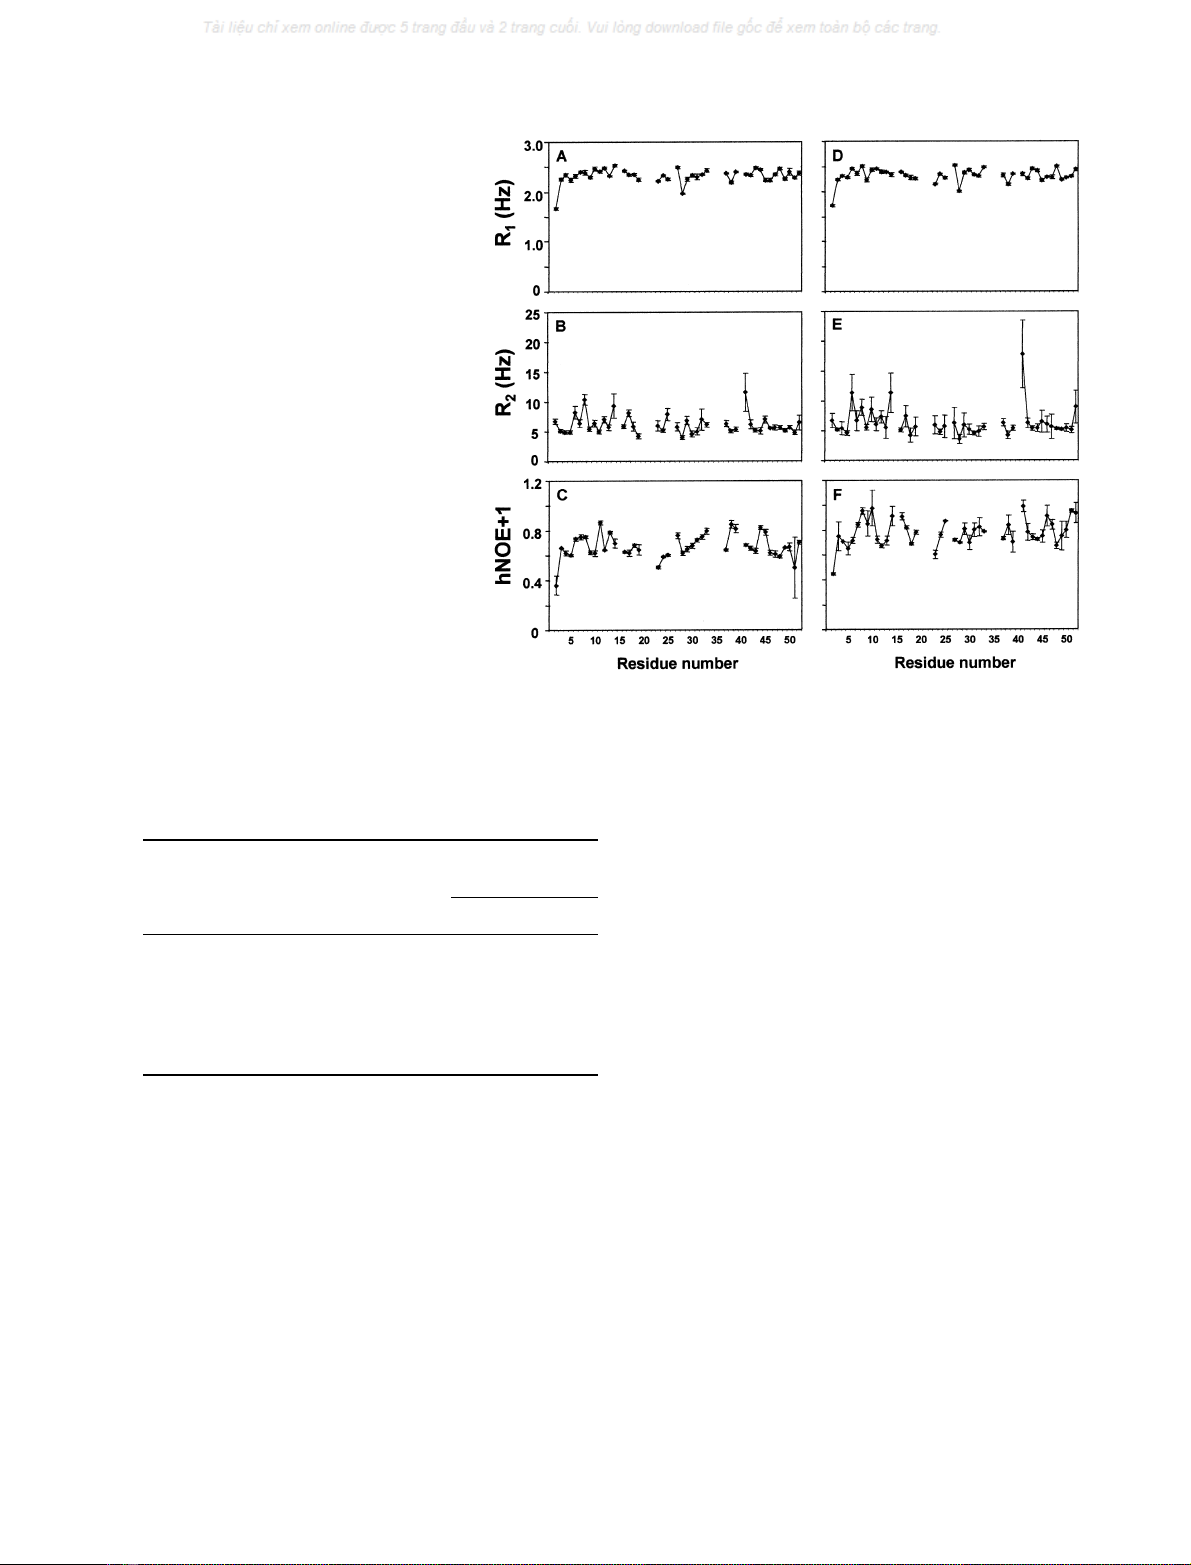
Relaxation data and dynamic parameters
Relaxation parameters were measured at 30 C for 42 of the
47
15
N amide nuclei present in the protein (Fig. 2), and
analysed using the program Model-free v.4.01 [31,40]. The
diffusion tensor (D) and the rotational correlation time (s
m
)
were evaluated prior to analysis. The software package
R
1
R
2_
DIFFUSION
[31,40] was used to translate the centre of
mass of the mean structure of the NMR ensemble [28] to the
origin of coordinates, and to estimate D from T
1
/T
2
ratios.
Residues that might be undergoing conformational exchange
were identified from the condition: (ÆT
2
æ)T
2,n
)/ÆT
2
æ)(ÆT
1
æ
)T
1,n
)/ÆT
2
æ>1.5randexcluded[41].Here,T
2,n
is the T
2
of residue n, ÆT
2
æis the average T
2
,andris the standard
deviation of (ÆT
2
æ)T
2,n
)/ÆT
2
æ)(ÆT
1
æ)T
1,n
)/ÆT
2
æ.
The axially symmetric diffusion model best fitted the
experimental data, and the structure was rotated to its
principal axis for use in the model-free analysis. The
parameters, selected by extensive Monte-Carlo simulations
as described by Mandel et al. [31], are summarized in
Table 1. After model selection, both the correlation time
and the axially symmetric diffusion tensor were optimized
simultaneously with all other model-free parameters.
In the presence of KCl, there were five residues that did
not fit any model in the analysis; these are Tyr11, Tyr13,
Leu33, Gly43, and Ala44. Five residues also failed to fit any
model in the presence of DGP: Thr7, Val8, Ala16, Leu33,
and Val41. The rotational correlation time, s
m
, determined
in the final calculations, was 3.9 ± 0.2 and 4.6 ± 0.4 ns in
the presence of 100 m
M
KCl and DGP, respectively. These
values for s
m
are in agreement with the observed negative
NOE values and the small size of the protein.
Effective correlation times (s
e
) in the range of 20–70 ps
were found for 13 residues in 100 m
M
KCl (Fig. 3). In the
presence of DGP, 10 residues required the determination of
s
e
to fit the model. In both cases, most of these residues are
located in the hairpin loop region. Only two residues (8 and
46) required an R
ex
term for adequate fitting in the presence
of KCl, with values ranging from 0.8 to 4 s
)1
. When DGP
was present, six residues needed an R
ex
term (residues 24, 31,
32, 44, 49 and 51), but the fitted value is close to zero in all
six cases.
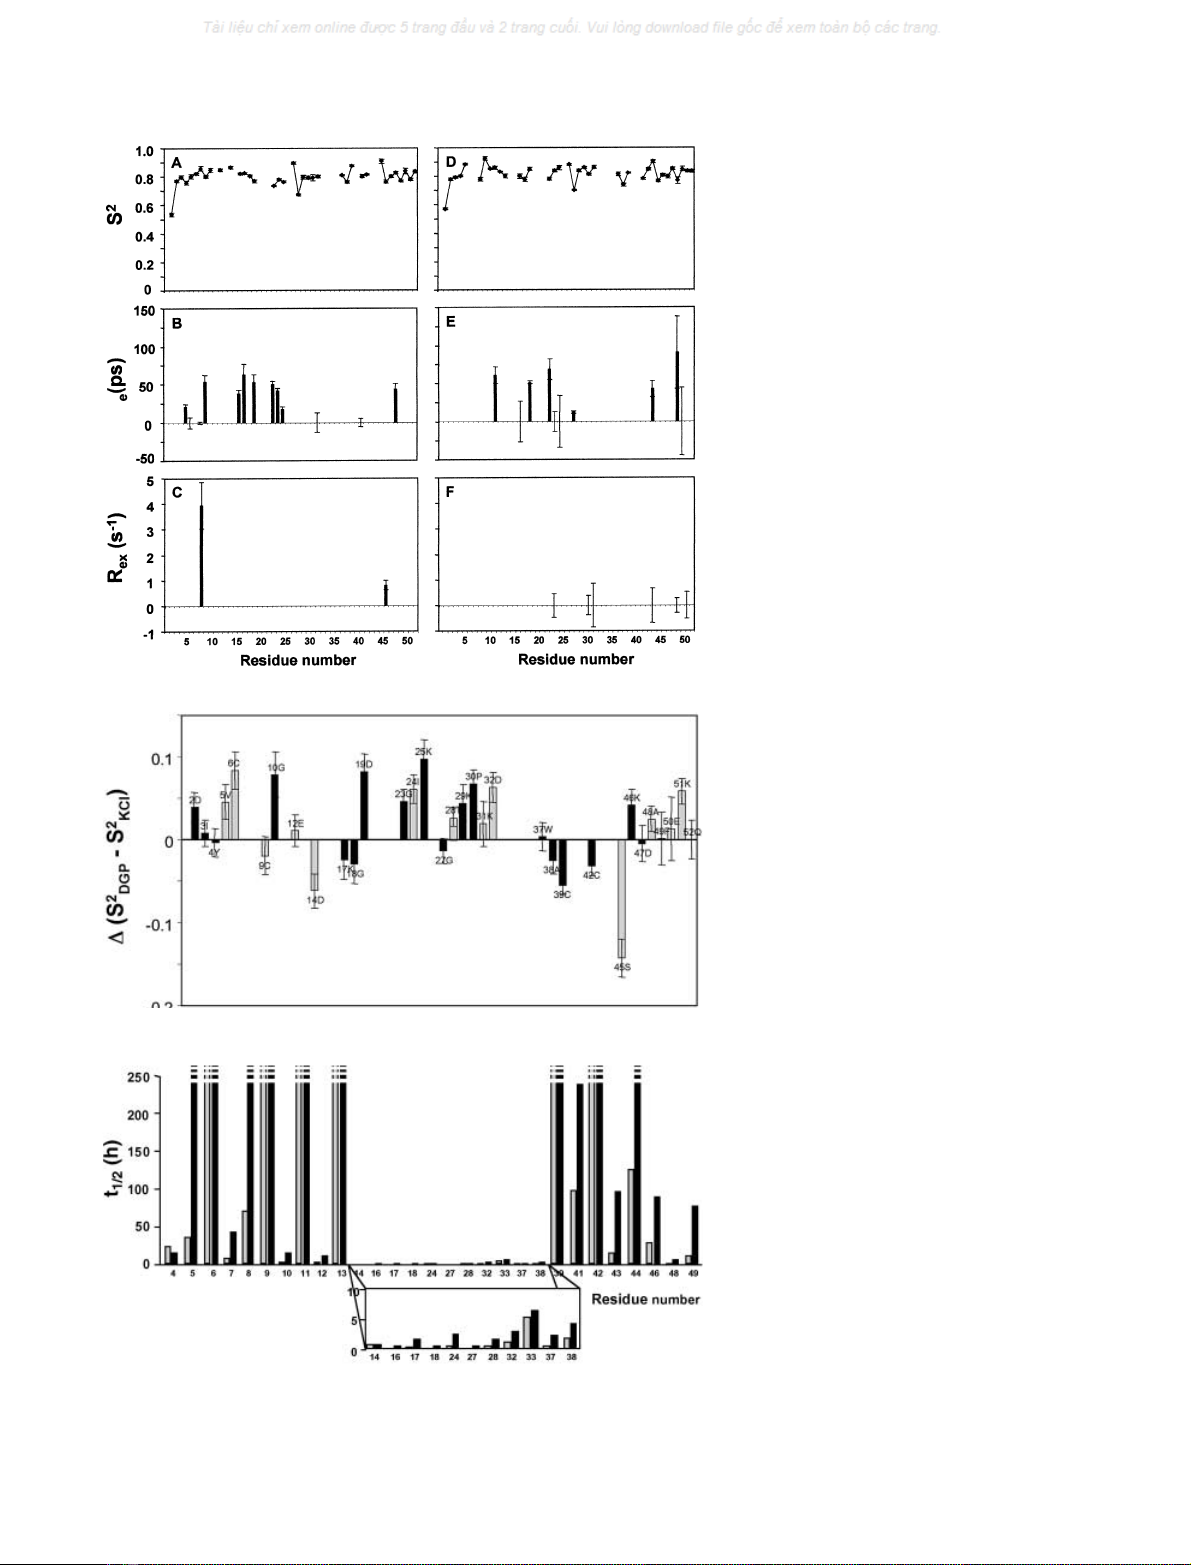
The values of the generalized order parameter, S
2
(Fig. 3)
do not display any particular trend over the protein
Fig. 1.
1
H–
15
NHSQCspectrumof
15
N-labelled RdDg (Zn-form) in the
presence of 100 m
M
KCl at 30 °C.
4608 P. Lamosa et al. (Eur. J. Biochem. 270)FEBS 2003
sequence except for the small values in residue 2, which
agrees with the expected flexibility of the N-terminal
region of the protein. The difference of S
2
values in the
presence and absence of solute are shown in Fig. 4. Overall,
the average S
2
values tend to be higher in the presence of
DGP, but the average difference is only 0.015, and there is
no obvious trend towards segmental rigidification of any
part of the sequence. Instead, the whole protein (with the
exception of residues 14–18 and 37–45) tends to display
higher S
2
values in the presence of the solute (Fig. 4).
1
H–
2
H amide exchange
To evaluate the relative mobility and exposure of the several
segments of the protein sequence,
1
H–
2
H amide exchange
rates of
15
N labelled RdDg were measured at 40 Cand
pH 5 by recording 2D HSQC spectra in
2
H
2
O as a function
of time and fitting the peak volumes to single exponential
decays (Fig. 5). The exchange rates of several amides were
inaccessible under these experimental conditions: 26 resi-
dues exchanged so rapidly that the signals were undetectable
at the start of the spectral acquisition, and nine residues gave
signals that remained almost constant throughout the
experiment, indicating half-lives greater than 250 h. The
slowly exchanging residues are clustered around the knuckle
that contains the metal centre, while the central region of the
b-sheet and the base of the hairpin loop display intermediate
exchange rates (Fig. 6). The most rapidly exchanging
residues are positioned in the hairpin loop, the protein
termini and the less structured region of residues 34–36 [28],
which is in agreement with a possible higher mobility of
these regions.
The addition of DGP produced a remarkable increase of
half-lives in the 17 amide exchange rates that were measured
both in its presence and absence at 40 C, reflecting the
structural stabilization provided by this solute.
The EX2 exchange regime has been established in various
rubredoxins (as in most globular stable proteins) [27,42]. In
fact, EX1 reactions are rarely seen in stable proteins,
occurring mostly under the conditions used in some protein
refolding experiments [43–46]. Under the EX2 regime, the
exchange rates are described by Eqn (1):
kex ¼Kopkch½Catð1Þ
where K
op
is the equilibrium constant for structural
opening reactions that expose the NH group [33]. The
term k
ch
[Cat] can be calculated from exchange rates in
unstructured peptides and used to obtain K
op
, and hence
a value of DG for the opening reactions [47]. Assu-
ming that the slowest exchanging residues (Val5,
Fig. 2.
15
N amide relaxation parameters of
RdDg as a function of residue number in the
presence of 100 m
M
KCl (A–C), or 100 m
M
DGP (D–F). (A,D) Longitudinal relaxation
time; (B,E) transverse relaxation time; (C,F)
heteronuclear NOE.
Table 1. Summary of parameters used to fit T
1
,T
2
and hNOE. S
2
is the
square of the generalized order parameter characterizing the amplitude
of the internal motions; s
e
is the effective correlation time for the
internal motions; R
ex
, is the exchange contribution to T
2
,andthe
subscripts f and s indicate fast and slow time scales, respectively.
Model
Optimized
parameters
Fitted residues in the
presence of
KCl DGP
1S
2
23 24
2S
2
and s
e
12 7
3S
2
and R
ex
13
4S
2
,s
e
and R
ex
13
5S2
s,S2
fand s
e
00
Not fit – 5 5
FEBS 2003 Effect of DGP on rubredoxin dynamics (Eur. J. Biochem. 270) 4609
Cys6, Thr7, Val8, Cys9, Tyr11, Tyr13, Cys39, Val41, and
Cys42), which are all located near the metal centre,
exchange via a single opening reaction, it is possible to
use the measured exchange rates at five temperatures
(between 50 and 70 C) at pH 6, to obtain the tempera-
ture dependence for the DGof the structural opening
Fig. 3. Estimated model-free parameters of
RdDg as a function of residue number in the
presence of 100 m
M
KCl (A–C), or 100 m
M
DGP (D–F). (A,D) Generalized order
parameter; (B,E) effective correlation time;
(C,F) chemical exchange rate.
Fig. 4. Difference between the generalized or-
der parameters in the presence of 100 m
M
KCl
or DGP of RdDg. Only residues whose
parameters were calculated in both cases with
thesame(blackbars)orwithdifferent
dynamic models (grey bars) are included.
Fig. 5. Half-life values for the
1
H–
2
Hamide
exchange reaction in RdDg measured at 40 °C
in the presence of DGP (black bars) or KCl
(grey bars) at 100 m
M
.The broken bars rep-
resent the slowest exchanging residues with
half-life values higher than 250 h, which were
too long to be determined in the experimental
time frame.
4610 P. Lamosa et al. (Eur. J. Biochem. 270)FEBS 2003