HPU2. Nat. Sci. Tech. Vol 03, issue 01 (2024), 39-46.
HPU2 Journal of Sciences:
Natural Sciences and Technology
Journal homepage: https://sj.hpu2.edu.vn
Article type: Research article
Received date: 17-01-2024 ; Revised date: 06-02-2024 ; Accepted date: 04-03-2024
This is licensed under the CC BY-NC 4.0
39
The origins of size-dependent UV stabilities of CdZnTeS alloyed
quantum dots
Phuong-Nam Nguyena, Thi-Phuong Nguyenb, Anh-Duc Vuc, Duy-Khanh Nguyena,
Duy-Tung Daod, Xuan-Dung Maia*
aHanoi Pedagogical University 2, Vinh Phuc, Vietnam
bHoang Hoa Tham Elementary and Secondary School, Bac Ninh, Vietnam
cKazan National Research Technological University, Republic of Tatarstan, Russian
dAdvanced Photonics Research Institute, Gwangju Institute of Science and Technology, Gwangju, Republic of Korea
Abstract
CdTe-based quantum dots (QDs) have been used as active materials in various applications, such as
sensing, imaging, and light-harvesting devices where the QDs are continuously illuminated by suitable
lights. Passivation of CdTe QDs with stable inorganic layers to form core/shell or core/multiple-shell
structures has been demonstrated to improve the stabilities of QDs against illumination. However,
information related to the UV stability of newly developed CdZnTeS alloyed QDs has not been fully
explored yet. Herein, we synthesized CdZnTeS alloyed QDs of different sizes and compared their
size-dependent stabilities under UV irradiation. Upon UV exposure the first excitonic peak of QDs
blue-shifted, gradually and the relative Cd concentration decreased indicating that QDs were steadily
dissolved. We found that the smaller QDs dissolved faster than the larger QDs. By correlating this
with the change in the QDs' crystalline structure corroborated by X-ray diffraction studies, we
demonstrated that the alloyed structure with a sulfide-rich surface enhances the stabilities of larger
QDs. The size-dependent stabilities of alloyed QDs demonstrated here provide information for
selecting the right QDs for specific applications.
Keywords: CdTe quantum dots, alloyed structure, size-dependent, stabilities, dissolution
1. Introduction
Water-soluble CdTe QDs have been demonstrated to be applicable in many applications
including (but not limited to) light-harvesting materials in solar cells [1], [2], photoluminescence-
based sensing [3], [4], and bioimaging [5], [6]. In solar cell applications, the QDs’ size determines the
* Corresponding author, E-mail: xdmai@hpu2.edu.vn
https://doi.org/10.56764/hpu2.jos.2024.3.1.39-46

HPU2. Nat. Sci. Tech. 2024, 3(1), 39-46
https://sj.hpu2.edu.vn 40
portion of the solar spectrum to be absorbed because of size-dependent QDs’ bandgap [1], [7]. The
size of QDs also influences the band-edge energy levels that strongly affect the efficiency of electron-
hole pair separation at the QDs interfaces [1], [8]. In photoluminescence-based sensing applications,
the PL intensity of CdTe QDs is changed functionally with the concentration of analyte [9]−[11]. The
variation in PL intensity could be due to the loss of capping ligands [12], charge transferring at QD-
analyst interfaces [13], and the interaction between the analyst and QDs' surface [14]. Nevertheless,
the response of PL intensity relate to the surfaces of QDs which is also influenced by the QDs’ size
[2], [15], [16]. Therefore, any variation in the QDs’ size upon light illumination, the most common
working condition of QDs, could lead to failures in application.
Under excitation, especially in the presence of oxygen, CdX (X=S, Se, Te) QDs are oxidized
gradually leading to a number of effects including a decrease in PL efficiency and liberation of toxic
Cd2+ ions [17], [18]. Coating CdTe QDs with stable inorganic shells, such as CdS and ZnS shells in
either a core/shell or a core/multiple-shell structure has been widely used to enhance the PL efficiency
and to reduce the leaching of Cd ions [19], [20]. One drawback of the core/shell structures is time-
consuming syntheses which include the preparation of CdTe QDs and post-growing shells [21], [22].
Alternatively, a one-pot procedure in which an alkaline mixture of Cd2+, Zn2+, Te2- precursor (Te or
Na2TeO3), and NaBH4 is heated in the presence of mercapto ligands has been developed to prepare
CdZnTeS alloyed QDs [23], [24]. The alloyed structure with a ZnS-rich surface makes CdZnTeS QDs
to be highly photoluminescent. To utilize those alloyed QDs into practical applications, some
important information such as the emission yield [25], toxicity [26], redox potential [27], and size-
dependent reactivity [14], [28] have been explored. However, information related to the stabilities of
alloyed QDs under excitation conditions has not been fully described yet.
In this study, we synthesized CdZnTeS alloyed QDs of different sizes and correlated the size of
QDs to their pH and UV stability. Optical characterizations and the cadmium analysis revealed that the
smaller QDs are more prone to dissolve than the bigger QDs. The results presented in this study offer
further insights into the properties of CdZnTeS alloyed QDs relevant to practical applications.
2. Experimental
2.1. The synthesis and purification of CdZnTeS alloyed quantum dots
CdZnTeS alloyed QDs were synthesized by adopting a procedure reported previously [14].
Briefly, a mixture containing 0.9 mmol CdCl2, 0.1 mmol ZnCl2, 1.24 mmol GSH, 0.18 mmol
Na2TeO3, and 1.98 mmol NaBH4 at a pH of 10.5 (adjusted by a NaOH 1.0 M solution) was refluxed in
an Ar-filled flask. QDs of different sizes whose first excitonic peaks at 477 nm (denoted as g-QDs),
522 nm (y-QDs), and 664 nm (r-QDs) were obtained after 10 minutes, 60 minutes, and 180 minutes of
refluxing, respectively. The crude QDs were washed by precipitation with acetone (Aladdin chemicals,
HPLC grade), centrifuged at a speed of 5000 rounds per minute for 6 minutes, and re-dispersed in
water. The precipitation − centrifugation − dispersion cycle was repeated twice to obtain pure QDs
which were stored in black vials at 4oC for further use.
2.2. Characterizations
A JEM 2100 microscope was used to conduct TEM images while A D8 Advance X-ray
diffractometer was used to measure X-ray diffraction (XRD) of QDs. To study the UV stability of
QDs, aqueous solutions of QDs in quartz flasks were stirred and placed in a chamber (55×35×40 cm).
The UV light source was 365 nm LEDs with a total power of 10 W and the distance from LEDs to the
HPU2. Nat. Sci. Tech. 2024, 3(1), 39-46
https://sj.hpu2.edu.vn 41
flasks was 10 cm. Aliquots were taken after different periods of UV exposure for optical
characterizations. The absorption spectra were conducted on a UV-2450 (Shimadzu)
spectrophotometer and the photoluminescent spectra were measured on an FLS1000 (Edinburgh)
spectrometer. For elemental analysis, the QDs solutions obtained after different periods (0, 30, 60, and
180 minutes) of UV exposure were sequentially filtered via 0.21 μM syringe filters, precipitated with
excess acetone, and centrifuged at 10.000 rounds per minute for 10 minutes to obtain QDs solids. The
QDs solids were digested by 25 ml of nitric acid solution (2% by weight) at 50oC for 2 hours and
diluted to 100 ml for quantitative analysis of Cd2+ concentration which was conducted on an
inductively coupled plasma mass spectrometry (Agilent 7900). The concentrations of Cd2+ in each set
of QDs’ size was normalized to the 0-minute aliquot.
3. Results and discussion
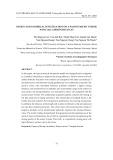
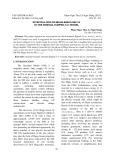
Figure 1. (a) XRD patterns, (b) TEM images, and (c) size-distribution of green emitting (g-QDs), yellow-
emitting (y-QDs), and red-emitting (r-QDs) CdZnTeS alloyed quantum dots. In (a) the standard XRD database
of CdTe (JCPDS#: 15-0770), ZnTe (JCPDS#: 15-0746), CdS (JCPDS#: 47-1179), and ZnS (JCPDS#: 05-0566)
crystals are shown for referring.
XRD patterns of QDs are shown in Figure 1a in comparison with other possible crystal phases
including zinc-blende CdTe, ZnTe, CdS, and ZnS. In g-QDs, a clear diffraction peak positioned at
46.4o could be assigned to the (311) plane of CdTe (Joint Committee on Powder Diffraction Standards,
JPCDS, file number 15-0770) [22]. The diffraction peak from (111) planes of CdTe at 23.8o was
broadened, probably due to the inclusion of Zn2+ and S2- ions into the CdTe crystal and due to the
small size of g-QDs. The diffraction peak at 46.4o observed in g-QDs likely evolved into two peaks at
about 44o and 50.7o which are close to the diffraction positions of (220) and (311) planes of ZnTe and
CdS [24]. Additionally, the diffraction peak positioned at about 27o became sharper in y-, and r-QDs;
the peak was in the between diffraction positions (111) of CdS and ZnS. TEM images of QDs shown
HPU2. Nat. Sci. Tech. 2024, 3(1), 39-46
https://sj.hpu2.edu.vn 42
in Figure 1b clearly exhibit individual spherical crystals. The diameter of g-, y-, and r-QDs shown in
Figure 1c were about 3.4, 4.1, and 4.8 nm, respectively. Based on TEM images and XRD patterns of
QDs shown in Figure 1 we deduced that g-QDs were mostly CdTe nanocrystals. As the QDs grew
Cd2+, Zn2+, Te2-, and S2- ions assembled gradually into the alloyed crystals of CdZnTeS QDs.
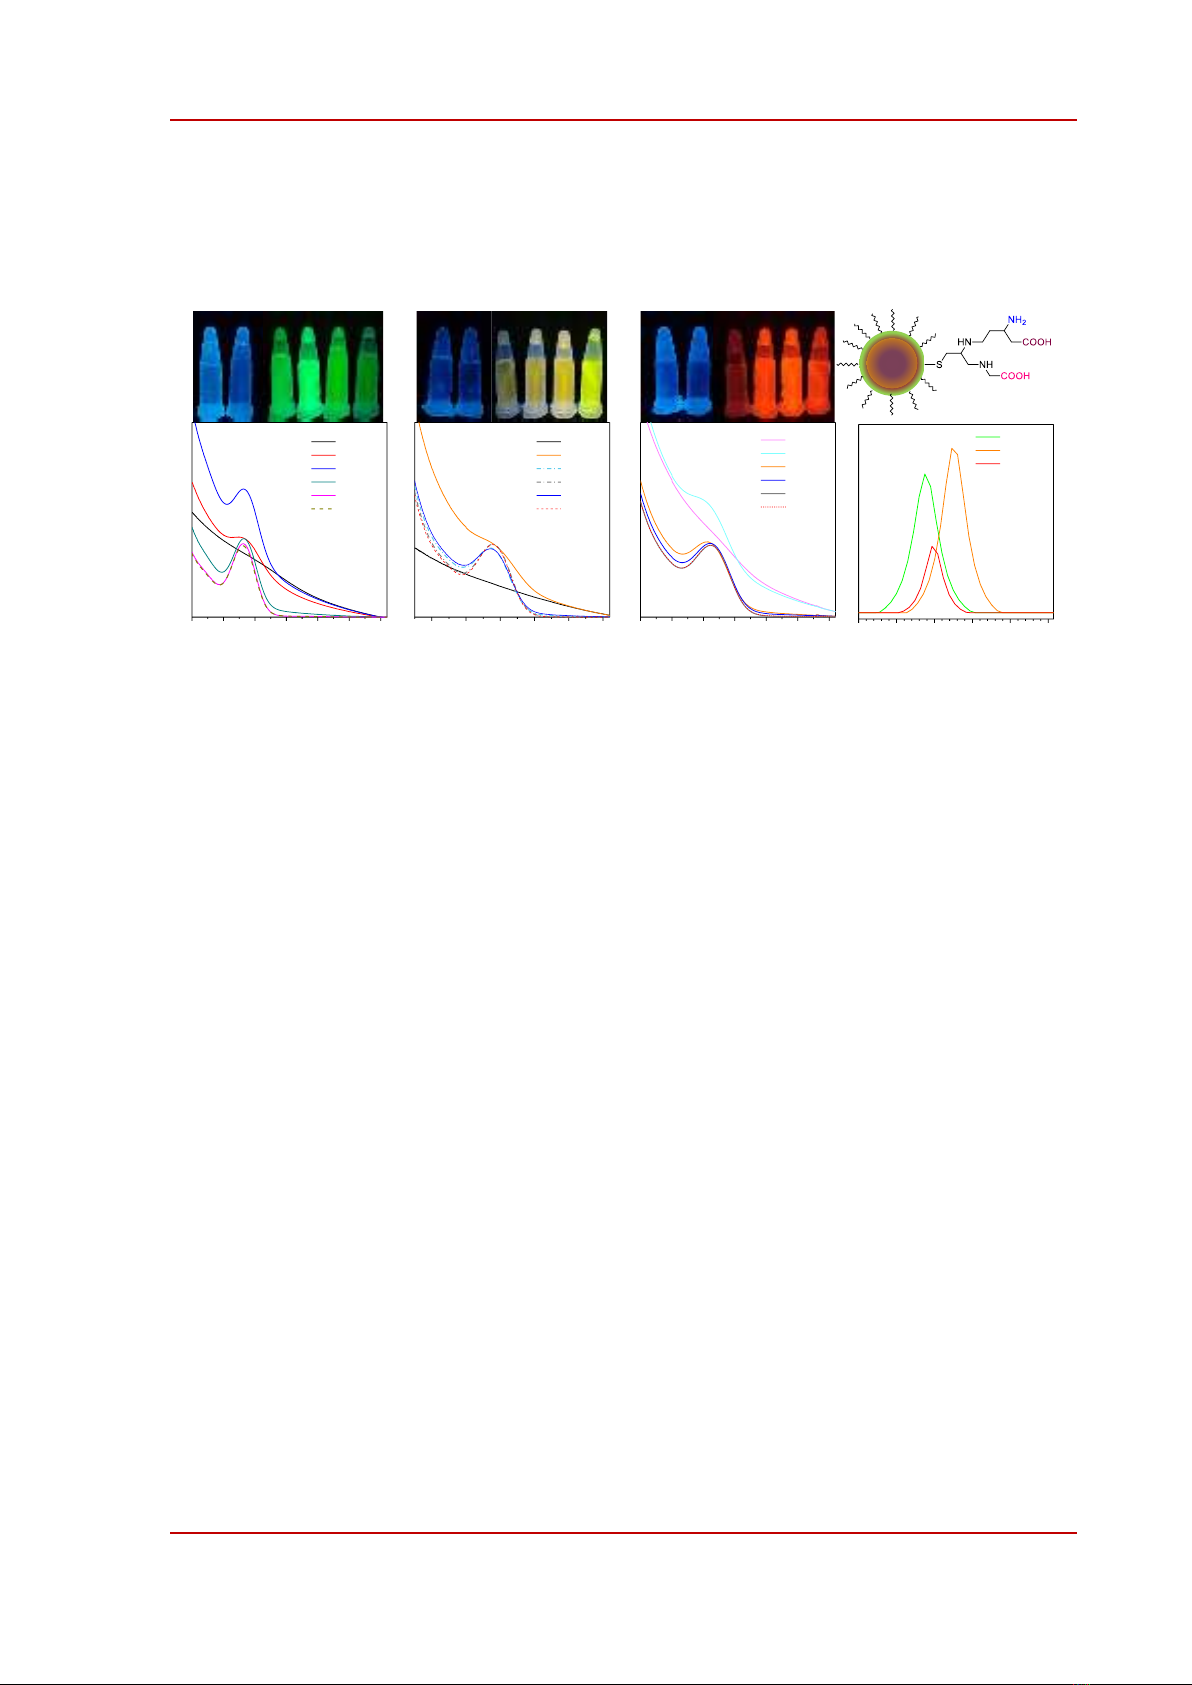
Figure 2. Absorption spectra measured at different pH of (a) g-QDs, (b) y-QDs, and (c) r-QDs. The pictures
inserted above each graph are the QDs solutions under UV lamp (365 nm). d) Model of GSH capped quantum
dots. (e) Zeta potential of quantum dots measured at pH of 7.
Water solubility is one of the major characteristics targeted for the applications of CdTe-based
QDs. In some applications, such as heavy metal ion sensing [12], [29], [30], the effects of pH on QDs
are important because pH determines the type of metal ions and their relative concentrations in water
[31]. We measured the absorption spectra at different pH levels to study the effects of pH on the
colloidal stability of CdZnTeS alloyed QDs, and the results are shown in Figure 2. In neutral or
slightly alkaline pH, the absorption spectra of QDs exhibit well-resolved excitonic peaks at 477 nm (g-
QDs), 522 nm (y-QDs), or 664 nm (r-QDs). The QDs solutions emit intensively under UV light (365
nm) as seen in the insets in Figure 2a-c. At pH of 5, QDs were partially accumulated forming larger
aggregates that enhance light loss due to light-scattering effects as indicated by an increase in the
absorbance as clearly seen in Figure 2a. At lower pH, the excitonic peaks were blurred and the QDs
solutions did not exhibit fluorescence indicating that all QDs were precipitated. Those results suggest
that g-QDs were colloidally stable at pH ≥7 while y-, and r-QDs were stable at pH ≥5.
It has been demonstrated that GSH cap onto the surface of CdZnTeS alloyed QDs via Cd-S bonds
and that GSH ligands expose outward two −COOH groups and one –NH2 group whose pKa values are
2.1, 3.5, and 9.1, as respectively indicated in Figure 2d, [14], [26]. At neutral pH the carboxyl groups
are in a carboxylate (−COO-) state while the amino groups are in a protonated (−NH3
+) state making the
surface of QDs negative, as proved by Zetal potential measurements shown in Figure 2e. By using the
pKa values we can calculate that at pH of 3 the total concentration of –COO- equals to that of −NH3
+ so
that the surface charge of QDs is neutral. This theoretical calculation explained why the QDs were
precipitated when pH was about 3 as mentioned above.
400 450 500 550 600 650 700
Absorbance (a. u)
Wavelength (nm)
pH = 2
pH = 3
pH = 5
pH = 7
pH = 8
pH = 10
pH= 2 3 5 7 8 10
450 500 550 600 650 700
Absorbance (a. u)
Wavelength (nm)
pH= 2
pH= 3
pH= 5
pH= 7
pH= 8
pH= 10
pH= 2 3 5 7 8 10
450 500 550 600 650 700 750
Absorbance (a. u)
Wavelength (nm)
pH= 2
pH= 3
pH= 5
pH= 7
pH= 8
pH= 10
pH= 2 3 5 7 8 10
a)b)c)
-150 -100 -50 0 50 100
Intensity (a. u)
Potential (mV)
g-QDs
y-QDs
r-QDs
e)
pKa= 2.1
pKa= 3.5
pKb= 4.9
d)
HPU2. Nat. Sci. Tech. 2024, 3(1), 39-46
https://sj.hpu2.edu.vn 43
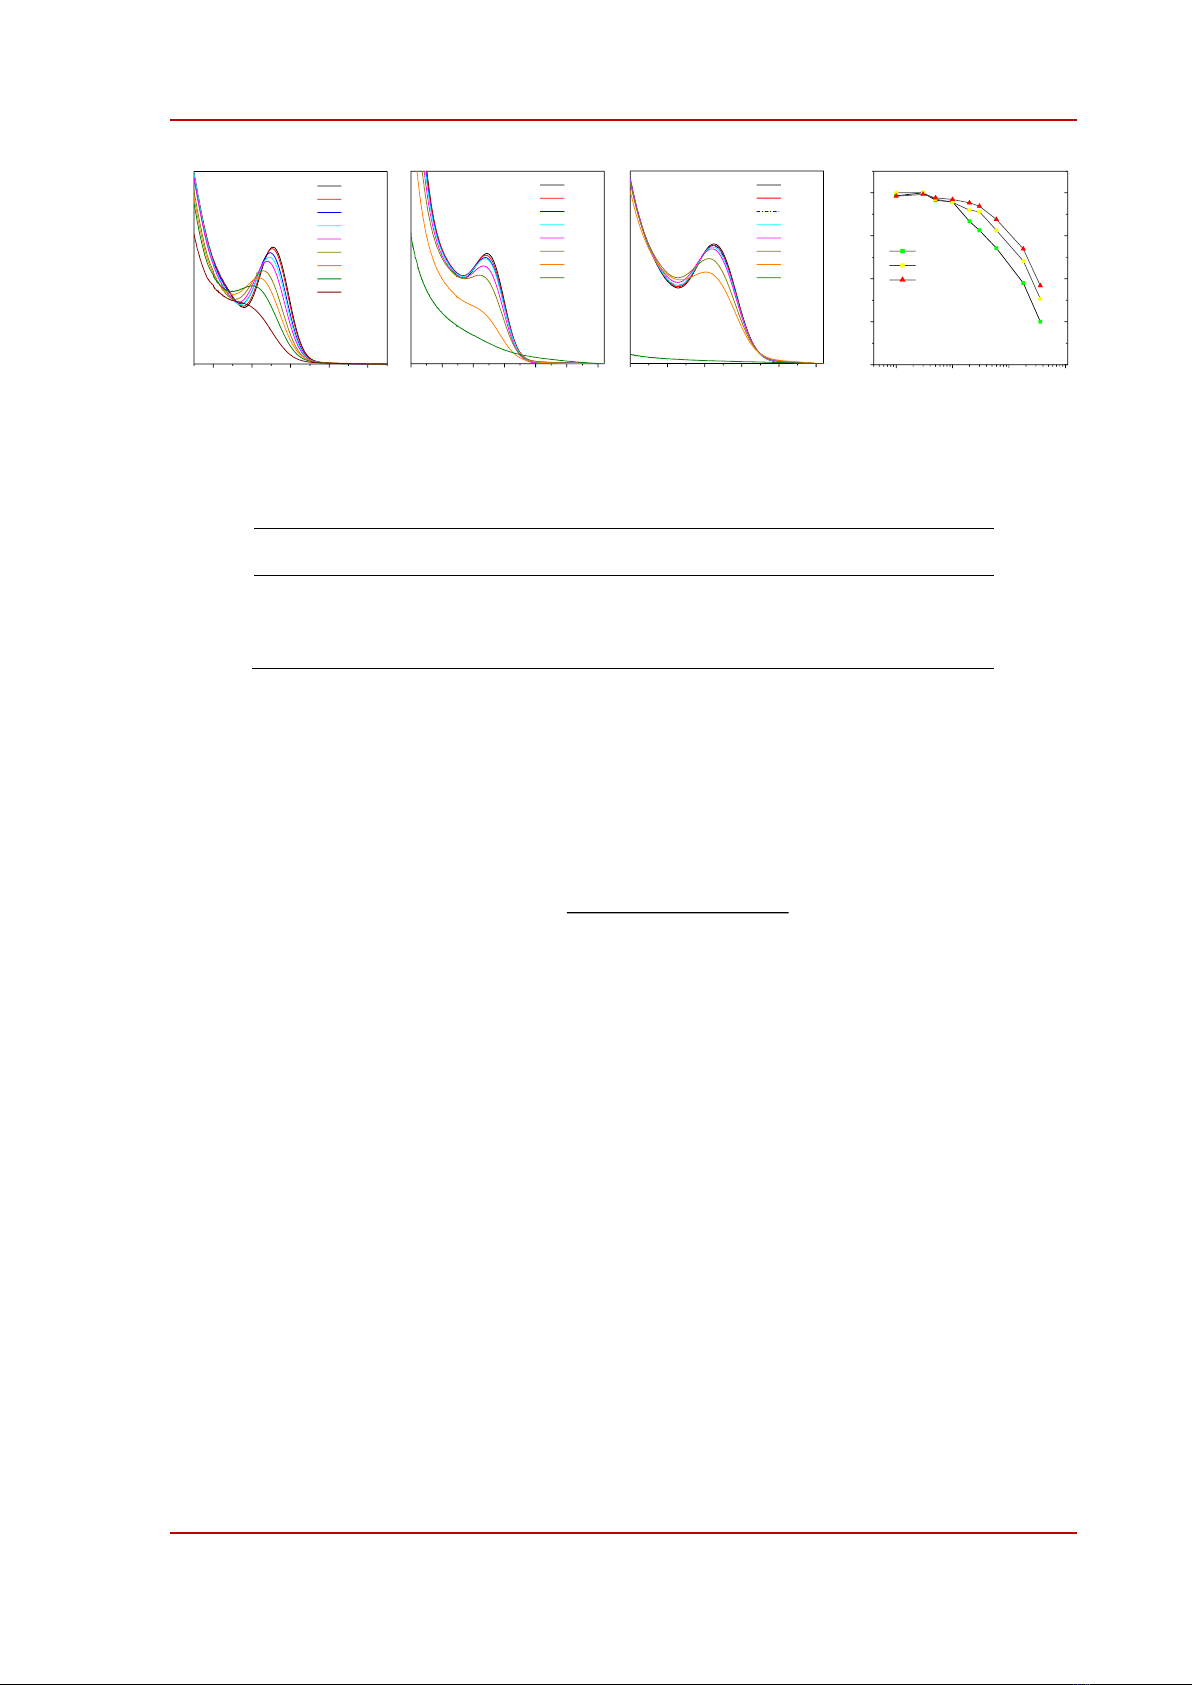
Figure 3. (a)-(c) Absorption spectra of green emitting (g-QDs), yellow-emitting (y-QDs), and red-emitting (r-
QDs) CdZnTeS alloyed quantum dots. (d) Calculated relative diameter (d/do) of quantum dots using the position
of first excitonic peak in (a)-(c).
Table 1. Relative concentration of Cd digested from quantum dots after UV exposure.
UV exposing time (minutes)
Relative concentration
g-QDs
y-QD
r-QDs
0
1
1
1
30
0.95
0.97
0.98
60
0.91
0.94
0.96
180
0.86
0.92
0.92
The effects of UV exposure on the absorption and emission properties of QDs are shown in
Figure 3. As the exposure time increased, the first excitonic peaks of all QDs blue-shifted and became
blurred. After about 720 minutes y- and r-QDs were precipitated as indicated by the scattering-like
absorption feature in Figure 3b-c. We calculated the bandgap (Eo) from the position of the first
excitonic peak and used a correlation function (1) to determine the diameter (d) of QDs at different
periods of UV irradiation.
2
1
1.51 0.048 0.29 0.09
o
Edd
=+
+−
(1)
In (1), 1.51 is the band gap of bulk CdTe [7]. The variation of the relative diameter (d/do) of QDs
with UV irradiation is summarized in Figure 3d. Obviously, the relative diameter of the smaller QDs
decreased more quickly than the larger ones. To correlate the decrement in the size of QDs to a
possible release of toxic Cd ions, we precipitated QDs and analyzed the amount of remaining Cd using
an ICP-MS method (see the experimental section). The relative concentration of Cd decreased faster in
the smaller QDs. This trend was in line with the decreasing QDs' size discussed in Figure 3d indicating
that UV exposure induces the dissolution of QDs into ionic species. Under UV irradiation, the smaller
QDs were dissolved more rapidly than the larger QDs.
In a previous study [14] we demonstrated that UV irradiation causes the PL efficiency of the
smaller QDs to decrease faster than the bigger QDs. The PL decrease induced by UV exposure has
been reported widely, known as photobleaching, and is usually attributed to the oxidation of the QDs
surfaces [18]. The oxidation of surficial Te2- ions leads to the gradual detachments of Te2- (in the
forms of oxygen-containing anions) and Cd2+ ions. Those detachments cause several effects including
(1) The size of QDs decreases as directly indicated by the fist excitonic peaks shifting to lower
wavelength (Figure 3); (2) The leaching of Cd2+ ions, as discussed in Table 1, that causes potential
toxicity of QDs; (3) The detachment of Cd2+ ions also takes GSH capping molecules out of the QDs'
surface resulting in decreased colloidal stability as indicated by the precipitation of QDs after 720
minutes of UV exposure (Figure 3b-c); and (4) The oxidation of Te2- ions and the consequent ions
400 450 500 550 600
Absorbance (a. u)
Wavelength (nm)
0 m
10 m
20 m
30 m
60 m
180 m
360 m
720 m
1440 m
400 450 500 550 600 650 700
Absorbance (a. u)
Wavelength (nm)
0 m
10 m
20 m
30 m
60 m
180 m
360 m
720
450 500 550 600 650 700
Absorbance (a. u)
Wavelength (nm)
0 m
10 m
20 m
30 m
60 m
180 m
360 m
720 m
a)b)c)d)
110 100 1000
0.92
0.94
0.96
0.98
1.00
Relative diameter d/do
UV exposing time (minutes)
g-QDs
y-QDs
r-QDs
g-QDs y-QDs r-QDs