* Corresponding author
E-mail address: malshurideh@sharjah.ac.ae (M. Alshurideh)
© 2020 by the authors; licensee Growing Science.
doi: 10.5267/j.uscm.2020.2.005
Uncertain Supply Chain Management 8 (2020) 579–588
Contents lists available at GrowingScience
Uncertain Supply Chain Management
home
p
a
g
e: www.Growin
g
Science.com/usc
m
Do perceived service value, quality, price fairness and service recovery shape customer
satisfaction and delight? A practical study in the service telecommunication context
Haitham Alzoubia, Muhammad Alshuridehb*, Barween Al Kurdic and Mohammad Inairata
aSkyline University College, United Arab Emirates
bUniversity of Sharjah, United Arab Emirates
cAmman Arab University, Jordan
C H R O N I C L E A B S T R A C T
Article history:
Received November 29, 2019
Received in revised format
January 31, 2020
Accepted February 20 2020
Available online
Februar
y
20 2020
Customer focus strategy has shifted the way the businesses shape their customer satisfaction.
Service oriented companies in general have been given a great emphasis and a significance
care to both customer satisfaction and customer delight lately. However, the management
decision of what to offer to gain customer happiness is still a challenge issue. To test such
issue, this study develops and tests a set of new factors which shapes both customer satisfaction
and delight within the UAE setting. The factors include perceived service value, perceived
service quality, perceived price fairness in addition to perceived service recovery. Data were
collected through survey using a structured questionnaire distributed to 420 customers over all
28 branches of Etisalat Company in Dubai. 350 valid questionnaires were analyzed using factor
analysis along with correlation and regression. The results of the study indicate that perceived
service value, perceived service quality, perceived price fairness and perceived service
recovery could be considered as the critical success factors that can be used to shape and
measure customer satisfaction and delight. The findings can be used as guidelines to retain
customers and to enhance the business value especially when organizations service providers
focusing more on what customer perceive rather than focusing on what to offer from products
and/or services. Moreover, some managerial implications and a set of theoretical
recommendations are suggested in the final part of this study.
.2020 b
y
the authors; license Growin
g
Science, Canada©
Keywords:
Customer Delight
Customer Satisfaction
Service Value
Service Quality
Service Recovery
Price Fairness
1. Introduction
Organizations are interested in achieving high customer satisfaction and happiness in order to encourage them to repeat the
purchase and to encourage others to do so (Famiyeh et al., 2018). Although customer satisfaction is not an ultimate goal for
the organization, but it is one of the methods used to measure customer loyalty (Zameer et al., 2019) or to measure customer
delight (Torres & Kline, 2006; Hensher, 2014). Initially it is important to discuss what customer satisfaction and customer
happiness mean and declare if both concepts differ. Customer satisfaction has been defined by Schiffman and Kanuk (2004)
as the “individual's perception of the performance of the product or service in relation to his or her expectations” while
Patterson (1997) declared that “customer delight involves going beyond satisfaction to delivering what can be best described
as a pleasurable experience for the client”. Accordingly, it can be elicited that customer delight and happiness express a
stronger emotional status and denote a differ of a high psychological status than satisfaction and go beyond to include
surprise and joy (Nadler, 1970; Kumar et al., 2001; Kangogo et al., 2013; Ahmed et al., 2016).

580
It has been observed that the main benefit of satisfied customers is to spread a good and positive word of mouth about the
organization and its products and/or services (Abdul Rehman, 2012; Alzoubi, et al., 2019) and practically increase the repeat
purchase behavior (Alshurideh et al., 2012). Meanwhile, improving the customer satisfaction would improve the company
image and the brand name image as well (Phi et al., 2018) as well as many scholars denoted that customer happiness tend
to increase customer loyalty (Plassmann et al., 2007; Suki, 2014) and retaining a happy customer costs five time less than
attracting a new customer (Albarq, 2013). However, a large number of satisfied customers is expected to improve the
profitability in terms of increasing sales, and influence the overall growth of the company (Yalllapragada, 2017). Lately,
customers delight and happiness start to appear in the emerging economies and legally some countries (for example, UAE)
start adapting such concept heavily not only in delivering their governmental services but also in evaluating the quality of
such services delivered. According to Torres and Kline (2006), during the last few years, the customer delight concept has
been used recently in literature while it takes precedence over other concepts such as customer satisfaction. Both scholars
mentioned that little number of studies have tackled the customer delight in different business topics such as hospitality
industry. Thus. This study adds value to the knowledge by addressing the main factors affecting customer delight from
service value perception, service quality perception, and service price fairness perception in addition to service recovery
perception in the telecommunication industry. Organizations have used to measure customer satisfaction because it helps
them determine whether their products/services meet the customer expectation or not, or whether the customers have better
experience than their expectations do. Within the meanwhile, measuring customer delight helps firms know whether they
are doing well or not, and to adjust their performance with the required improvement, which shift to meet customer
expectations. This might help companies decide where they want to look ahead in terms of their both strategy and polices
then monitoring their performance accordingly otherwise, they might end up losing the customers to the other competitors
on the market (Alkalha et al., 2012; Shannak et al., 2012; Odunlami, et al., 2013).
UAE Etisalat Company started providing telecommunication services in 1963 in the UAE. While International Etisalat have
operations in other 19 countries include East African and the Middle East, with over 135 million customers, and it is the
12th largest voice carrier in the world. Etisalat serve around 11.6 million customers in UAE. This study has come to assess
the effect of four proposed factors including perceived service value, perceived service quality, perceived service recovery
and perceived price fairness on both customer satisfaction and customer happiness at Etisalat Company in UAE.
There is no doubt that all organizations are interested in seeking to satisfy their customers and investigate the factors that
make them happy. This study comes to serve the literature and practitioners by studying new factors that are used to test
customer satisfaction and happiness, which are perceived service value, perceived service quality, perceived service
recovery and perceived price fairness. However, a large number of studies have been done to investigate customer
satisfaction and loyalty such as Alshurideh (2010). Nevertheless, this study used a set of new happiness determinants (e.g.
perceived price fairness and perceived service recovery) within the telecommunication industry in one of the promising
industries in the Middle East region. The study importance is clear despite the fact that not only many researches were found
tackling the critical success factors of customer satisfaction and customer loyalty, but also there are only few focused on
customer delight in telecommunication industry, especially in UAE (Yallapragada, 2017). That is because many scholars
such as Patterson (1997) see customer delight as the most effective business indicator that increase customer retention rate.
The next part introduces the literature that discussed each independent variable in more details.
2. Literature review and hypotheses development
2.1 Perceived service value influence on both customer satisfaction and customer delight
Many researchers have investigated the factors affecting customer satisfaction from different angles and a set of other
studies provided empirical studies and frameworks to examine the satisfaction’ determinants (Alshurideh et al., 2012;
Alshurideh, 2014; Ammari et al., 2017; Al-dweeri et al., 2017). However, few studies were conducted to measure the impact
of perceived service value on both customer satisfaction and customer delight. Marketing function is one of the core
functions of any organization these days. Based on that, marketing can be considered as an important function since it has
the most business-to-customer contact dimension. The core of successful marketing strategy and best business practice is
to survey, understand, build, convey, and add value to customer that lead to customer satisfaction (Husnain & Akhtar, 2015).
Service oriented organizations should know the best ways to market their services/products and find the effective ways to
communicate their differential values to customers, in order to deliver their services in a way to satisfy their needs (Tjiptono,
2002). Many scholars such as Nguyen, et al. (2018) claimed that marketing efforts and employees' training had great effects
on customer satisfaction (Nguyen et al., 2018). Some of studies carried out found that service innovativeness, service
reliability, service competitiveness and service consistency had significant impacts on customer satisfaction, whereas factors
like operator’s network/signal coverage, pricing, offering, fulfilment of customer demand, value added service, brand value
and operators’ contribution to society had more significant influence on the level of customer perceived value and
satisfaction. Moreover, Rahman (2014) conducted a study in the telecommunications industry and assumed that customer
satisfaction can be considered as one of the measures and indicators of service innovativeness, service reliability, service
competitiveness, service consistency, signal coverage, reasonable price, quality of offering, customer demand fulfilment;
value added service, brand value and operator’s contribution to society. Moreover, a unique factor that was considered in
Rahman’s study was the operator’s contribution to society and this factor was being considered important because at point

H. Alzoubi et al. /Uncertain Supply Chain Management 8 (2020)
581
of time, the image of the company is also associated with the accumulated benefits or value that the company deliver to the
society level not just to customer level. Based on previous explanation, the proposed relationships between perceived value
and both customer satisfaction and delight can be assumed as:
H1: Perceived service value positively influences customer satisfaction.
H2: Perceived service value positively influences customer delight.
2.2 Perceived service quality influence on customer satisfaction and customer delight
Some researchers such as Obeidat et al. (2012) and Alshurideh et al. (2017) developed a linkage between service quality
and both customer satisfaction and customer loyalty but not that much publications link between perceived service quality
effect on both customer satisfaction and customer delight. Arora and Narula (2018), for example, confirmed the impact of
service quality on customer satisfaction and customer loyalty. In addition, Lai and Nguyen (2017) examined the factors
affecting customer satisfaction and customer loyalty at telecommunications industry. Both scholars found that service
quality, assurance, responsiveness, reliability, empathy and tangibility have some effects on and have positive relationships
with both customer satisfaction and customer loyalty. A study has been conducted by Herington and Weaven (2007) about
how to improve business-to-customer relations when providing high quality online banking services. The study denoted
that providing high quality services to customers and making such customers perceived such quality leads to have high-
satisfied customers, which in turn creates high level of loyalty, and such loyalty brings customers delight and happiness.
This tends to increase the purchase volume per visit and escalate the purchase frequency as well. Accordingly, companies
need to understand in which way the customer will perceive the quality of its products and services (Al-Dmour & Al-
Shraideh, 2008; Castaneda, 2011; Obeidat et al., 2012). Based on previous explanation, the proposed relationships between
perceived service quality and both customer satisfaction and delight can be assumed as:
H3: Perceived service quality positively influences customer satisfaction.
H4: Perceived service quality positively influences customer delight.
2.3 Perceived service recovery influences on customer satisfaction and customer delight
Ampomah (2012) conducted a study in the telecommunications industry in Ghana. The scholar pointed out the fact that the
level of customer satisfaction is affected by five main factors, which includes service quality, price fairness, service
recovery, brand image and customer orientation toward the company and its employees. Form such founding; service
recovery is an important element of customer satisfaction and delight that need to be discussed in details. Maxham (2001)
defined Service failure as “any service-related mishaps or problems (real and/or perceived) that occur during a consumer’s
experience with the firm”. While service recovery is defined by Grönroos (1988) as, “the service provider’s action when
something goes wrong”. It is mentioned in different situations that it is important to give more lights on how service failure
recovery affect customer satisfaction and delight. Duffy et al. (2006) provide an initial study about the relationship between
customer satisfaction and service recovery strategies in retail banks in USA. The scholars addressed hundreds of customers
with respect to their demographical characteristics and levels of satisfaction in addition to using different types of recovery
strategies and service recovery employees. The study found that there are no significant differences in satisfaction and
recovery strategy linked to customers’ gender and age or customer relationship longevity with bank. However, the study
found that customer satisfaction level differs and strongly affected by the type of the recovery strategy used. The study
indicated that the recovery efforts exerted by employees are best to be used toward empathic listening to customers’
problems then fixing their problem better than using apologizing or atonement procedures. Regarding service recovery
influence and customer delight. Not that much studies found linking such terms together. Barnes et al. (2011) declared that
service failure recovery is important and, in most cases, take greater importance from customer perspectives than the
delivered services itself. Buttle and Burton (2002) declared that when service failures happen, the recovery procedures and
process has greater effect on customer loyalty better than the original service provided. Both scholars mentioned that
customers’ perception of fairness occurs when an organization has success recovery strategies and programs. According to
Hart et al. (1990), “a good recovery can turn angry, frustrated customers into loyal ones. It can, in fact, create more goodwill
than if things had gone smoothly in the first place” (Hart et al., 1990, p. 148). Accordingly, service recovery can influence
customers’ emotions and psychological status according to Obeidat et al. (2019). Based on the above explanation, the
proposed relationships between perceived service recovery influence and both customer satisfaction and delight can be
assumed as:
H5: Perceived service recovery positively influences customer satisfaction.
H6: Perceived service recovery positively influences customer delight.
2.4 Perceived service price fairness influences on customer satisfaction and customer delight
A study taken up by Khan and Afsheen (2012) who investigated the factors that influence customer satisfaction in the
telecommunications industry setting declared that satisfaction is shaped by a number of influencers which are which are
customer service, price fairness, sales promotion, coverage, signal strength and promotion. The results indicated that
customers are more concerned with price fairness and signal strength. Signal strength can be referred to one of the service
582
quality technical determinants because customer expects the company to provide both strong signals and wide coverages
(Neupane, 2014). However, perceived service price fairness influences has not taken much interests from scholars and can
be considered one of the service ethical dimensions that need more practical tests (Alshurideh et al., 2017; Alshurideh et
al., 2016; Salloum & Al-Emran, 2018). Some studies (e.g. Romdonny & Rosmadi, 2019) focused on the importance of the
relationship between service quality and price to be part of the factors that lead to customer satisfaction. Keep in mind that
it is not easy for customers to be convinced whether the value taken equal to the price given, simply because customers
always compare the prices charged with similar competitors’ products or services (Ilieska, 2013; Alshurideh, 2016; Salloum
et al., 2018). However, customers became more and more concern about the effectiveness of the marketing mix efforts,
especially for the services and its unique characteristics, which require enhancing the way of communicating with
customers, and updating them with right information in the right time and truthfully (John, 2003). In the service oriented
organizations, it has been confirmed in different situations that price of the service is considered to be one of the main two
elements that affect heavily the customers purchasing decision which are quality and price. Moreover, price, in a way or
another, thought to be a determinant of the service quality (Kaura, et al., 2014). Nevertheless, generally, it can be assumed
that the service price, which should add a perceived value to customer, has an effect on customer satisfaction and customer
loyalty positively (Toncar et al., 2010). To add more, price has a significant impact on customer’s judgment on the service
and customer’s purchase decision, so price structure would be from the main marketing decision that need to be considered
with care while it affects customer satisfaction (Salvador et al., 2006; Alshurideh et al., 2018). Based on the above
explanation, the proposed relationships between perceived services price fairness and both customer satisfaction and delight
can be assumed as:
H6: Perceived service price fairness positively influences customer satisfaction.
H8: Perceived service price fairness positively influences customer delight.
2.5 Customer satisfaction influences customer delight
Torres and Kline (2006) studied how effective management of customer relation can affect customer satisfaction, delight,
and their interrelated antecedents. The study declared that customer delight could be considered one of the better concepts
that can be used to measure customer relationship management even better than customer satisfaction while it tends to
generate positive general feeling about the organization performance especially when such organizations tend to have better
acknowledgments of customer relationship process. Delight found to produce more word-of-moth communications, which
in turn influence loyalty and increase customer loyalty at last. Some scholars pointed out that customer satisfaction, delight
should be planned strategically, and management should offer all possible means to achieve them. In addition, Marketing
mix strategy which be implemented by any organization should first going through customer satisfaction. Which means that
organization should discover the customer needs before they prepare and set their marketing mix strategy. Solimun and
Fernandes (2018) found that marketing mix strategy has a significant impact on customer satisfaction. That means the
marketing mix strategy is an indicator and would be the customer satisfaction determination (Caruana, 2002). Based on the
above explanation, the proposed relationships between customer satisfaction and customer delight can be assumed as:
H9: Customer satisfaction positively influences customer delight.
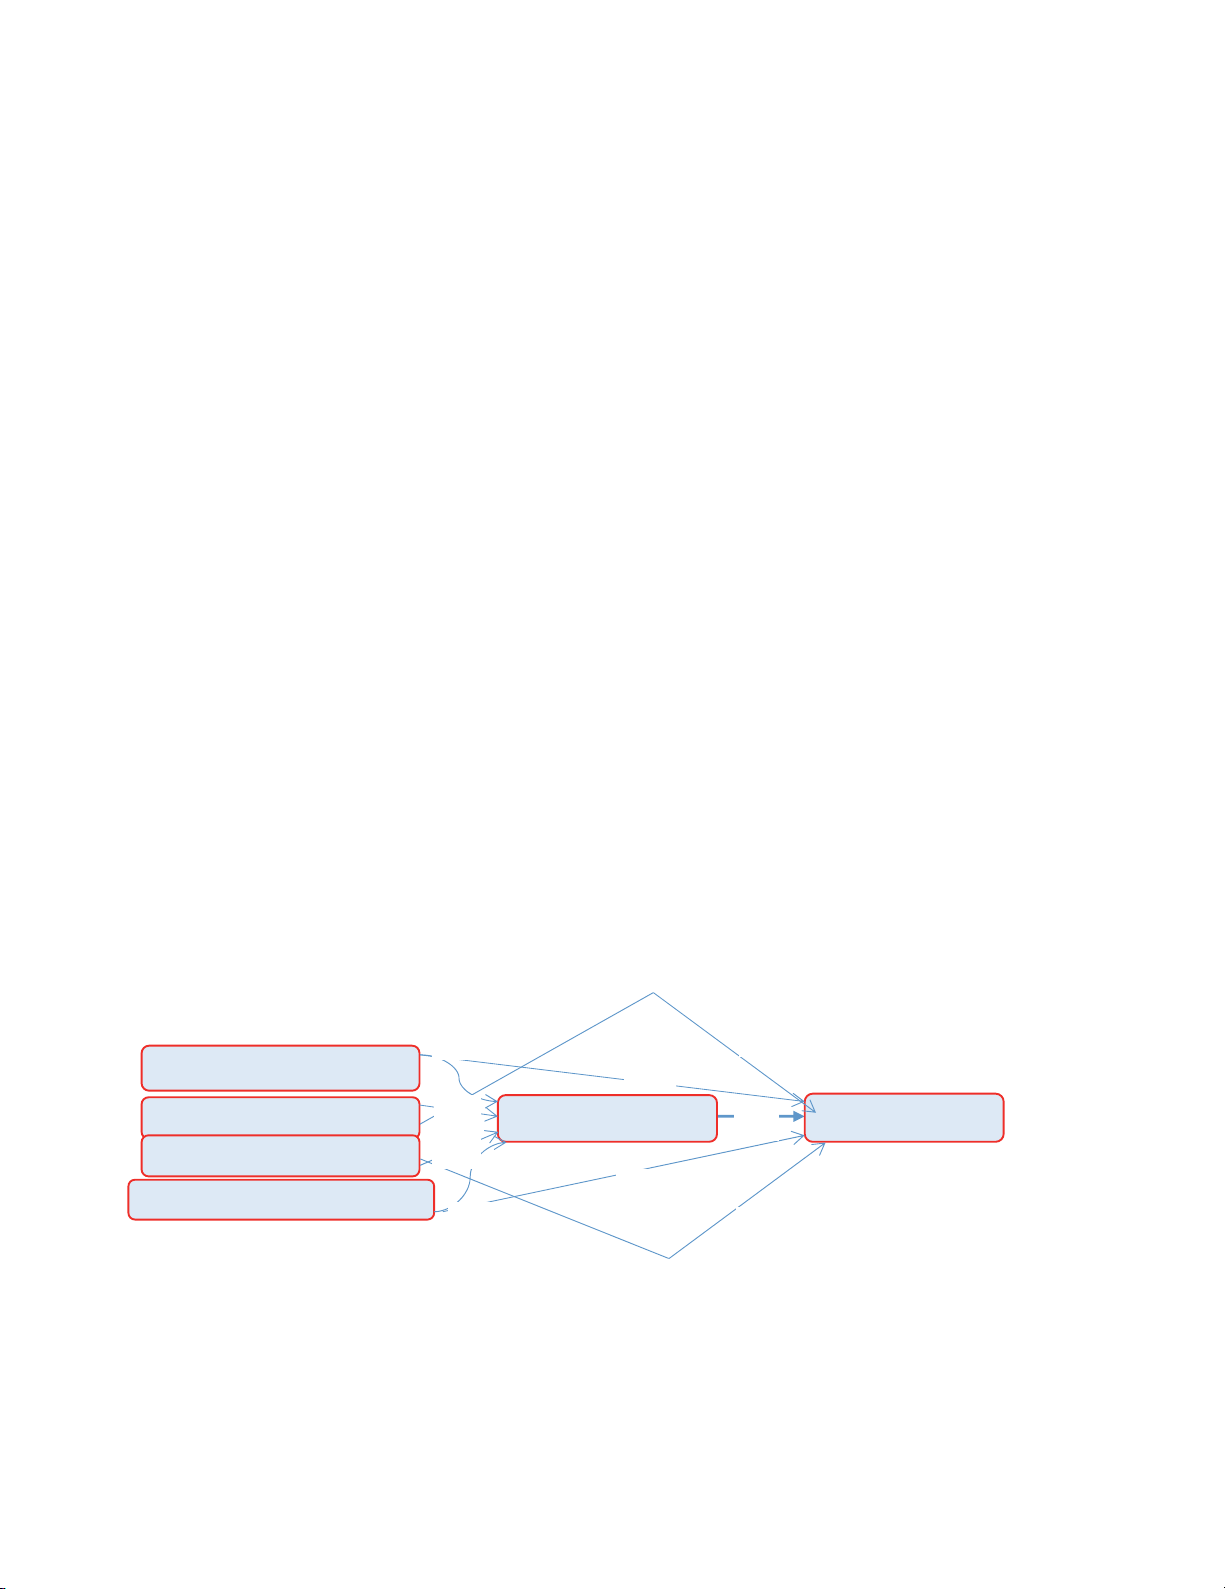
The study model gives a brief view of the proposed relationships between the study factors as seen in Fig.1 as follows,
Fig. 1. The developed study model
3. Methodology
The sample for the study has been selected to be of (420) respondents out of all customers of the all 28 branches of Etisalat
company in Dubai. The sample has been selected randomly based on cluster random sampling technique so that branch of
Etisalat-Dubai has an equal number of represents’ customers being selected in the sample (Brown et al., 2003; Carrillat et
al, 2007). The process of data collection last for one month as of one visit per week peer branch, each visit in different time.
Moreover, all customers of Etisalat visiting the targeted branch had an equal chance of being selected in the sample. A (350)
valid questionnaires were used for the purpose of model analysis and hypotheses testing.
Perceived Service Value
Perceived Service
Q
ualit
y
Perceived Service Recover
y
Perceived Service Price Fairness
Customer Satisfaction Customer Delight
H1
H2
H4
H8
H6
H7
H3
H5
H9

H. Alzoubi et al. /Uncertain Supply Chain Management 8 (2020)
583
Table 1
Descriptive analysis for factors affecting customer satisfaction and customer loyalty
Study variables Rank Mean Std.
Perceived Service Value 6 2.48 .891
Perceived Service Qualit
y
2 2.91 .967
Perceived Service Recovery 5 2.54 .883
Perceived Price Fairness 1 3.01 .923
Customer Satisfaction 4 2.63 .945
Customer Delight 3 2.78 .962
Table 1 shows the descriptive analysis that rank the importance of study variables. Respondents’ perceptions indicate the
importance and rank given toward study variables. The “Perceived Service Price” got the highest importance rank with
mean (3.01) and Std. (0.923), followed by “Perceived Service Quality” with mean of (2.91) and Std. of (0.967). After that
comes, “Customer Satisfaction and Customer delight” with means of (2.63: 2.78) and Std(s) of (0.954: 0.962) respectively.
The last two variables in importance rank are “Perceived Service Recovery and Perceived Service Value” with means of
(2.48: 2.54) and Std(s) of (0.891: 0.883) respectively. The factor analysis CFA/MSE have been used to assess the construct
validity of the measurement’s study, as it shows the extent to which a set of measured items actually reflect the theoretical
latent construct in which they are designed to measure as leaded by Al Kurdi (2016); S A Salloum & Shaalan, 2018; Salloum
et al. 2019; and Alshurideh et al. (2019). Table 2 shows results of measurement model Convergent validity. It shows and
combine the values of the factor loading, and Composite reliability (CR) with Average Variance Extracted (AVE), and all
values of the study model are significant.
Table 2
Model Convergent validity
Constructs Items Loading CR AVE
Perceived Price Fairness (PPF)
PPF1 0.912
0.937 0.832
PPF2 0.909
PPF3 0.914
Perceived Service Quality (PSQ)
PSQ1 0.875
0.905 0.761
PSQ2 0.906
PSQ3 0.835
Perceived Service Recovery (PSR)
PSR1 0.913
0.911 0.774
PSR2 0.854
PSR3 0.871
Perceived Service Value(PSV)
PSV1 0.901
0.905 0.760
PSV2 0.852
PSV3 0.861
Customer Satisfaction(CS)
SC1 0.905
0.904 0.759
SC2 0.830
SC3 0.877
Customer delight (CD)
CD1 0.889
0.921 0.795
CD2 0.881
CD3 0.904
All AVE values of the latent variable are higher than the squared correlation between the latent variable and all other
variables which means that our latent variable explain better the variance of their own indicators than the variance of other
latent variables, so the study model is valid (Chin, 2010; Alshurideh. 2019).
Table 3
Latent Variable Correlation
PPF PSQ PSR PSV CS CD
PPF 0.892
PSQ 0.862 0.871
PSR 0.737 0.830 0.872
PSV 0.810 0.848 0.871 0.872
CS 0.704 0.814 0.812 0.865 0.912
CD 0.776 0.822 0.836 0.844 0.804 0.880
Boldface values are Variable correlation- Root square of AVE
Table 3 shows the Correlation Cross loading is the loading of an indicator on its assigned latent variable and should be
higher than its loadings on all other latent variables. It shows that load more strongly on their own constructs in the model,
which indicates a positive and strong relationship between the study variables.
3. Hypothesis Testing and Discussion
Based on the results obtained from the respondents for the study variables. Correlation, Regression and ANOVA analysis
used to test the hypotheses. Table 4 and 5 illustrate a positive relationship between perceived service value (PSV) on both
customer satisfaction (CS) and customer delight (CD), indicated by (r=0.604 and r=608), respectively.