
VNU Journal of Science: Natural Sciences and Technology, Vol. 40, No. 3 (2024) 82-89
82
Original Article
ZnCo2O4 and the Role of K2CO3 for Highly Advanced
Oxidation over Methylene Blue Degradation
Do Huy Hoang, Trieu Thi Nguyet*
VNU University of Science, 19 Le Thanh Tong, Hoan Kiem, Hanoi, Vietnam
Received 07th May 2024
Revised 16th May 2024; Accepted 31st May 2024
Abstract: ZnCo2O4 spinel nanomaterial modified in the glass phase of K2CO3 demonstrated the
highly advanced oxidation in the mild condition of no light and low temperatures (5 oC) to degrade
the pollutant model of methylene blue up to the yield of ~95% (25 oC) and ~ 51% (5 oC) with a
molar ratio of Zn:Co:K = 1:2:1. As-products from degrading the solution of methylene blue
expressed no signal for the Uv zone in Uv-vis absorption spectra as the signature for aromatic
bones which is the superiority of the material for converting methylene blue to non-aromatic
compounds, even to CO2. ZnCo2O4 was prepared through the co-precipitation of bi-metallic
hydroxide and then calcination with the presence of K2CO3. By XRD, EDX, SEM, and BET, it
was confirmed that the product contains only one phase of cubic spinel nanocrystals with a
relatively large size and a small surface area, in which the molar ratio of metals in the product is
almost the same with the initial mixture.
Keywords: ZnCo2O4 /K2CO3, methylene blue, highly advanced oxidation, without light.
1. Introduction *
The materials with a spinel structure have
gotten some attention for their resistance to
oxidizing/reducing agents and their application
in many fields such as pigments, refractory,
electronic engineering, magnetism, and energy
storage materials. Spinel structures with Zn
element may be a good photo-catalytic direction
such as ZnFe2O4, ZnCr2O4, ZnCo2O4,... [1] with
a belief on photocatalytic enhance through ion
Zn2+ for the pollution treatment under visible
_______
* Corresponding author.
E-mail address: nguyetdhkhtn@gmail.com
https://doi.org/10.25073/2588-1140/vnunst.5674
light. However, the requirements of light
exposure for photo-degradation over solid
catalysts, in general, can sometimes be a
drawback for industrial application of water
treatment due to the limitation of sun shining time
or the energy to produce the UV or visible light.
The combination of Zinc with multiple-
oxidation-state elements from group VIIb in the
periodic table of elements may be an advanced
choice through the Fenton-like reactions.
ZnCo2O4 is synthesized by various methods,
such as hydrothermal [2-4], co-precipitation
[5, 6], and co-precipitation combined with
doping of other metal ions [7-10]. The
application possibilities of ZCO material are

D. H. Hoang, T. T. Nguyet / VNU Journal of Science: Natural Sciences and Technology, Vol. 40, No. 3 (2024) 82-89
83
abundant, such as for energy storage [11, 12],
ciprofloxacin treatment in the presence of
persulfate under microwave conditions [3],
and photocatalytic ability to treat dyes like
methylene blue (MB) in aqueous solution under
normal light conditions [4, 5, 13, 14]. The
published reports on the photocatalytic ability
of nano spinel ZnCo2O4 showed that this
material adsorbs a small amount of pollutants in
the dark. The catalytic ability of the material is
quite strong in both visible and UV light, which
is entirely consistent with the small band gap
energy value (~2.1 eV) of ZnCo2O4 [1]. Doped
ZnCo2O4 materials were mentioned to introduce
metal ions with sizes similar to Zn2+ or Co3+
into the crystal lattice.
Table 1. The various preparations and applications of ZnCo2O4
No
Preparation
Application/yield
Ref.
1
Hydrothermal
MB photodegradation/sunlight with ultrasound,
180 min, 91%
[1]
2
Hydrothermal
coprecipitation/modified with ZrO2
2-chlorophenol, adsorption of 14% in the dark,
photodegradation/ visible light, 91%
[4]
3
Co-precipitation
MB photodegradation/visible light,
[5]
4
Co-precipitation/modified with
MnO2/FeS2
Methyl orange photodegradation/visible light,
80 min/ 96%
[7]
5
Co-precipitation/modified with
CaFe2O4
Tetracycline photodegradation/visible light,
100 min, 88%
[8]
6
Co-precipitation/modified with
Ag@AgCl
rhodamine B (RhB) photodegradation/visible
light, 120 min, 99%
[9]
7
Sacrificial template accelerated
(STAH) method
MB photodegradation/visible light, 210 min, 96%
[13]
9
Co-precipitation modifying with
K2CO3
MB degradation, no light, 60 min, ~94%
This
work
j
This strategic improvement of the material's
properties through modifying the surface is a
key focus of our research, as it can enhance the
performance of ZnCo2O4 in various
applications. In this work, we address the
influence of using K2CO3 in the synthesis
process to promote the catalytic ability of
ZnCo2O4 nanomaterials with two purposes.
Firstly, using the melting alkaline K2CO3
(melting point at 891 oC) is to improve the solid
reaction between ZnO and CoO in the air.
Secondly, the glassy state of K2CO3 after
cooling down might respond to separating the
small crystal of ZnCo2O4 as a solid surfactant.
The photocatalytic results interestingly had no
superiority to the highly advanced oxidation
under no light conditions, at cold temperatures
(5 oC), which is the novelty of our research.
2. Experiment
Zn(NO3)2·6H2O (Sigma-Aldrich, 99%),
Co(NO3)2·6H2O (Sigma-Aldrich, 98%), KOH
(Sigma-Aldrich, 85%), K2CO3 (Korea, 99%.),
Methylene Blue hydrate C16H18ClN3S·xH2O
(Sigma-Aldrich, 97%).
2.1. Material Preparation
Take an amount of Zn(NO3)2·6H2O and
Co(NO3)2·6H2O in a molar ratio of 1:2, transfer

D. H. Hoang, T. T. Nguyet / VNU Journal of Science: Natural Sciences and Technology, Vol. 40, No. 3 (2024) 82-89
84
it to a glass cup, and add distilled water to
dissolve the crystals. Slowly add the resulting
solution into another glass cup containing hot
water, and stir until the solution boils gently for
about 5 minutes. Let the solution cool to room
temperature, then slowly add enough 5% KOH
solution to precipitate the hydroxide of the
metal ions into the beaker. Continue stirring the
reaction mixture for about 30 minutes. Filter the
precipitate on an air suction filter and wash it
several times with distilled water until the
washing water has pH=7. Dry the precipitate at
room temperature in a vacuum oven.
Take a quantity of K2CO3 crystals mixed
with the solid obtained above and grind with a
mortar and pestle, then ignite at 1000 oC for 4
hours. Allow the solid to cool gradually in the
furnace to room temperature. Grind the product
to obtain ZCO material.
The structure and crystalline composition of
the material were studied by powder X-ray
diffraction (XRD) on a D8 X-ray diffraction
device (Burcker, Germany) using CuKα
radiation (λ = 1.54056 Å) at the Department of
Inorganic Chemistry, Faculty of Chemistry,
University of Natural Sciences.
The morphology and grain size of the
material samples were studied based on
scanning electron microscope (SEM) images on
a Nova NanoSEM 450 (FEI, Netherlands) at the
Center for Materials Science, Department of
Physics, University of Science.
The material's element component was
determined based on the energy dispersive
X-ray spectroscopy (EDX) method on the
TEAM Apollo XL EDS machine (EdAx, USA)
at the Center for Materials Science, Department
of Physics, University of Science.
The surface area of the material was studied
using a nitrogen isothermal adsorption-
desorption (BET) on Tristar II 3020 3.02,
(Micromeritics, USA), Institute for Tropical
Technology.
2.2. Decomposition of Methylene Blue
Add 100 mg of material into 100 mL of MB
solution with a concentration of 10 ppm and stir
on a magnetic stirrer. After each specified
period, the amount of solution used to
determine the MB concentration is taken. The
MB concentration in the solution was
determined by measuring optical absorbance on
an ultraviolet-visible molecular absorption
spectrometer V-630 (Jasco, Japan). Deuterium
lamps and halogen lamps were the light sources
used with a silicon photodiode detector and a
1 cm thick quartz cuvette. MB decomposition
yield (H%) was calculated according to the
following formula:
C0 and Ct are the concentration (mg.L-1) of
MB in the solution at the initial time and time t,
respectively. The determination was performed
at the Department of Inorganic Chemistry,
Faculty of Chemistry, University of Sciences.
3. Result and Discussion
3.1. Materials Preparation
In the first step of materials synthesis, a
mixed solution of Zn2+ and Co2+ salts with a
molar ratio corresponding to the composition of
spinel ZnCo2O4 was added to hot water so that
the hydrolysis of cations occurred faster, then
slowly add KOH solution to precipitate the
metal hydroxides. The amount of KOH needed
is just enough to avoid dissolving zinc
hydroxide. This stage dramatically affects the
crystal size [1]. The calcination process
occurred at high temperatures in air, so Co2+
was oxidized to Co3+. Adding K2CO3 into the
solid before calcination increased the possibility
of creating a spinel phase because K2CO3 was
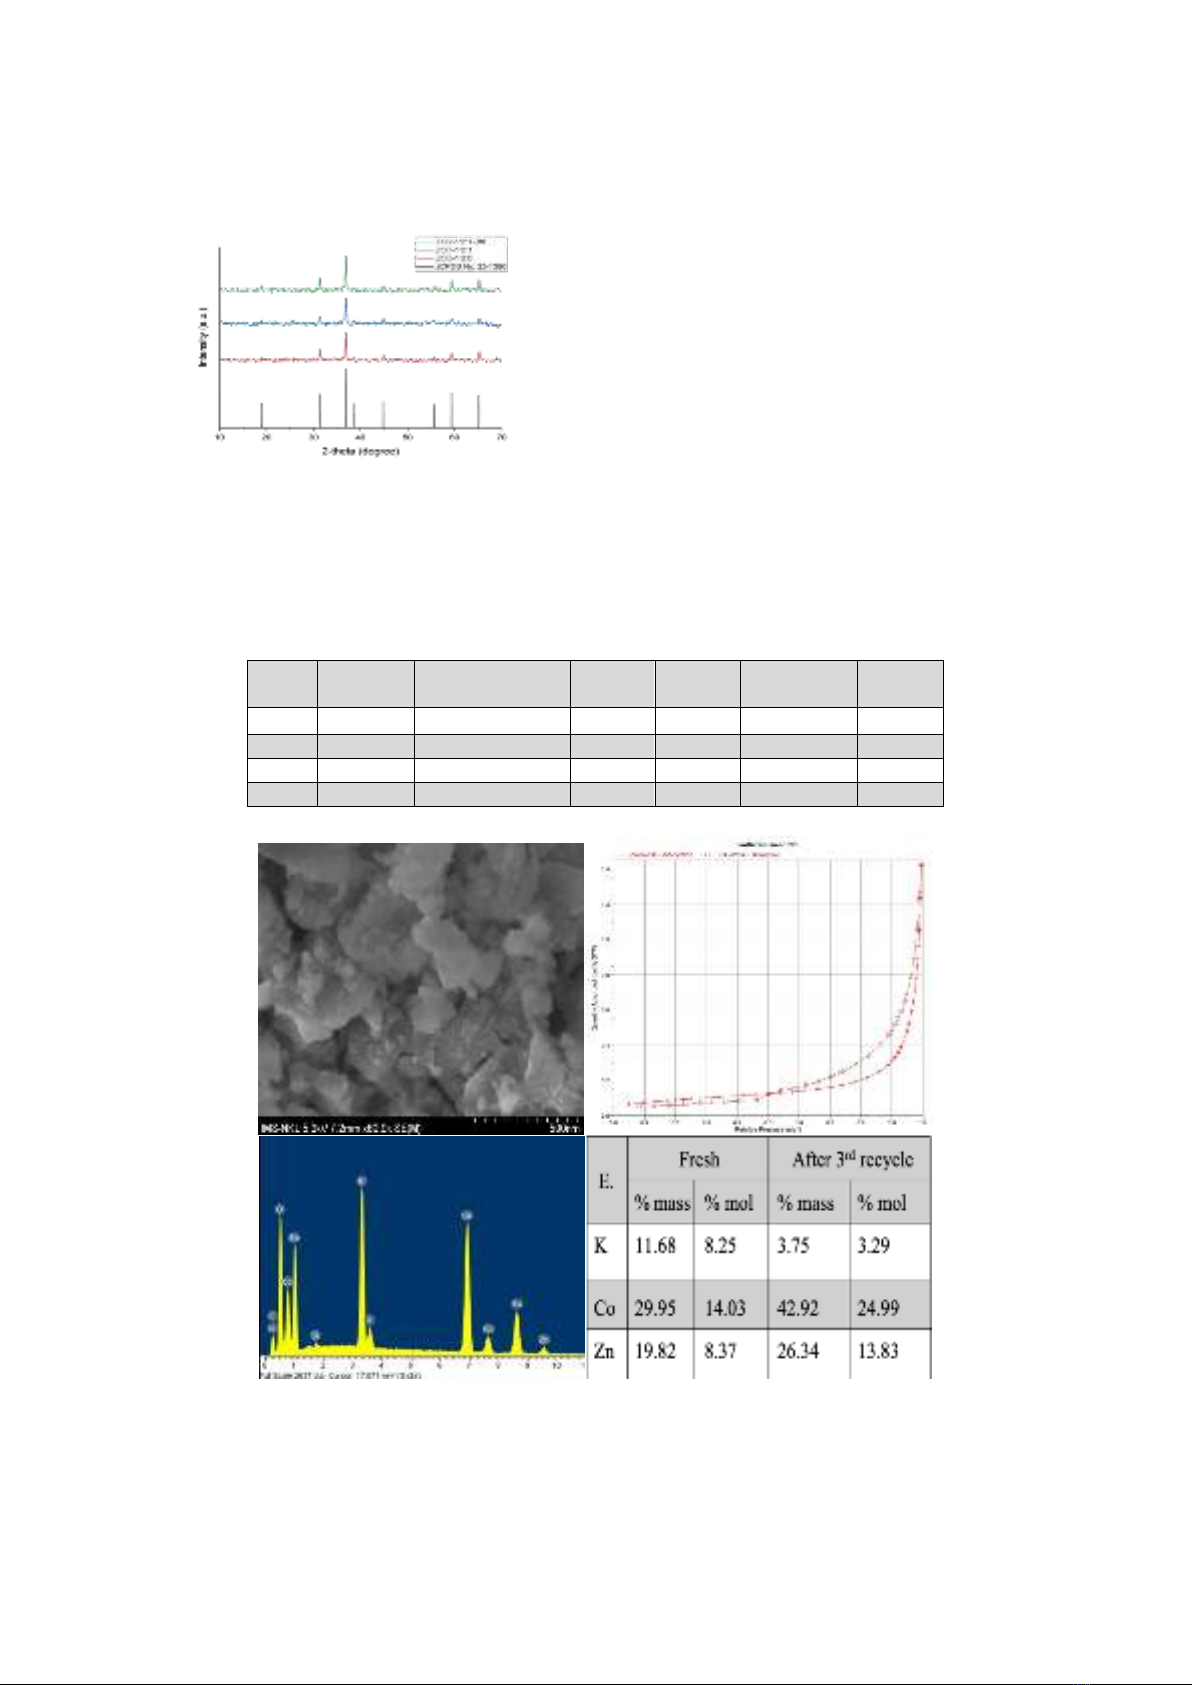
considered a liquid alkaline. In Figure 1, peaks
of the X-ray diffraction at (220); (311); (222);
(400); (422); (511); and (440) are in perfect
agreement with the cubic structure of spinel
ZnCo2O4 according to the data of JCPDS No
23-1390 [1].
D. H. Hoang, T. T. Nguyet / VNU Journal of Science: Natural Sciences and Technology, Vol. 40, No. 3 (2024) 82-89
85
Figure 1. X-ray diffraction pattern of ZnCo2O4
with different starting molar ratios of Zn:Co:K
and the 3rd recycled one.
The diffraction pattern showed that the
obtained material had only one crystalline
phase, ZnCo2O4, with a cubic structure and a
crystal size of ~40 nm. Changing the amount of
K2CO3 during synthesis has little effect on the
lattice constant and crystal size (Table 2). K+
may not enter the spinel lattice because the size
of this cation is much larger than that of the
metal cations Zn2+ and Co3+.
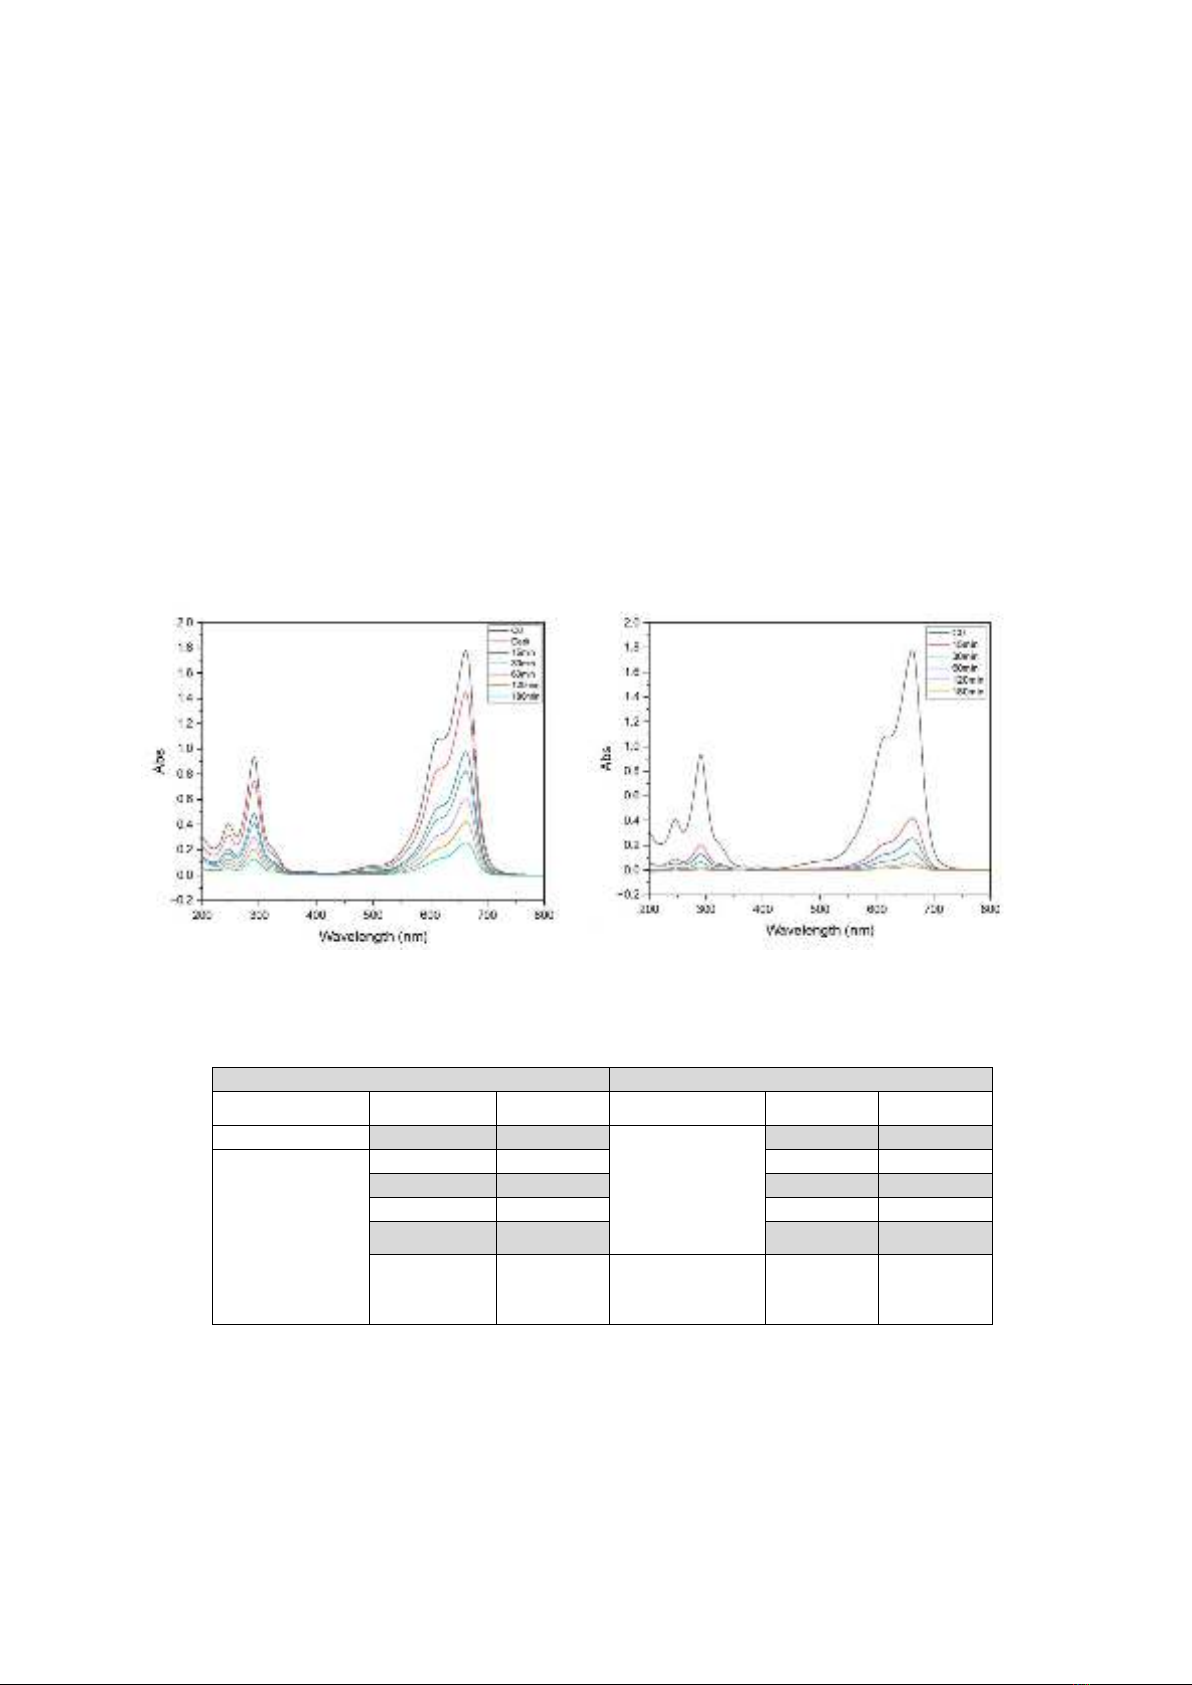
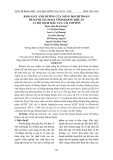
SEM image (Figure 2) shows that the
particle size is relatively large and uneven due
to the accumulation of ZnCo2O4 crystals. The
EDX spectrum of ZCO1 (Figure 2) shows that
the elements Zn, Co, and K are present in the
material's composition, with the molar ratio
Zn:Co:K = 1:1.7:1, almost similar to the molar
ratio of the starting substances.
Table 2. Lattice constants and crystalline size of ZCO
No.
Sample
Initial molar
ratio Zn:Co:K
2θ
FWHM
a=b=c (Å)
r (nm)
1
ZCO0
1:2:0
36.856
0.190
8.081
44.0
2
ZCO0.2
1:2:0.2
36.828
0.204
8.086
41.1
3
ZCO0.4
1:2:0.4
36.850
0.204
8.059
41.0
4
ZCO1
1:2:1
36.875
0.243
8.040
34.5
P
Figure 2. SEM, BET, and EDX spectrum of ZCO1.
D. H. Hoang, T. T. Nguyet / VNU Journal of Science: Natural Sciences and Technology, Vol. 40, No. 3 (2024) 82-89
86
At a heating temperature of 1000 oC, K2CO3
melts to form a glassy state where ZnCo2O4
crystals are dispersed in a glass phase to form
the more complicated structure of material. The
EDX expresses the larger ratio of carbon to
potassium which may be explained by the
absorption of CO2 from the air or the intrusion
of K+ into ZnCo2O4 crystals.
The surface area of the material determined
by BET is relatively small, equal to 0.325 m2/g.
The above data shows that the synthesized
material is ZnCo2O4 nano spinel dispersed in
amorphous K2CO3 with large particle size and
small surface area.
3.2. Methylene Blue Degradation
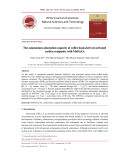
The UV-Vis spectra of MB solution after
different periods exposing ZCO0 without
K2CO3 and ZCO1 with K2CO3 are given in
Figure 3 and Table 3.
The results showed that ZCO0 without
K2CO3 has weak MB adsorption and
photocatalytic decomposition of MB under
normal light conditions, as the same data with
the reference [8] showed. Excitingly, the ZCO1
without K2CO3 decolorizes MB with a very
high yield, regardless of the light source, and
with a fast decoloration rate.
D
Figure 3. The UV-Vis spectrum of MB solution over time in the presence of ZCO0 without
K2CO3 in darkness and normal light (left) and ZCO1 with K2CO3 in darkness (right).
Table 3. Decoloration of MB over time in the presence of ZCO material
ZCO0 without K+
ZCO1 with K+
Light condition
Time (min)
Yield (%)
Light condition
Time (min)
Yield (%)
Dark
30
11.3
Dark
15
80.6
Normal light
15
45.1
30
87.2
30
53.6
60
93.8
60
64.9
120
96.1
120
76.2
180
97.3
180
85.5
With light
(normal light,
UV, infrared)
120
95-97
H
The UV-vis spectrum in Figure 3 of the MB
solution after the catalytic process with ZCO
material shows a significant reduction of all
adsorption peaks at 664 nm, 613 nm in the visible
region, and 246 nm, 292 nm in the UV region.
The adsorption peaks in the visible
region corresponding to the n-π* transition of the
MB molecule. In contrast, the adsorption peaks in


![Ô nhiễm không khí từ nông nghiệp: Thách thức toàn cầu và định hướng hành động [Mới nhất]](https://cdn.tailieu.vn/images/document/thumbnail/2025/20250917/kimphuong1001/135x160/52891758099584.jpg)