Effect of ecdysone receptor gene switch ligands on endogenous gene expression in 293 cells Siva K. Panguluri1, Bing Li2*, Robert E. Hormann2 and Subba R. Palli1
1 Department of Entomology, College of Agriculture, University of Kentucky, Lexington, KY, USA 2 Intrexon Corporation, Norristown, PA, USA
Keywords diacylhydrazine; ecdysone; gene therapy; microarray; RSL-1
Correspondence S. R. Palli, Department of Entomology, College of Agriculture, University of Kentucky, Lexington, KY 40546 USA Fax: +1 859 323 1120 Tel: +1 859 257 4962 E-mail: rpalli@uky.edu
*Present address MicroBiotiX, Inc., Worcester, MA, USA
(Received 24 June 2007, revised 13 August 2007, accepted 4 September 2007)
doi:10.1111/j.1742-4658.2007.06089.x
Regulated gene expression may substantially enhance gene therapy. Corre- lated with structural differences between insect ecdysteroids and mamma- lian steroids, the ecdysteroids appear to have a benign pharmacology without adversely interfering with mammalian signaling systems. Conse- quently, the ecdysone receptor-based gene switches are attractive for appli- cation in medicine. In the present study, the effect of inducers of ecdysone receptor switches on the expression of endogenous genes in HEK 293 cells was determined. Four ligand chemotypes, represented by a tetrahydroquin- two ecdysteroids oline (RG-120499), one amidoketone (RG-121150), [20-hydroxyecdysone (20E) and ponasterone A (Pon A)], and four diacyl- hydrazines (RG-102240, RG-102277, RG-102398 and RG-100864), were tested in HEK 293 cells. The cells were exposed to ligands at concentra- tions of 1 lm (RG-120499) or 10 lm (all others) for 72 h and the total RNA was isolated and analyzed using microarrays. Microarray data showed that the tetrahydroquinoline ligand, RG-120499 caused cell death at concentrations ‡ 10 lm. At 1 lm, this ligand caused changes in the expression of genes such as TNF, MAF, Rab and Reprimo. At 10 lm, the amidoketone, RG-121150, induced changes in the expression of genes such as v-jun, FBJ and EGR, but was otherwise noninterfering. Of the two ste- roids tested, 20E did not affect gene expression, but Pon A caused some changes in the expression of endogenous genes. At lower concentrations intrinsic gene expression for gene therapy, pharmacologically relevant effects of ecdysteroids and amidoketones may actually be insignificant. A fortiori, even at 10 lm, the four diacylhydrazine ligands did not cause significant changes in expression of endogenous genes in 293 cells and therefore should have minimum pleiotropic effects when used as ligands for the ecdysone receptor gene switch.
Gene therapy is used to correct a defect in the expres- sion of a gene by transferring a gene expression cas- sette containing a promoter, a terminator, and the coding region of a gene whose absence or defect causes a disease. Current technology uses constitutive promot- ers, such as the cytomegalovirus promoter, for expres- sion of transgenes. Such an ‘always on’ arrangement is
not desirable because it can exacerbate pleiotropic effects and also leaves no option for remediation in the event of medical complications due to transgene expression. To address this issue, regulated expression of the additive or corrective gene becomes attractive for various gene therapy applications. Despite extra regulated expression system can complexity,
the
Abbreviations AMK, amidoketone; qRT-PCR, quantitative real-time reverse transcription PCR; STAT 6, signal transducer and activator of transcription 6; THQ, tetrahydroquinoline.
FEBS Journal 274 (2007) 5669–5689 ª 2007 The Authors Journal compilation ª 2007 FEBS
5669
S. K. Panguluri et al.
Ecdysone receptor gene switch ligands
substantially raise the level of safety and might even be essential to control the expression levels of proteins that have narrow therapeutic indices, such as cyto- kinins and hormones.
The relative structural dissimilarity of ecdysteroids and mammalian steroids might suggest that binding of the former to vertebrate steroid receptors would be too weak for pharmacological effects, particularly adverse ones. In support of this proposition, humans consume significant amounts of phytoecdysteroids contained in dietary vegetables seemingly without any apparent detrimental effects [11]. However, Oehme et al. [12] ecdysteroids and ecdysone reported recently that mimics can induce and ⁄ or suppress endogenous genes in RKO and other mammalian cells and promote apoptosis.
The main purpose of a regulated gene expression system is to control the timing and levels of transgene expression in vivo. Whether the expressed protein remains within the cell or, more commonly, is secreted it and ⁄ or distributed in extracellular compartments, will undergo elimination according to pharmacokinetc principles [1]. Thus, too little protein will be subthera- peutic, too much will be potentially toxic. Therefore, a successful therapy would be characterized by regulated expression of the transgene finely tuned to the chang- ing clinical state of a patient.
ecdysone
receptor
Several gene switches have been developed for regu- transgenes in humans [2]. lating the expression of More (EcR) gene specifically, switches for medicinal purposes have been reported by several laboratories [3–9]. Among these switches, EcR- based gene switches display particularly low basal activity in the absence of an inducer and strong induc- ible activity in the presence of an inducer [2,8,10].
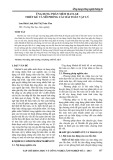
A more comprehensive understanding of possible pleiotropic effects of ligand inducers and ⁄ or the switch components is essential for successful use of the EcR gene switch for in vivo applications such as gene ther- apy. The diacylhydrazine [13,14] nonsteroidal ecdysone agonists, such as Rheoswitch ligand 1 (RSL-1; Fig. 1), are reported to be an excellent inducer for EcR gene switches, supporting up to 9000-fold induction of reporter activity [15]. Other steroidal ligands, such as also been ponasterone A (Pon A; Fig. 1), have inducers of EcR-based gene reported as potential
OH
OH
O
H
R
N
O
N H
HO
R1
R2
H
OH
HO
H
O
Diacylhydrazines (DAH)
Ecdysteroids (ECD)
R2=H
RG-100864 R1=Cl RG-102398 R1=2-CH3, 3-OCH3
20-hydroxyecdysone ponasterone
R = OH R = H
R2=3,5-di-CH3
RG-102240 R1=2-CH2CH3, 3-OCH3
R2=3,5-di-CH3
RG-102277 R1=2-CH2CH3, 3-OCH3 R2=3-CH3, 5-C(O)NH2
F
O
HN
O
F
N H
O
N
O
F
O
Amidoketone (AMK) RG-121150
Tetrahydroquinoline (THQ) RG-120499
Fig. 1. EcR ligands analyzed by microarray and qRT-PCR analysis.
FEBS Journal 274 (2007) 5669–5689 ª 2007 The Authors Journal compilation ª 2007 FEBS
5670
S. K. Panguluri et al.
Ecdysone receptor gene switch ligands
because this method showed a ten-fold up-regulation of this gene in the presence of RG-102499. MAF [v-maf musculoaponeurotic
switches [8,14]. In addition, other chemotypes, such as amidoketones (AMK) and tetrahydroquinolines (THQ), are also being developed as inducers of EcR gene switches [16–20] (Fig. 1).
v-maf gene
The main goal of the present study was to determine the intrinsic gene expression effects of EcR switch in- ducers in mammalian cells. We studied the effect of eight EcR ligands: four diacylhydrazines, two ecdyster- oids, one THQ and one AMK ligand (Fig. 1) on the expression of endogenous genes in HEK 293 cells using microarray and quantitative real-time reverse transcription PCR (qRT-PCR). THQ ligand caused changes in the expression of genes such as TNF, MAF, Rab and Reprimo. The AMK ligand induced changes in the expression of genes such as v-jun, FBJ and EGR. 20-Hydroxyecdysone (20E) did not affect gene expression, but Pon A caused some changes in the expression of endogenous genes. At lower ligand con- centrations applicable for therapeutic use, potential pleiotropic effects may or may not be observed. The four diacylhydrazine ligands did not cause significant changes in the expression of endogenous genes.
Results and Discussion
THQ ligand, RG-120499, affects 293 cells via many pathways
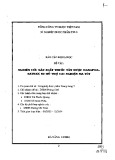
fibrosarcoma oncogene homolog (avian)] is a basic-leucine zipper transcription factor that plays crucial roles in gene reg- ulation, differentiation, oncogenesis and development in many organisms [21]. v-maf is a viral oncogene encoding a leucine zipper motif that forms heterodi- mers with the protein products of maf-related genes or other proteins such as fos, jun and myc oncogenes that have leucine zipper motifs [22]. Our microarray and qRT-PCR data showed that, in 293 cells, RG-120499 expression by 2.4- and up-regulates 2.3-fold, respectively. Nishizawa et al. [22] have dem- onstrated that the human cellular counterpart of the v-maf (c-maf) gene is conserved across species. Addi- tionally, Massrieh et al. [21] reported that the MAF transcription factor transcript levels are induced by proinflammatory cytokines in PHM1-31 myometrial cells and that MAF transcription factor mRNA is rapidly induced by IL-1B and TNF in primary myometrial and PHM1-13 cells. Our data also indicate the TNF gene in microarray and up-regulation of qRT-PCR data (by 2.2- and 5.5-fold, respectively), an observation consistent with TNF-induced up-regulation of MAF transcript levels. Zheng et al. [23] reported that the tumor necrosis factor (TNF) can mediate mature T-cell receptor-induced apoptosis through the p75 TNF receptor. This may be the possible reason for the death of 293 cells when treated with 10 lm RG-120499 ligand.
showed that
In addition to the aforementioned up-regulated two genes, namely, Rab and Reprimo, were genes, down-regulated by this THQ ligand in 293 cells, as observed by both microarray and qRT-PCR tech- niques. The Rab proteins constitute a subfamily of Ras-related GTP-binding proteins that are localized in distinct intracellular compartments [24]. Mutations in the Rab gene can alter the morphology of entire organ- elles by blocking protein transport along the exocytic and endocytic pathways because Rab proteins plays a key role in membrane trafficking [25]. Barbosa et al. [26] reported that mutations in the Rab gene(s) can cause irregularities in the protein transport machinery leading to the formation of giant lysosomes in mouse beige (bg) mutant and other mutant mice. It has been syndrome, a rare suggested that Chediak–Higashi autosomal recessive disorder in humans, is the conse- quence of a mutation to a homolog of bg. Our micro- array and qRT-PCR data indicate that the rab gene was down-regulated in 293 cells by two- and 23-fold, respec- tively, by the THQ, RG-120499. Mutation studies of the Rab gene suggest that the Rab gene down-regulation by
Incubation of 293 cells with the THQ compound RG- 120499 at 10 lm for 3 days resulted in the death of 70% of the cells as indicated by observation of cell morphology. To determine the possible genes and path- ways that are affected by this ligand, we performed a microarray experiment using RNA isolated from 293 cells treated with 1 lm RG-120499. A total of 1171 genes were up-regulated and 443 genes were down- regulated in 293 cells treated with this compound compared to the cells treated with dimethylsulfoxide (Fig. 2A). Among these, 115 genes showed P £ 0.01 with a two-fold or more greater in expression levels in ligand-treated cells compared to the levels in dimethyl- sulfoxide-treated cells (Table 1). Among these 115 genes, 55 genes showed signal detection values of more than 100. We selected v-maf, TNF, PNAS13, Rab, Rep- rimo, DNAH and KIF9 genes for qRT-PCR. The qRT- v-maf, TNF, PCR data (Fig. 2B,C) PNAS13 and DNAH mRNA levels increased, and Rab and Reprimo mRNA levels decreased in RG-120499 treated cells, compared to the levels in dimethylsulfox- ide-treated cells. The microarray and qRT-PCR data showed perfect correlation for these six genes. The two- fold down-regulation of the KIF9 gene observed in microarray analyses was not confirmed by qRT-PCR
FEBS Journal 274 (2007) 5669–5689 ª 2007 The Authors Journal compilation ª 2007 FEBS
5671
S. K. Panguluri et al.
Ecdysone receptor gene switch ligands
A
5 0 - E 1
l
4 0 - E 1
3 0 - E 1
2 0 - E 1
i
) e u a v - p t s e t t ( e c n a c i f i n g S
1 0 - E 1
0 0 - E 1
2.7
x4 x8 x16 /16 /8 /4 /2 /1.5 1 x1.5 Fold Suppression/Induction
B
C
2.3
i
l
s e u a V
-2
i
l a n g S
2.4
l
5.5
2.2
-2
5.1
-2
-23
10
4.3
-2
23
n o s s e r p x E e v i t a e R
5000 4500 4000 3500 3000 2500 2000 1500 1000 500 0
Q H T
Q H T
Q H T
Q H T
Q H T
Q H T
Q H T
Q H T
Q H T
Q H T
Q H T
Q H T
Q H T
Q H T
O S M D
O S M D
O S M D
O S M D
O S M D
O S M D
O S M D
O S M D
O S M D
O S M D
O S M D
O S M D
O S M D
O S M D
KIF
v-Maf
KIF
v-Maf
TNF
PNAS RAB Reprimo DNAH
TNF
PNAS
RAB Reprimo DNAH
Fig. 2. The THQ ligand RG-120499 affects 293 cells via many pathways. (A) The V-plot of differentially expressed genes from microarray data. The P-values of t-test are plotted against fold suppression or induction. The horizontal bar in the plot represents the nominal significant level 0.001 for the t-test under the assumption that each gene has a unique variance. The vertical bars represent the genes that are mini- mum of two-fold up- or down-regulated compared to the control dimethylsulfoxide (DMSO). (B) The signal values of v-maf, TNF, PNAS, Rab, Reprimo, DNAH and KIF9 genes from the microarray. The signal values from the microarray analysis were plotted for each gene are indicated as mean ± SD (n ¼ 3). The numbers above the bar represents the fold changes with this ligand against dimethylsulfoxide. (C) The relative expressions of v-maf, TNF, PNAS, Rab, Reprimo, DNAH and KIF9 gene transcripts in qRT-PCR. The relative expression values from the qRT-PCR analysis were plotted for each gene are indicated as mean ± SD (n ¼ 3). The numbers above the bar represents the fold changes with this ligand against dimethylsulfoxide.
0.025 0.02 0.015 0.01 0.005 0
this ligand may be a reason for cell death in addition to modulation of the v-maf and TNF genes.
growth, differentiation,
Tumor suppressor genes that encode transcriptional factors can affect a variety of cellular mechanisms underlying and apoptosis [27,28]. Also, when cells were exposed to DNA dam- age-inducing agents or other noxious stress, the p53 protein, which is the most commonly mutated gene in human cancer, is induced and ⁄ or activated, resulting in cell cycle arrest or apoptosis [29–31]. Reprimo is a highly glycosylated protein, which will localize in the cytoplasm and induce G2 arrest of the cell cycle when expressed ectopically [32]. In the present study, it was observed that RG-120499 down-regulates the Reprimo gene by two-fold as measured by both microarray and qRT-PCR techniques. From these observations and
previous reports, we suggest that the down-regulation of the Reprimo gene may cause loss of DNA repair, which, in turn, is passed on to the next generations, thereby accumulating DNA defects. RG-120499 modu- lates the expression of other genes as well. The PNAS123 gene (transformation related protein 11) is up-regulated by 2.7- and 4.3-fold as measured by microarray and qRT-PCR, respectively. The pathways in which these genes are involved are not known. RG- 120499 also triggers five- and 23-fold up-regulation of the DNAH (human axonemal dynein heavy chain) gene as measured by microarray and qRT-PCR tech- niques, respectively. DNAH is a microtubule associ- ated motor protein that moves cilia and flagella [33,34]. Afzelius [35,36] showed that patients suffering from Kartagener syndrome have cilia lacking dynein
FEBS Journal 274 (2007) 5669–5689 ª 2007 The Authors Journal compilation ª 2007 FEBS
5672
S. K. Panguluri et al.
Ecdysone receptor gene switch ligands
Table 1. Differentially expressed genes in 293 cells treated with different ligands.
Total genes
Genes with signal values 100 or more
Up-regulated
Down-regulated
Total
Up-regulated
Down-regulated
Total
Ligand
P-value
RG-120499 (THQ)
RG-121150 (AMK)
20E (steroid)
Pon A (steroid)
RG-100864 (halofenozide, diacylhydrazine)
RG-102398 (methoxyfenozide, diacylhydrazine)
RG-102240 (RSL-1, diacylhydrazine)
RG-102277 (diacylhydrazine)
< 0.0001 < 0.001 < 0.01 < 0.0001 < 0.001 < 0.01 < 0.0001 < 0.001 < 0.01 < 0.0001 < 0.001 < 0.01 < 0.0001 < 0.001 < 0.01 < 0.0001 < 0.001 < 0.01 < 0.0001 < 0.001 < 0.01 < 0.0001 < 0.001 < 0.01
1 12 71 0 4 26 0 1 15 0 2 20 0 1 19 0 3 20 0 2 27 0 3 21
0 5 26 1 9 31 0 5 30 1 4 15 0 3 15 0 4 25 1 2 14 0 3 18
1 17 97 1 13 57 0 6 45 1 6 35 0 4 34 0 7 45 1 4 41 0 6 39
1 8 39 0 0 6 0 0 0 0 0 1 0 0 2 0 0 1 0 0 3 0 1 0
0 0 7 1 6 11 0 1 4 0 0 2 0 0 1 0 0 2 1 0 2 0 1 3
1 8 46 1 6 17 0 1 4 0 0 3 0 0 3 0 0 3 1 0 5 0 2 3
infections, altered position of
arms. This disease is characterized by chronic respira- tory tract internal organs, and infertility arising from immotile sperm. Milisav and Affara [37] reported that the human dynein-related gene DNEL2 may play an important role specifically in sperm motility and is not involved in the movement of cilia. In summary, the use of the THQ gene switch ligand RG-120499 may cause signifi- cant changes in the expression of host genes.
(EGR), FBJ, v-jun, and a hypothetical protein gene were designed. For three of the four genes, the micro- array data was confirmed by qRT-PCR. The data showed that the hypothetical protein gene was up-regu- lated by two- and 1.5-fold in microarray and qRT-PCR experiments, respectively. EGR and v-jun showed sup- pression of their expression by the ligand in analyses by both methods (Fig. 3B,C). The gene FBJ mRNA levels were down-regulated in microarray experiments and up- regulated in qRT-PCR experiments.
AMK, RG-121150, affects gene expression in 293 cells
The affect of the AMK RG-121150 on gene expression in 293 cells was analyzed using microarray and qRT- PCR. In microarray analysis, a total of 636 genes were up-regulated and 604 genes were down-regulated by this ligand (Fig. 3A). Among these genes, 71 genes showed P £ 0.01 and a two-fold or greater change in expression (Table 1). Among 71 genes, 24 genes showed signal detection values greater than 100. Among these are hypothetical proteins, nuclear pro- teins, transcriptional factors, glycogen phosphorylase, hormone degrading enzymes, kinases and some solute carrier proteins. To validate microarray data with qRT-PCR, the primers for early growth response gene
The EGR gene product is a transcription factor that plays a role in differentiation and growth. EGR genes are transiently and coordinately induced upon activa- tion of peripheral blood T lymphocytes [38,39]. These EGR genes are also expressed in a wide range of cell types, including lymphoid cells, myeloid cells such as thymocytes, B cells, monocytes, and nonlymphoid cells such as fibroblasts, kidney cells and neurons [40,41]. Huang et al. [42,43] showed that the expression of the EGR gene exogenously in various tumor cells unex- pectedly and markedly reduces growth and tumorige- nicity, whereas the suppression of endogenous EGR by antisense RNA enhances growth and promotes phenotypic transformation. From our microarray and qRT-PCR data, the AMK RG-121150 caused down- regulation of this EGR gene by five- and six-fold,
FEBS Journal 274 (2007) 5669–5689 ª 2007 The Authors Journal compilation ª 2007 FEBS
5673
S. K. Panguluri et al.
Ecdysone receptor gene switch ligands
A
5 0 - E 1
4 0 - E 1
l
3 0 - E 1
2 0 - E 1
i
) e u a v - p t s e t t ( e c n a c i f i n g S
1 0 - E 1
0 0 - E 1
x8 x16 /16 /8 /4 /2 /1.5 1 x1.5 x4 Fold Suppression/Induction
B
C
i
l
s e u a V
i
l a n g S
l
n o s s e r p x E e v i t a e R
18000 16000 14000 12000 10000 8000 6000 4000 2000 0
i
i
i
i
i
i
i
i
o d m A
o d m A
o d m A
o d m A
O S M D
O S M D
O S M D
O S M D
o d m A
o d m A
o d m A
o d m A
e n o t e k
e n o t e k
e n o t e k
e n o t e k
O S M D
O S M D
O S M D
O S M D
0.2500 0.2000 0.1500 0.1000 -6.14 0.0500 -5.4 -9 1.5 3.3 -21 2.05 -58 0.0000
Fig. 3. AMK RG-121150 affects endogene expression in 293 cells. (A) The V-plot of differentially expressed genes from microarray analysis. The P-values of t-test are plotted against fold suppression or induction. The horizontal bar in the plot represents the nominal significant level 0.001 for the t-test under the assumption that each gene has a unique variance. The vertical bars represent the genes that are minimum of two- fold up- or down-regulated compared to the control dimethylsulfoxide (DMSO). (B) The signal values of hypothetical protein, EGR, v-jun and FBJ genes from microarray. The signal values from the microarray analysis were plotted for each gene are indicated as mean ± SD (n ¼ 3). The numbers above the bar represents the fold changes with this ligand against dimethylsulfoxide. (C) The relative expressions of hypothetical protein, EGR, v-jun and FBJ gene transcript levels in qRT-PCR. The relative expression values from the qRT-PCR analysis were plotted for each gene are indicated as mean ± SD (n ¼ 3). The numbers above the bar represents the fold changes with this ligand against dimethylsulfoxide.
Hypo EGR v-jun FBJ Hypo EGR v-jun FBJ
respectively, indicating a possible effect RG-121150 on this pathway. Overall, these studies showed that AMK ligand RG-121150 could cause significant changes in the expression of genes in host cells. However, the cor- responding toxicological potential could be substan- tially mitigated or even erased by the likelihood that actual gene therapy dosage would be significantly lower than the 10 lm studied here. Likewise, judicious choice of the specific member of the AMK chemotype may confer intrinsic benignity.
compared
untreated
treated
cells
to
Ecdysteroid ligand, 20E, shows little effect on 293 cells but Pon A affects cell division
Two steroid ligands Pon A and 20E were tested in 293 cells to determine their effect on gene expression
In 20E-treated using microarray and qRT-PCR. 293 cells, a total of 542 genes were up-regulated and 627 genes were down-regulated compared to dimethyl- sulfoxide-treated cells (Fig. 4A). Out of these, 51 genes showed P £ 0.01 and a change in gene expression of two-fold or greater (Table 1). Among these 51 genes, only five genes had signal detection values greater than 100. We selected signal transducer and activator of transcription 6 (STAT6) genes to perform qRT-PCR analyses. Although the STAT6 gene was down-regu- lated by 20E in microarray analysis, the qRT-PCR analyses showed that the mRNA levels did not change in cells (Fig. 4B,C). Experiments in our laboratory (S. R. Palli, unpublished results) showed that, in mammalian cells, 20E does not induce reporter genes placed under the
FEBS Journal 274 (2007) 5669–5689 ª 2007 The Authors Journal compilation ª 2007 FEBS
5674
S. K. Panguluri et al.
Ecdysone receptor gene switch ligands
A
5 0 - E 1
4 0 - E 1
l
3 0 - E 1
2 0 - E 1
i
) e u a v - p t s e t t ( e c n a c i f i n g S
1 0 - E 1
0 0 - E 1
/16 /8 /4 /2 /1.5 1 x1.5 x4 x8 x16 Fold Suppression/Induction
B
C
i
l
s e u a V
i
l a n g S
l
n o s s e r p x E e v i t a e R
Fig. 4. Steroidal ligand 20E does not have much effect on 293 cells. (A) The V-plot of differentially expressed genes from microarray analy- sis. The P-values of t-test are plotted against fold suppression or induction. The horizontal bar in the plot represents the nominal significant level 0.001 for the t-test under the assumption that each gene has a unique variance. The vertical bars represent the genes that are mini- mum of two-fold up- or down-regulated compared to the control dimethylsulfoxide (DMSO). (B) The signal values of STAT6 gene from micro- array. The signal values from the microarray analysis were plotted for each gene are indicated as mean ± SD (n ¼ 3). The numbers above the bar represents the fold changes with this ligand against dimethylsulfoxide. (C) The relative expressions of STAT6 RNA transcripts as determined by qRT-PCR. The relative expression values from the qRT-PCR analysis were plotted for each gene are indicated as mean ± SD (n ¼ 3). The numbers above the bar represents the fold changes with this ligand against dimethylsulfoxide.
0.006 250 -0.7 0.005 200 150 0.004 0.003 -2.86 100 0.002 50 0.001 0 0 20E DMSO 20E DMSO STAT6 STAT6
control of the EcR gene switch. The microarray data corroborate evidence for an overall benign influence of 20E on gene expression and metabolism in mammalian cells [44]. It is conceivable that 20E is excluded by mammalian cells, or perhaps some other factors in the mammalian cells inhibit the activity of 20E.
induced by Pon A by
A total of 639 genes were up-regulated and 638 were down-regulated in 293 cells treated with Pon A com- pared to the cells treated with dimethylsulfoxide (Fig. 5A). Among these, 41 genes showed P £ 0.01 and induction (up ⁄ down-regulated; two-fold or greater Table 1). Only three genes showed signal detection val- ues greater than 100. Out of these three genes, we selected tousled-like kinase (Tlk) gene for qRT-PCR analysis. The data from both methods showed that the Tlk gene was two-fold (Fig. 5B,C). In proliferating human cells, Tlks are
maximally active during the S phase but rapidly inacti- vated in response to inhibitors of DNA replication [45]. Sillje and Nigg [46] showed that the Asf1 (anti- silencing function 1) proteins are phosphorylated by Tlks both in vivo and in vitro during the S phase and dephosphorylated with inactivation of Tlks. Constan- tino et al. [47] used the ecdysone inducible gene expres- sion system in hematopoietic cells and found that the two steroids, muristerone A and Pon A, altered the signaling pathways induced by IL-3 in the pro-B cell- line, Ba ⁄ F3. Indeed, they also showed that these ecdy- steroids potentiate the IL-3-dependent activation of the PI 3-kinase ⁄ Akt pathway, an effect that could ulti- mately interfere with the growth, and ⁄ or survival of these cells. Our data do not reveal any affect of Pon A on the PI 3-kinase ⁄ Akt pathway in 293 cells. A possi- ble reason is that these genes might be expressed only
FEBS Journal 274 (2007) 5669–5689 ª 2007 The Authors Journal compilation ª 2007 FEBS
5675
S. K. Panguluri et al.
Ecdysone receptor gene switch ligands
A
5 0 - E 1
l
4 0 - E 1
3 0 - E 1
2 0 - E 1
i
) e u a v - p t s e t t ( e c n a c i f i n g S
1 0 - E 1
0 0 - E 1
/16 /8 /4 /2 /1.5 1 x1.5 x4 x8 x16 Fold Suppression/Induction
B
C
2
i
l
s e u a V
i
l a n g S
1.99
l
n o s s e r p x E e v i t a e R
Fig. 5. Steroidal ligand Pon A may affect cell division in 293 cells. (A) The V-plot of differentially expressed genes from microarray analysis. The P-values of t-test are plotted against fold suppression or induction. The horizontal bar in the plot represents the nominal significant level 0.001 for the t-test under the assumption that each gene has a unique variance. The vertical bars represent the genes that are minimum of two-fold up- or down-regulated compared to the control dimethylsulfoxide (DMSO). (B) The signal values of Tlk gene from microarray. The signal values from the microarray analysis were plotted for each gene are indicated as mean ± SD (n ¼ 3). The numbers above the bar rep- resents the fold changes with this ligand against dimethylsulfoxide. (C) The relative expression of Tlk transcripts as determined by qRT-PCR. The relative expression values from the qRT-PCR analysis were plotted for each gene are indicated as mean ± SD (n ¼ 3). The numbers above the bar represents the fold changes with this ligand against dimethylsulfoxide.
0.0025 0.002 0.0015 0.001 0.0005 0 90 80 70 60 50 40 30 20 10 0 PonA DMSO PonA DMSO TLK TLK
in a particular type of cells, such as hematopoietic cells, but not 293 cells. These observations, in conjunction with our microarray and qRT-PCR data, indicate that Pon A may affect cell division in mammalian cells.
Diacylhydrazine ligands do not induce significant changes in gene expression
for
effects on vertebrates
diacylhydrazine
from the
gene
GSTM-E); and, finally, a more polar and water-soluble variant of RSL-1, namely RG-102277. First, we deter- mined the effect of dimethylsulfoxide itself on the expression of genes in 293 cells. The expressions of a total of 43 genes were modulated with P £ 0.01 with a two-fold change in expression. Among the affected genes, 38 were up-regulated and five of them were down-regulated. Interestingly, only 13 up-regulated genes and one down-regulated gene showed signal detection values of more than 100 in the dimethylsulf- oxide-treated 293 cells. In our experience, the genes that show signal detection values less than 100 are not reliable indicators of gene expression; therefore, we did not consider these in our analyses.
ligands have been sub- Diacylhydrazine nonsteroidal jected to extensive studies concerning their toxicologi- cal the purposes of Environmental Protection Agency registration as com- mercial insecticides [48,49]. We selected four represen- tatives switch chemotype for evaluation of their effects on expression of endogenous genes in 293 cells: the lepidopteran insecticide, methoxyfenozide (RG-102398); the coleopt- eran insecticide, halofenozide (RG-100864); the Rheo- Switch(cid:2) ligand RSL-1 (RG-102240, also known as
Cells treated with the diacylhydrazine RG-102240 resulted in up-regulation of a total of 865 genes; on the other hand, 411 genes were down-regulated in 293 cells treated with RG-102240 (Fig. 6A). From these, we con- sidered for further analysis only the genes with P £ 0.01
FEBS Journal 274 (2007) 5669–5689 ª 2007 The Authors Journal compilation ª 2007 FEBS
5676
S. K. Panguluri et al.
Ecdysone receptor gene switch ligands
A
5 0 - E 1
4 0 - E 1
l
3 0 - E 1
2 0 - E 1
i
) e u a v - p t s e t t ( e c n a c i f i n g S
1 0 - E 1
0 0 - E 1
x16 x4 x1.5 /8 x8 /4 /2 /1.5 /16 1 Fold Suppression/Induction
B
C
i
l
s e u a V
i
l a n g S
l
n o s s e r p x E e v i t a e R
Fig. 6. RSL-1 ligand does not cause significant changes in gene expression in 293 cells. (A) The V-plot of differentially expressed genes from microarray analysis. The P-values of t-test are plotted against fold change in gene expression. The horizontal bar in the plot represents the sig- nificant level of 0.001 for the t-test under the assumption that each gene has a unique variance. The vertical bars represent the genes that are minimum of two-fold up- or down-regulated compared to the control dimethylsulfoxide (DMSO). (B) The signal values of Dab and KIF9 genes from the microarray analysis. The signal values from the microarray analysis were plotted for each gene are indicated as mean ± SD (n ¼ 3). The numbers above the bar represents the fold changes with this ligand against dimethylsulfoxide. (C) The relative expressions of Dab and KIF9 genes as determined by qRT-PCR analysis. The relative expression values from the qRT-PCR analysis were plotted for each gene are indicated as mean ± SD (n ¼ 3). The numbers above the bar represents the fold changes with this ligand against dimethylsulfoxide.
-3.91 -2.8 3.9 -2.11 1200 1000 800 600 400 200 0 0.008 0.007 0.006 0.005 0.004 0.003 0.002 0.001 0 DMSO GSE DMSO GSE DMSO GSE DMSO GSE DAB Kinesine DAB Kinesine
with a two-fold change in expression compared to the expression in dimethylsulfoxide-treated cells. A total of 46 genes met these criteria. However, only six of these genes showed signal detection values greater than 100 (Table 1). The annotations for these genes were devel- oped by using NIH david ease software (http://david. niaid.nih.gov/david/ease.htm). Only two out of six were annotated; these were identified as DAB2 interacting protein gene and kinesin family member-9 (KIF9).
in RG-102240-treated cells
dimethylsulfoxide-treated
expression
in
The reliability of microarray results depends on sev- eral factors such as array production, RNA extraction, probe labeling, hybridization conditions and image analysis [50–53]. Therefore, the genes identified as dif- ferentially expressed by this method must be validated with another method such as qRT-PCR, which is quantitative, rapid, and requires 1000-fold less RNA
than conventional assays [54]. For this reason, we designed primers for DAB2 interacting protein gene and KIF9 from their cDNA sequences for qRT-PCR analysis. Their expression levels were measured in dimethylsulfoxide- and RG-102240-treated 293 cells and compared to microarray data. The DAB2 interact- ing protein gene showed two-fold down-regulation by microarray and a four-fold increase by qRT-PCR analysis compared to cells the (Fig. 6B,C). The KIF9 gene showed 3.9-fold down-reg- ulation by microarray and 2.8-fold down-regulation by qRT-PCR analysis in RG-102240-treated cells com- pared to the expression in dimethylsulfoxide-treated cells (Fig. 6B,C). The Drosophila melanogaster Dab (Disabled) interacting protein is the mammalian ortho-
FEBS Journal 274 (2007) 5669–5689 ª 2007 The Authors Journal compilation ª 2007 FEBS
5677
S. K. Panguluri et al.
Ecdysone receptor gene switch ligands
induced phenotypic changes [56]. From these observa- tions, it can be concluded that, although the RSL-1 ligand down-regulates the KIF9 gene, there may not be significant changes in cell shape remodeling.
logue of D. melanogaster DabIP. The DabIP partici- pates in a signaling complex containing various pro- teins involved in brain development as well as other aspects of adult brain function [55]. Although the microarray showed two-fold down-regulation of the Dab gene, the qRT-PCR data showed four-fold up-regulation. The reasons for difference in the fold regulation between the two techniques are not readily apparent. KIF9 protein is found to interact with Ras- like GTPase Gem and is involved in cell shape remod- eling [56]. Both microarray data and qRT-PCR data, showed similar results (3.9-fold and 2.8-fold down-reg- ulation, respectively) in KIF9 gene expression levels. Over-expression of the KIF9 mutant did not cause any significant difference in Gem-induced cell elongation and it does not appear to be essential for the Gem-
Treatment of HEK 293 cells with RG-102398 resulted in a total of 598 down-regulated and 388 up-regulated genes (Fig. 7A). Among these, 52 genes indicated P £ 0.01 and a change in expression of two- fold or greater compared to dimethylsulfoxide-treated cells (Table 1). Only three genes [ribosomal protein L13 (RPL), hypothetical protein gene FLJ38705 and leptin receptor] out of these 52 showed signal detection values greater than 100. The qRT-PCR and microarray anal- ysis of RPL gene expression are weakly correlated. The RPL gene was down-regulated by two-fold by by microarray,
up-regulated
but was
1.25-fold
A
5 0 - E 1
4 0 - E 1
l
3 0 - E 1
2 0 - E 1
i
) e u a v - p t s e t t ( e c n a c i f i n g S
1 0 - E 1
0 0 - E 1
/16 /8 /4 /2 /1.5 1 x1.5 x4 x8 x16 Fold Suppression/Induction
B
C
i
l
s e u a v l
n o s s e r p x e
i
e v i t
a n g S
l
a e R
DMSO
DMSO
RG-102398
RG-102398
DMSO
RG-120398
RG-120398
DMSO
RPL
Zink Finger
Zink Finger
RPL
Fig. 7. Effect of RG-102398 on 293 cells. (A) The V-plot of differentially expressed genes from microarray analysis. The P-values of t-test are plotted against fold suppression or induction. The horizontal bar in the plot represents the nominal significant level 0.001 for the t-test under the assumption that each gene has a unique variance. The vertical bars represent the genes that are minimum of two-fold up or down regu- lated compared to the control dimethylsulfoxide (DMSO). (B) The signal values of RPL and Zink finger protein genes. The signal values from the microarray analysis were plotted for each gene are indicated as mean ± SD (n ¼ 3). The numbers above the bar represents the fold changes with this ligand against dimethylsulfoxide. (C) The relative expressions of RPL and Zink finger protein RNA levels as determined by qRT-PCR. The relative expression values from the qRT-PCR analysis were plotted for each gene are indicated as mean ± SD (n ¼ 3). The numbers above the bar represents the fold changes with this ligand against dimethylsulfoxide.
FEBS Journal 274 (2007) 5669–5689 ª 2007 The Authors Journal compilation ª 2007 FEBS
5678
250 200 -1.49 150 -2.05 -2.27 100 50 1.25 0 0.10000 0.09000 0.08000 0.07000 0.06000 0.05000 0.04000 0.03000 0.02000 0.01000 0.00000
S. K. Panguluri et al.
Ecdysone receptor gene switch ligands
in RG-102398-treated
long finger-like projections that extend into the rRNA core to stabilize its structure. Most of the proteins interact with multiple RNA elements, often from dif- ferent domains. The crucial activities of decoding and peptide transfer are RNA-based; proteins play an active role in functions that may have evolved to streamline the process of protein synthesis. In addition to their function in the ribosome, many ribosomal proteins have some function ‘outside’ the ribosome. Although the RLP13 gene was affected by the RSL ligand RG-102398 in the present study, further studies are needed to confirm its effects, as these two tech- niques indicate opposite regulation.
cells qRT-PCR analysis compared to the expression in dimetylsulfide-treated cells (Fig. 7B,C). By contrast, a good correlation was observed between the microarray and qRT-PCR data with the hypothetical protein gene (down-regulated by two-fold and 1.4-fold by microarray and qRT-PCR analyses, respectively) (Fig. 7B,C). The hypothetical protein FLJ38705 is zinc finger protein 41 homolog (mouse). The pathways and interactions of this hypo- thetical protein are not known. RLP is a ribosomal protein which usually decorates the rRNA cores of the subunits. Approximately two-thirds of the mass of the ribosome consists of RNA and one-thirds comprises protein. The proteins are named in accordance with the subunit of the ribosome to which they belong: the small (S1 to S31) and the large (L1 to L44). Many of ribosomal proteins, particularly those of the large sub- unit, feature a globular, surface-exposed domain with
Cells treated with RG-100864 showed a total of 566 up-regulated genes and 398 down-regulated genes (Fig. 8A). Among these, only 38 genes showed P £ 0.01 and two-fold or greater induction (Table 1). these genes showed signal detection Only three of
A
5 0 - E 1
4 0 - E 1
l
3 0 - E 1
2 0 - E 1
i
) e u a v - p t s e t t ( e c n a c i f i n g S
1 0 - E 1
0 0 - E 1
x4 /2 /1.5 /4 1 x1.5 x8 x16 /16 /8 Fold Suppression/Induction
B
C
i
l
s e u a V
l
-2.08
i
n o s s e r p x E e v i t
a n g S
-2.6
l
a e R
Fig. 8. Effect of RG-100864 on 293 cells. (A) The V-plot of differentially expressed gene from microarray analysis. The P-values of t-test are plotted against fold suppression or induction. The horizontal bar in the plot represents the nominal significant level 0.001 for the t-test under the assumption that each gene has a unique variance. The vertical bars represent the genes that are minimum of two-fold up- or down- regulated compared to the control dimethylsulfoxide (DMSO). (B) The signal values of hypothetical protein gene from the microarray. The signal values from the microarray analysis were plotted for each gene are indicated as mean ± SD (n ¼ 3). The numbers above the bar represents the fold changes with this ligand against dimethylsulfoxide. (C) The relative expressions of hypothetical protein transcript levels as determined by qRT-PCR. The relative expression values from the qRT-PCR analysis were plotted for each gene are indicated as mean ± SD (n ¼ 3). The numbers above the bar represents the fold changes with this ligand against dimethylsulfoxide.
FEBS Journal 274 (2007) 5669–5689 ª 2007 The Authors Journal compilation ª 2007 FEBS
5679
140 120 100 80 60 40 20 0 0.0160 0.0140 0.0120 0.0100 0.0080 0.0060 0.0040 0.0020 0.0000 DMSO RG-100864 DMSO RG-100864 Hypo Hypo
S. K. Panguluri et al.
Ecdysone receptor gene switch ligands
values greater than 100. A cDNA sequence is available for only one gene out of these three: hypothetical pro- tein gene FLJ22344, to which we have designed primers and performed qRT-PCR. The microarray data and qRT-PCR data for this hypothetical protein gene are negatively correlated. In the microarray experiment, the hypothetical protein gene showed two-fold up-regula- tion compared to two-fold down-regulation in qRT- PCR analysis (Fig. 8B,C). The pathways and interac- tions of this hypothetical protein are not known.
In 293 cells treated with RG-102277, 512 genes were up-regulated and 456 genes were down-regulated com- (Fig. 9A). pared to dimethylsulfoxide-treated cells Among these genes, 45 genes showed P £ 0.01 and two-fold or greater induction (up ⁄ down regulated) (Table 1). Only five out of these 45 genes showed sig- nal detection values greater than 100, of which two and genes
receptor C type 2
[mannose
(MRC)
KIAA0515] had assigned cDNA sequences. MRC expression, showed a positive correlation between qRT-PCR and microarray data (2.8- and 3.3-fold down-regulated, respectively; Fig. 9B,C). MRC, also known as Endo 180, is a 180 kDa transmembrane gly- coprotein that is a part of trimolecular cell surface complex with urokinase-type plasmogen activator and its receptor [57]. This trimolecular complex plays an important role in cell guidance and chemotaxis during normal and pathological events [58]. The expression of MRC is restricted to stromal cells, macrophages, endo- thelial cells, tumor endothelium and breast cancer tis- sue in normal conditions [59–61]. The up-regulation of this MRC is observed in tumor endothelial cells [62], which have a potential role in the regulation of tumor neoangiogenesis. The ligand RG-102277 showed down- regulation of this MRC gene in 293 cells as measured by both analytical techniques. Because only up-regula-
A
5 0 - E 1
l
4 0 - E 1
3 0 - E 1
2 0 - E 1
i
) e u a v - p t s e t t ( e c n a c i f i n g S
1 0 - E 1
0 0 - E 1
/16 x16 1 x1.5 /2 /1.5 /8 x8 x4 /4 Fold Suppression/Induction
C
B
i
l
s e u a V
l
n o s s e r p x e
2.01 -1.3
e v i t
i
160 140 120 100 80 60 40 20 0
a n g S
l
0.160000 0.140000 0.120000 0.100000 0.080000 0.060000 0.040000 0.020000 0.000000
-3.35 -2.8
a e R
Fig. 9. Effect of RG-102277 on 293 cells. (A) The V-plot of differentially expressed genes from microarray analysis. The P-values of t-test are plotted against fold suppression or induction. The horizontal bar in the plot represents the nominal significant level 0.001 for the t-test under the assumption that each gene has a unique variance. The vertical bars represent the genes that are minimum of two-fold up- or down-regu- lated compared to the control dimethylsulfoxide (DMSO). (B) The signal values of MRC and KIAA genes from the microarray. The signal val- ues from the microarray analysis were plotted for each gene are indicated as mean ± SD (n ¼ 3). The numbers above the bar represents the fold changes with this ligand against dimethylsulfoxide. (C) The relative expressions of MRC and KIAA transcripts as determined by qRT-PCR. The relative expression values from the qRT-PCR analysis were plotted for each gene are indicated as mean ± SD (n ¼ 3). The numbers above the bar represents the fold changes with this ligand against dimethylsulfoxide.
FEBS Journal 274 (2007) 5669–5689 ª 2007 The Authors Journal compilation ª 2007 FEBS
5680
DMSO DMSO DMSO DMSO RG- 102277 RG- 102277 RG- 102277 RG- 102277 MRC KIAA KIAA MRC
S. K. Panguluri et al.
Ecdysone receptor gene switch ligands
the down- tion will cause tumor neoangiogenesis, regulation of this gene by RG-102277 probably does not contraindicate its use.
121150, Pon A also appears to be a benign substance. The homologue 20E did not cause significant changes in gene expression at all. Likewise, at 10 lm, four di- acylhydrazine nonsteroidal ligands did not cause signif- icant changes in gene expression, except for minor effects on a few genes of lesser significance, KIF9, RPL and MRC. The relatively minor perturbation of gene expression in 293 cells for the diacylhydrazines corro- borates on a gene expression level the known favorable mammalian toxicology.
Experimental procedures
Sources, preparation, and characterization of ligands
General procedures
Overall, the effect of diacylhydrazines on the expres- sion of genes in 293 cells was minimal as shown by microarray as well as by qRT-PCR data. There appear to be differences among the individual diacylhydra- zines, but it may be premature to interpret these data in terms of structure–activity relationships. No signifi- cant pathway is affected by these ligands. Only one or two genes have a cDNA sequence available for qRT- PCR analysis and only half of the genes studied showed positive correlation between microarray and qRT-PCR analysis. The poor correlation between the microarray and qRT-PCR data for these genes is due to the fact that the small variations in the mRNA levels can be accurately detected by qRT-PCR, but might not be accurately reflected in microarray expression scores, especially for genes expressed at low levels (approxi- mately three or four copies per cell) [63]. Etienne et al. [64] have hypothesized that, in addition to genes with low expression levels, those with very high expression levels or a greater percent of absent calls may show lower levels of correlation between microarray and semiquantitative qRT-PCR data. The level of expres- sion differences between microarray and qRT-PCR may also be due to the lack of specificity in the primers designed to discriminate gene family members at the level of primary screening by DNA arrays [54]. There- fore, to the degree of resolution afforded by combined qRT-PCR and microarray analysis, we concluded that these diacylhydrazine ligands are safe for use as induc- ers of gene switches, especially because the concentra- tions anticipated for gene therapy would likely be lower than the 1 lm examined in the present study.
Conclusion
Most reagents were purchased from Aldrich (Milwaukee, WI, USA), VWR (West Chester, PA, USA), or Fisher Scien- tific (Pittsburg, PA, USA). Pon A and 20E were purchased from Alexis Biochemicals (Lausen, Switzerland). Both sub- stances were assayed without further purification. Solvents were reagent grade unless otherwise stated. Anhydrous solvents were used as purchased. Analytical TLC was per- formed on Macherey–Nagel Polygram(cid:2) Sil G ⁄ UV254 0.2 mm plates. Most plates were visualized by UV light; some plates were developed using iodine or phosphomolybdic acid. Silica gel chromatography was performed using Aldrich silica gel (230–400 mesh, 60 A˚ ) in glass columns under a N2 or argon head pressure of approximately 30 psi. Melting points were measured in glass capillary tubes and are uncorrected. Most 1H NMR spectra were recorded at 400.13 MHz with a Bruker DPX-400; 13C NMR spectra were recorded at 100.6 MHz with a Bruker DPX-400 at NMR Services in Rochester, NY. Some 1H NMR was performed at 200 MHz on a Varian instrument (Palo Alto, CA, USA) or 300 MHz on a Bruker instrument (Billerica, MA, USA). Unless other- wise stated, internal reference is solvent. LC-MS analysis was performed using an Agilent 1100 LC stack coupled with an Agilent (Foster City, CA, USA) single quad mass spectro- meter. Solvents were (A) H2O ⁄ 0.1% formic acid and (B) ACN ⁄ 0.1% formic acid in a gradient of T ¼ 0 15% B to T ¼ 10 98% B and a stop time of 20 min on a 75 mm · 2.1 mm C18 column with a flow rate ¼ 0.2 mLÆ min)1. Exact mass analysis were performed by direct infusion into an Agilent ESI ⁄ TOF mass spectrometer. Mass spec- trometry was performed by the Scripps Research Institute mass spectroscopy service (La Jolla, CA, USA).
Preparation and purification of ligands
The diacylhydrazine RG-102277 (Fig. 10) was prepared in a manner analogous to literature precedent [13] with adjust- ments in the final phase of the synthesis to incorporate the
The present investigation analyzed the effects of EcR gene switch ligands on the expression of endogenous genes. Two widely used analytical techniques, oligo nucleotide probe microarray and qRT-PCR, were employed to perform the analyses. Keeping in mind that the ligand concentrations in this investigation are high relative to the anticipated pharmacologically rele- vant blood levels for gene therapy, the THQ RG- 120499 caused significant changes in the expression of genes such as v-maf, TNF, PNAS13, Rab, Reprimo and DNAH at 1 lm. An AMK, RG-121150, affected the expression of genes such as EGR, FBJ and v-jun at 10 lm. Also at 10 lm, the steroidal ligand, Pon A induced only the Tlk gene, known to interfere with the growth and ⁄ or survival of cells. Otherwise, like RG-
FEBS Journal 274 (2007) 5669–5689 ª 2007 The Authors Journal compilation ª 2007 FEBS
5681
S. K. Panguluri et al.
Ecdysone receptor gene switch ligands
O
COOH
NH
a, b
O
N H
O
N
O
g
O
N H
1
2
COCl
COOH
O
c, d, e, f
5
Br
Br
h, i, j, k
3
4
O
O
O
O
N
N
l
N H
N H
O
O
NH2
R
O
RG-102277
6 7 8 9
R = CH2OH CHO C(O)OH C(O)OPh-F5
Fig. 10. Synthesis of the diacylhydrazine RG-102277. (a) SOCl2, dimethylformamide; (b) t-BuNHNH3Cl, aqueous K2CO3, CH2Cl2; (c) CH3OH, Et3N, CH2Cl2; (d) N-bromosuccinimide, AIBN, CCl4; (e) aqueous HBr, 100 (cid:3)C 3 h; (f) SOCl2, dimethylformamide, CHCl3; (g) aqueous K2CO3, CH2Cl2; (h) CaCO3, H2O, dioxane; (i) PCC, CH2Cl2; (j) KMnO4, t-BuOH; (k) PfOH, N¢,N¢-dicyclohexylcarbodiimide; (l) NH4OH, dioxane, 60 (cid:3)C, 6 h.
[6-Fluoro-4-(4-fluoro-phenylamino)-2-methyl-3,4- dihydro-2H-quinolin-1-yl]-(3-fluoro-4-methyl-phenyl)- methanone (RG-120499)
RG-120499 was prepared according to the previously described procedure [17,18]. 1H NMR (400 MHz, dimethyl- sulfoxide-d6) d: 7.22 (t, J ¼ 8.0 Hz, 1H), 7.11 (d, J ¼ 10.4 Hz, 1H), 7.04–6.96 (m, 4H), 6.88–6.79 (m, 3H), 6.64 (dd, J ¼ 4.8, 8.4 Hz, 1H), 6.02 (d, J ¼ 8.4 Hz, 1H), 4.78– 4.69 (m, 1H), 4.66–4.59 (m, 1H), 2.77 (ddd, J ¼ 3.6, 8.8, 12.8 Hz, 1H), 2.23 (s, 3H), 1.26 (ddd, J ¼ 3.2, 8.8, 12.0 Hz, 13C NMR (100 MHz, 1H), 1.20 (d, J ¼ 5.6 Hz, 3H); dimethylsulfoxide-d6) d: 167.60, 161.53, 161.11, 158.99, 158.82, 156.27, 153.86, 144.86, 140.28, 136.37, 133.40, 131.60, 128.61, 126.88, 126.62, 124.67, 116.05, 115.83, 115.68, 115.44, 114.16, 114.09, 113.70, 113.48, 111.31, 111.07, 49.25, 48.81, 21.48, 14.38; HRES (ESI) m ⁄ z calcu- lated for C24H22F3N2O [M+ + H]+ 411.1684, found 411.1653, calculated for C24H21F3N2NaO [M+ + Na]+ 433.1504, found 433.1508.
5-Ethyl-2,3-dihydro-benzo[1,4]dioxine-6-carboxylic acid[1-(3,5-dimethyl-benzoyl)-cyclopentyl]-amide (RG-121510)
RG-121510 was prepared according to the previously described procedure [15,16]. 1H NMR (400 MHz, dimethyl- sulfoxide-d6) d: 7.52 (s, 2H), 7.15 (s, 1H), 6.68 (d, J ¼ 8.4 Hz, 1H), 6.57 (d, J ¼ 8.4 Hz, 1H), 6.30 (s, 1H), 4.28 (s,
amide group. 2-Ethyl-3-methoxybenzoic acid 1 was con- verted to the corresponding acid chloride and coupled with t-butylhydrazine under controlled conditions to form a mono-acylated hydrazine 2. The alternate ring was con- structed from 3,5-dimethyl benzoic acid 3. Rather than direct bromination of the acid [14], we found that esterifica- tion to the methyl ester followed by controlled bromination with N-bromosuccinimide and distillation provides pure and plentiful quantities of 3-bromomethyl-5-methyl benzo- ate. Subsequent de-esterification using HBr smoothly yields the corresponding carboxylic acid. The bromomethyl benzoic acid, in turn, was converted to the acid chloride 4 using thionyl chloride and then coupled with the aforemen- tioned mono-hydrazide 2. The benzylic bromide was con- verted to the benzyl alcohol 6 using calcium carbonate, and the alcohol was then oxidized first to the aldehyde 7 and then to the carboxylic acid 8 using pyridinium chlorochro- mate and potassium permanganate, respectively [13]. In our hands, this two-step oxidation provided purer product in higher yields than did direct oxidation. The diacylhydrazine carboxylic acid was then esterified to an activated ester 9 with pentafluorophenol using N¢,N¢-dicyclohexylcarbodi- imide as a coupling agent. Finally, the pentafluorophenol was displaced with ammonia in dioxane ⁄ water to provide RG-102277. The diacylhydrazines, as well as the THQ RG-120499 and AMK RG-121150 were purified by flash chromatography and ⁄ or crystallization to 99% purity or greater as judged by 400 MHz 1H NMR. The ecdysteroids were used in the form obtained from the commercial vendor.
FEBS Journal 274 (2007) 5669–5689 ª 2007 The Authors Journal compilation ª 2007 FEBS
5682
S. K. Panguluri et al.
Ecdysone receptor gene switch ligands
2-Ethyl-3-methoxybenzoyl chloride
4H), 2.68 (m, 2H), 2.42–2.35 (m, 8H), 2.15–2.10 (m, 2H), 1.94–1.87 (m, 4H), 1.00 (t, J ¼ 7.2 Hz, 3H); 13C NMR (100 MHz, dimethylsulfoxide-d6) d: 201.68, 168.63, 144.67, 141.65, 137.30, 136.85, 133.10, 132.28, 129.20, 125.99, 119.12, 114.38, 70.91, 64.22, 37.78, 24.90, 21.35, 19.62, 14.70; HRES (ESI) m ⁄ z calculated for C25H30NO4 [M++ H]+ 408.2175, found 408.2177, calculated for C25H29NNaO4 [M++ Na]+ 430.1994, found 430.1991.
Benzoic acid N-tert-butyl-N¢-(4-chloro-benzoyl)- hydrazide (RG-100864)
[M++Na]
RG-100864 was prepared according to the previously de- scribed procedure [65,66]. 1H NMR (400 MHz, dimethyl- sulfoxide-d6) d: 10.75 (s, 1H), 7.55–7.49 (m, 5H), 7.45 (d, J ¼ 6.8 Hz, 2H), 7.40 (dd, J ¼ 2.4, 9.6 Hz, 2H), 1.52 13C NMR (400 MHz, dimethylsulfoxide-d6) d: (s, 9H); 171.32, 166.35, 136.98, 134.16, 132.52, 132.32, 128.92, 128.81, 127.97, 127.40, 60.91, 27.78; HRMS (ESI) m ⁄ z calculated for C18H19ClN2NaO2 353.1022, found 353.1033.
2-ethyl-3-methoxybenzoic acid [68] (60 g, 330 mmol) was suspended in 80 mL CHCl3 in a 500 mL round-bottom flask equipped with condensor, addition funnel, thermo- meter, and KOH trap. Dimethylformamide (0.5 mL) was added, and the mixture was heated at 30 (cid:3)C, thereby dis- solving much of the acid. Thionyl chloride (30 mL) was added through the addition funnel over a period of approx- imately 0.5 h, maintaining temperature at approximately 30 (cid:3)C. The reaction was heated at reflux for approximately 2 h. A Dean-Stark trap was attached, and excess CHCl3 and SOCl2 was removed by distillation. The Dean-Stark removed, and a short distillation head was trap was attached. Product acid chloride was distilled under vacuum (approximately 1 mm). Two fractions of 2-ethyl-3-meth- oxybenzoyl chloride were collected: a forerun (6.46 g, 9.8%, b.p. 93–95 (cid:3)C at approximately 1 torr) possibly con- taining a small amount of SOCl2, and a main fraction (56.36 g, 86%, b.p. 93–95 (cid:3)C at approximately 1 torr). The product crystallized as it cooled to room temperature. 1H NMR (400 MHz, CDCl3) d: 7.67 (d,1H), 7.29 (t, 1H), 7.08 (d, 1H), 3.87 (s, 3H), 2.88 (q, 2H), 1.15 (t, 3H).
3,5-Dimethyl-benzoic acid N-tert-butyl-N¢- (3-ethoxy-2-methyl-benzoyl)-hydrazide (RG-102398)
2-Ethyl-3-methoxy-benzoic acid N¢-tert-butyl-hydrazide (2)
solid
hydrochloride
t-butylhydrazine
11.52; HRMS
calculated
(ESI) m ⁄ z
[M+ + Na] 391.1998,
RG-102398 was prepared according to the previously de- scribed procedure [67]. 1H NMR (400 MHz, dimethylsulf- oxide-d6) d: 10.48 (s, 1H), 7.14 (t, J ¼ 8.0 Hz, 1H), 7.09 (s, 2H), 7.07 (s, 1H), 7.00 (d, J ¼ 8.0 Hz, 1H), 6.28 (d, J ¼ 7.6 Hz, 1H), 3.78 (s, 3H), 3.29 (s, 6H), 1.75 (s, 3H), 1.50 (s, 9H); 13C NMR (100 MHz, dimethylsulfoxide-d6) d: 172.57, 167.72, 157.60, 138.34, 137.02, 136.11, 130.86, 126.85, 124.97, 124.07, 118.63, 112.21, 60.11, 55.75, 28.19, 21.21, for C22H29N2O3 [M+ + H] 369.2178, found 369.2169, calcu- lated for C22H28N2NaO3 found 391.1985.
3,5-Dimethyl-benzoic acid N-tert-butyl-N¢- (3-methoxy-2-ethyl-benzoyl)-hydrazide (RG-102240)
as
acid N¢-tert-butyl-hydrazide
15.31; HRMS
calculated
(ESI) m ⁄ z
[M+ + Na]
405.2154,
A 500 mL, three-neck flask, equipped with magnetic stir bar and thermometer was charged with 100 mL CH2Cl2 and aqueous K2CO3 (37.4 g, 270.6 mmol in 60 mL in water). The biphasic mixture was cooled in an ice bath and (26.87 g, 215.6 mmol) was added in portions. The mixture was cooled to )3 (cid:3)C, and vigorously stirred as 2-ethyl-3-meth- oxybenzoyl chloride (prepared from 2-ethyl-3-methoxyben- zoic acid, 24.4 g, 135.4 mmol, after removal of thionyl chloride and without further purification) was added drop- wise as a solution in 50 mL CH2Cl2, while maintaining the temperature below )2 (cid:3)C. After the addition was com- pleted, stirring was continued at )2 (cid:3)C to )5 (cid:3)C for another 2 h, and then at room temperature overnight. Water was added to dissolve salts, the mixture was shaken in a separatory funnel, and the aqueous phase was removed. The remaining CH2Cl2 phase was washed twice with water and then shaken vigorously with 100 mL 10% NaOH. This aqueous NaOH phase was chilled on ice, acidified with 10% HCl, and extracted three times with ethyl acetate. The ethyl acetate solution was then dried over MgSO4, and solvent was evaporated to yield 2-ethyl- 3-methoxy-benzoic a slightly orange solid (10.9 g, 43.5 mmol, 32.1% yield), quite pure as analyzed by TLC (Rf ¼ 0.28, 4 : 1 CH2Cl2: EtOAc). The original CH2Cl2 phase, now dark in color, was dried over MgSO4, filtered and solvent was removed
RG-102240 was prepared according to the previously de- scribed procedure [67]. 1H NMR (400 MHz, dimethylsulf- oxide-d6) d: 10.50 (s, 1H), 7.12 (t, J ¼ 8.0 Hz, 1H), 7.09 (s, 3H), 7.00 (d, J ¼ 8.0 Hz, 1H), 6.20 (d, J ¼ 7.6 Hz, 1H), 3.77 (s, 3H), 2.34–2.25 (m, 1H), 2.29 (s, 6H), 2.13– 2.01 (m, 1H), 1.52 (s, 9H), 0.88 (t, J ¼ 7.2 Hz, 3H); 13C NMR (100 MHz, dimethylsulfoxide-d6) d: 172.61, 167.98, 157.30, 138.32, 137.09, 135.73, 130.78, 130.40, 126.81, 124.87, 118.64, 112.44, 60.52, 56.07, 28.17, 21.08, 19.98, for C23H31N2O3 [M++ H] 383.2335, found 383.2320, calcu- found lated for C23H30N2O3 405.2140.
FEBS Journal 274 (2007) 5669–5689 ª 2007 The Authors Journal compilation ª 2007 FEBS
5683
S. K. Panguluri et al.
Ecdysone receptor gene switch ligands
as
eluant,
to provide
an additional
500 mL round bottom flask and stirred at 105 (cid:3)C for 3 h, then at room temperature overnight. The mixture was poured onto ice, and the precipitate was collected on a sin- tered funnel, washed with water and pentane, and air-dried to yield 31 g (85% yield) 3-bromomethyl-5-methylbenzoic acid. 1H NMR (200 MHz, CDCl3) d: 7.97 (s, 1H), 7.90 (s, 1H), 7.47 (s, 1H), 4.5 (s, 2H), 2.45 (s, 3H).
3-Bromomethyl-5-methylbenzoyl chloride (4)
in vacuum to yield 26 g of crude product. This material was chromatographed on silica gel using 4 : 1 CH2Cl2: EtOAc 18.5 g (73.9 mmol, 54.7% yield) purified product. Mp ¼ 90– 91 (cid:3)C. 1H NMR (200 MHz, CDCl3) d: 7.20 (t, 1H), 7.0 (br s, 1H), 6.92 (d, 2H), 4.95 (br, 1H), 3.85 (s, 3H), 2.75 (q, 2H), 1.12 (t, 3H), 1.2 (s, 9H); 13C NMR (100 MHz, CDCl3) d: 169.4, 157.8, 135.1, 131.6, 126.8, 119.1, 112.3, 56.2, 55.6, 26.9, 20.7, 14.9. A secondary fraction, 4.5 g of less pure product was obtained.
acid (31 g
Methyl 3,5-dimethylbenzoate
3-bromomethyl-5-methylbenzoic 140 mmol), oxalyl chloride (86 g, 680 mmol), and CHCl3 (10 mL) were mixed in a 300 mL round bottom flasked and stirred at 50 (cid:3)C for 5 h, then at room temperature overnight. As the reaction was incomplete, two drops of dimethylformamide were added and the mixture heated at 55 (cid:3)C for 2 h. Excess oxalyl chloride and CHCl3 were removed in vacuo, CCl4 was added, and volatiles were removed again. The crude product was recrystallized from hexane, then washed with pentane to yield 10.5 g of pale yellow solid, m.p. 45–46 (cid:3)C. 1H NMR (200 MHz, CDCl3) d: 7.95 (s, 1H); 7.90 (s, 1H); 7.55 (s, 1H); 4.50 (s, 2H); 2.45 (s, 3H). An additional approximately 20 g of product was recovered by repeated recrystallizations.
3,5-dimethylbenzoyl chloride (268 g, 1.59 mol) was dissolved in 400 mL methylene chloride in a 1 L round bottom flask. The mixture was cooled in an ice ⁄ water bath to 5 (cid:3)C. Metha- nol (1.91 mol, 61 g, 1.2 equivalents) was added with stirring. A mixture of 241 g (2.38 mol) triethylamine in 100 mL meth- ylene chloride was then carefully added via dropping funnel over a period of approximately 45 min. The mixture was stir- red at 5 (cid:3)C for approximately 30 min, then permitted to warm to room temperature and stirred for 2 h. The mixture was then poured into a separatory funnel and shaken once with 10% HCl, once with water, once with aqueous NaHCO3, and finally with brine. The organic phase was dried over Na2SO4, and solvent was removed in vacuo., to provide a light yellow solid (225 g, 97% yield).
N-(3-bromomethyl-5-methyl-benzoyl)-N-tert-butyl-N¢- (2-ethyl-3-methoxy-benzoyl)-hydrazide (5)
Methyl 3-bromomethyl-5-methylbenzoate
was
of
The literature procedure was followed [19]. Into a 100 mL round bottom flask containing 2.50 g (10 mmol) of 2-ethyl- 3-methoxy-benzoyl-N¢-tert-butyl-hydrazide added 15 mL of methylene chloride, 2.60 g (10.5 mmol) of 3-bro- momethyl-5-methylbenzoyl chloride in 5 mL of methylene chloride and a solution of 2.76 g (20 mmol) of potassium carbonate in 15 mL of water. The reaction mixture was stirred overnight at room temperature, then diluted with 20 mL of methylene chloride and transferred to a separato- ry funnel. The methylene chloride layer was separated and dried, and the solvent was removed in vacuo. The crude product was purified by column chromatography to yield N-(3-bromomethyl-5-methyl-benzoyl)-N-tert- 4.01 g butyl-N¢-(2-ethyl-3-methoxy-benzoyl)-hydrazide (87% yield). 1H NMR (300 MHz, CDCL3) d: 7.41 (s, 1H), 7.1 (m, 3H), 7.02 (t, 1H), 6.082 (d, 1H), 6.08 (d, 1H), 4.41 (s, 2H), 3.78 (s, 3H), 2.4 (m, 1H), 2.31 (s, 3H), 2.25 (m, 1H), 1.60 (s, 9H), 1.01 (t, 3H).
Methyl 3,5-dimethylbenzoate (255 g, 1.55 mol) was dis- solved in 300 mL CCl4 in a 2 L round bottom flask with mechanical stirring and heated to reflux. N-bromosuccini- mide (212 g, 1.19 mol) and 2,2¢-azobis(2-methylpropionitri- le) (AIBN, 5 g) were added portionwise over a period of approximately 6 h. The reaction was monitored by GC and stopped when the quantity of dibromide approximately equaled unreacted starting material. The heterogeneous mixture was filtered through a bed of silica gel and solvent was removed in vacuo. The crude product was distilled under vacuum (b.p. 130 (cid:3)C, approximately 5 mmHg) and recrystallized from pentane to yield 65 g of white solid (23% yield, 97–99% pure). 1H NMR (200 MHz, CDCl3) d: 7.90 (s, 1H), 7.70 (s, 1H), 7.4 (s, 1H), 4.5 (s, 2H), 3.92 (s, 3H), 2.4 (s, 3H). Significantly larger quantities of slightly less pure material were also obtained. Higher boiling frac- tions contained methyl 3,5-bromomethylbenzoate which was also recrystallized from pentane: (25 g, 6.5% yield, 99% pure).
N-(3-hydroxymethyl-5-methyl-benzoyl)-N-tert-butyl- N¢-(2-ethyl-3-methoxy-benzyl)-hydrazide (6)
3-Bromomethyl-5-methylbenzoic acid
Methyl 3-bromomethyl-5-methylbenzoate (38 g, 160 mmol), 48% HBr (300 g), and 100 mL water were mixed in a
The literature procedure was followed [19]. To 4.00 g of N-(3-bromomethyl-5-methyl-benzoyl)-N- (8.68 mmol) tert-butyl-N¢-(2-ethyl-3-methoxy-benzoyl)-hydrazide, con- tained in a 250 mL round bottom flask, were added 40 mL
FEBS Journal 274 (2007) 5669–5689 ª 2007 The Authors Journal compilation ª 2007 FEBS
5684
S. K. Panguluri et al.
Ecdysone receptor gene switch ligands
acid as a benzoyl)-hydrazinocarbonyl]-5-methyl-benzoic cream-colored solid. Since the product did not seem to be very soluble in CH2Cl2, the original aqueous solution was again extracted with 250 mL ethyl acetate. This was evapo- rated to yield an additional 0.14 g (3.6% yield) of product. 1H NMR (300 MHz, dimethylsulfoxide) d: 7.8 (br s, 2H), 7.5 (s, 1H), 7.15 (t, 1H), 7.0 (d, 1H), 6.22 (d, 1H), 4.2 (br, 1H), 3.74 (s, 3H), 2.42 (s, 3H), 2.2 (m, 1H), 1.87 (m, 1H), 1.51 (s, 9H), 0.8 (t, 3H).
3-[N-tert-butyl-N¢-(2-ethyl-3-methoxy-benzoyl)- hydrazinocarbonyl]-5-methyl-benzoic acid pentafluorophenyl ester (9)
of dioxane, 40 mL of water, and 4.34 g of calcium carbon- ate. The reaction flask was placed into an 85 (cid:3)C oil bath and the reaction was stirred and heated for 18 h. The reac- tion mixture was cooled, transferred to a larger flask with ethyl acetate and most of the dioxane was evaporated. The reaction mixture was shaken with about 100 mL of ethyl acetate and filtered. The ethyl acetate layer was separated and the aqueous layer extracted twice with ethyl acetate. Ethyl acetate extract was dried and evaporated to yield of N-(3-hydroxymethyl-5-methyl-benzoyl)-N-tert- 2.07 g butyl-N¢-(2-ethyl-3-methoxy-benzyl)-hydrazide (60% yield). 1H NMR (300 MHz, CDCl3) d: 7.78 (s, 1H), 7.1–7.4 (3 s, 3H), 6.96 (t, 1H), 6.8 (d, 1H), 6.08 (d, 1H), 4.53 (s, 2H), 3.77 (s, 3H), 2.35 (m, 1H), 2.32 (s, 3H), 2.2 (m, 1H), 1.60 (s, 9H), 0.96 (t, 3H).
3-Formyl-5-methyl-benzoic acid N-tert-butyl-N¢- (2-ethyl-3-methoxy-benzoyl)-hydrazide (7)
Pentafluorophenol (0.74 g, 4 mmol as a 50% solution in ethyl acetate) was added to a solution of 3-[N-tert-butyl- N¢-(2-ethyl-3-methoxy-benzoyl)-hydrazinocarbonyl]-5-methyl- benzoic acid (1.5 g, 36.4 mmol) in 30 mL ethyl acetate. N¢,N¢-Dicyclohexylcarbodiimide (3.7 mL of a 1 m solution in CH2Cl2, 3.7 mmol) was added and the mixture was stirred at room temperature for 3 days. The reaction mixture was partitioned between water and ethyl acetate. The organic phase was separated, dried over MgSO4, and filtered. Solvent was removed in vacuo to give 3.0 g of a thick oily solid. This material was purified by silica gel chromatography using a gradient of 0–40% ethyl acetate in hexanes to provide 1.76 g (84% yield) 3-[N-tert-butyl-N¢-(2- ethyl-3-methoxy-benzoyl)-hydrazinocarbonyl]-5-methyl-ben- zoic acid pentafluorophenyl ester. 1H NMR (400 MHz, CDCl3) d: 8.2 (s, 1H), 8.1 (s, 1H), 7.75 (s, 1H), 7.6 (br s, 1H), 7.1 (t, 1H), 6.9 (d, 1H), 6.3 (d, 1H), 3.8 (s, 3H), 2.5 (s, 3H), 2.4 (m, 1H), 2.15 (m, 1H), 1.62 (s, 9H), 0.95 (t, 3H).
The literature procedure was followed [19]. To 2.00 g (5.02 mmol) of N-(3-hydroxymethyl-5-methyl-benzoyl)-N- tert-butyl-N¢-(2-ethyl-3-methoxy-benzoyl)-hydrazide placed in a 250 mL round bottom flask, were added 100 mL of methylene chloride and 1.16 g of pyridinium chlorochro- mate (PCC). The reaction mixture was refluxed for approxi- mately 1 h, at which time TLC (1 : 1 ethyl acetate: hexane) indicated the formation of product (Rf ¼ 0.5). The reaction mixture was concentrated to about 20 mL and then chro- matographed on silica gel. Elution with 30–35% ethyl acetate in hexane yielded 1.75 g (88%) 3-formyl-5-methyl- benzoic acid N-tert-butyl-N¢-(2-ethyl-3-methoxy-benzoyl)- hydrazide as a white solid. 1H NMR (300 MHz, CDCl3) d: 9.93 (s, 1H), 7.6–7.8 (3 s, 3H), 7.0 (t, 1H), 6.82 (d, 1H), 6.19 (d, 1H), 3.77 (s, 3H), 2.42 (s, 3H), 2.3 (m, 1H), 2.0 (m, 1H), 1.62 (s, 9H), 0.90 (t, 3H).
3-[N-tert-butyl-N¢-(2-ethyl-3-methoxy-benzoyl)- hydrazinocarbonyl]-5-methyl-benzamide (RG-102277)
3-[N-tert-butyl-N¢-(2-ethyl-3-methoxy-benzoyl)- hydrazinocarbonyl]-5-methyl-benzoic acid (8)
In a 200 mL round-bottom flask, 3-formyl-5-methyl- benzoic acid N-tert-butyl-N¢-(2-ethyl-3-methoxy-benzoyl)- hydrazide 3.74 g (9.43 mmol) was dissolved in 25 mL warm t-BuOH. Phosphate buffer (25 mL, pH 7.2, Aldrich 31925.2) was added, and the mixture was stirred while 1.65 g (10.4 mmol) KMnO4 was added. The reaction was then stirred at 45–50 (cid:3)C for 3 h. The reaction mixture was poured into 300 mL cold water. Up to approximately 50 mL of 0.5% NaOH was used to wash glassware. The aqueous phases were combined and filtered through What- man #3 filter paper to remove most of the MnO2 sludge. The brown aqueous filtrate was extracted thrice with 150 mL CH2Cl2. The organic extracts were dried over MgSO4, treated with charcoal, and evaporated to provide 2.81 g (72.2% yield) 3-[N-tert-butyl-N¢-(2-ethyl-3-methoxy-
3-[N-tert-butyl-N¢-(2-ethyl-3-methoxy-benzoyl)-hydrazino- carbonyl]-5-methyl-benzoic acid pentafluorophenyl ester (150 mg, 0.259 mmol) was stirred in a solution of 1 mL concentrated NH4OH and 2 mL dioxane at 60 (cid:3)C for 6 h. The mixture was partitioned with water, and the organic layer was concentrated. The residue was purified by silica gel column chromatography using 100% ethyl acetate with 0.1–2% of triethylamine to provide 3-[N-tert-butyl-N¢-(2- ethyl-3-methoxy-benzoyl)-hydrazinocarbonyl]-5-methyl-ben- zamide (46 mg, 43% yield). TLC Rf ¼ 0.06, 1 : 1 ethyl ace- tate:hexane + triethylamine). 1H NMR (400 MHz, CDCl3) d: 7.9 (s,1H), 7.75 (s 1H), 7.58 (s, 1H), 7.55 (s, 1H), 7.0 (t, 1H), 6.85 (d, 1H), 6.3 (br, 1H), 6.2 (d, 1H), 5.6 (br, 1H), 3.77 (s, 3H), 2.4 (s, 3H), 2.38 (m, 1H), 2.1 (m, 1H), 1.60 (s, 9H), 0.95 (t, 3H). 1H NMR (400 MHz, dimethylsulfoxide- d6) d: 10.58 (s, 1H), 7.96 (s, 1H), 7.78 (s, 2H), 7.44 (s, 1H), 7.37 (s, 1H), 7.12 (t, J ¼ 8.0 Hz, 1H), 7.01 (d, J ¼ 8.0 Hz, 1H), 6.23 (d, J ¼ 7.2 Hz, 1H), 3.77 (s, 3H), 2.39 (s, 3H),
FEBS Journal 274 (2007) 5669–5689 ª 2007 The Authors Journal compilation ª 2007 FEBS
5685
S. K. Panguluri et al.
Ecdysone receptor gene switch ligands
found 412.2229,
412.2236,
2.24 (dt, J ¼ 7.2, 14.4 Hz, 1H), 1.89 (dt, J ¼ 7.2, 12.8 Hz, 1H), 1.55 (s, 9H), 0.84 (t, J ¼ 7.2 Hz, 3H); 13C NMR (100 MHz, dimethylsulfoxide-d6) d: 171.57, 167.20, 157.69, 138.34, 137.46, 135.71, 134.04, 130.49, 129.35, 127.07, 123.87, 118.71, 112.40, 61.01, 56.08, 27.81, 21.16, 20.12, 14.99; HRMS (ESI) m ⁄ z calculated for C23H30N3O4 [M+ + H] calculated for C23H29N3NaO4 [M+ + Na] 434.2056, found 434.2026.
Cell lines, reagents, and ligand treatment
template in the subsequent in vitro transcription reactions. The in vitro transcription reaction was carried out in the presence of T7 RNA polymerase and a biotinylated nucleo- tide analog ⁄ ribonucleotide mix for complementary RNA (cRNA) amplification and biotin labeling. The biotinylated cRNA targets were then purified, fragmented, and hybrid- ized to GeneChip expression arrays Human U133 plus 2.0 (Affymetrix Inc., Santa Clara, CA, USA). Array images were processed to determine signals and detection calls (P, present; A, absent; M, marginal) for each probe set using a GeneChip Operating Software (GCOS) Computer Worksta- tion (Affymetrix Inc.). Microarray analyses used three chips per each treatment.
Data analysis
The human embryonic kidney cell cultures (HEK 293) were propagated in DMEM supplemented with 10% fetal bovine serum. All media and serum were purchased from Life Technologies (Rockville, MD, USA). The cells were cul- tured to 20% confluency in 25 cm2 flasks and ligands (1 or 10 lm) or dimethylsulfoxide control were added to each flask. The cells were grown for three days in a CO2 incuba- tor at 37 (cid:3)C and cell morphology was observed daily under a light microscope.
Isolation of total RNA
is the effect due to the replicate, cij
Data analysis was performed using SAS (SAS Institute, Cary, NC, USA), r for Windows GUI front-end (http:// www.r-project.org), and q-value software [69]. The probe sets with absent calls across all samples were removed to reduce the multiple-testing problem. The expression levels were normalized to the chip median and log transformed. Two-way analysis of variance tests are carried out to iden- tify differentially expressed genes. For each probe set, the model yijk ¼ l + ai + bj + cij + eijk was fit, where yijk is the log-transformed expression level of the kth chip in the ith treatment and the jth replicate. The variable l repre- sents the grand mean expression, ai is the effect due to the is the treatment, bj interaction effect between treatment and replicate, and eijk is an error term, which is assumed to be normally distrib- uted with mean 0 and variance r2.
The cells were harvested at 3 days after the addition of ligand (10 lm for all ligands except RG-120499 which was added at 1 lm). The cells were collected by scraping with a rubber policeman and centrifuged at 2300 g for 5 min. The medium was discarded and 500 lL of Triazol reagent (Molecular Research Center Inc., Cincinnati, OH, USA) was added to the cell pellet. The cells were homog- enized, 100 lL of chloroform was added, and the mixture was gently agitated while keeping at room temperature for 5 min, and then centrifuged at 15 800 g for 15 min at 4 (cid:3)C. The supernatant was transferred into a fresh tube, 500 lL isopropanol was added, and the mixture incu- bated at room temperature for 5 min. The mixture was then centrifuged at 15 800 g for 15 min at 4 (cid:3)C. The supernatant was discarded slowly and the total RNA pellet was washed with 70% ethanol, dried and dissolved in nuclease-free water. The RNA was quantified both visually (agarose gel electrophoresis) and UV-spectro- photometer. cDNA synthesis by reverse transcription was perfoemd using 2 lg of DNAse-1 (Ambion Inc., Austin, TX, USA)-treated RNA and iScript cDNA synthesis kit (Bio-Rad Laboratories, Hercules, CA, USA).
Q-values computed using Q-value software indicates the false detection rate for each probe set. Ratio comparison was performed by dividing expression levels of expression in ligand treated cells with the expression levels in dimethylsulf- oxide-treated cells. The gene sets that showed two-fold induc- tion or two-fold suppression were transferred to separate up and down lists, respectively. The genes sets with a P £ 0.01 were identified in these lists and gene annotation was per- formed for these probe sets at Affymetrix NetAffx analysis center (http://www.affymetrix.com/analysis/index.affx). Functional classification of select probe sets was performed at the NIH DAVID server (http://apps1.niaid.nih.gov/david/ upload.asp). Volcano plots were prepared using the r pro- gram.
Microarray analysis
qRT-PCR analysis
The genes that showed signal detection values more than 100, P £ 0.01 and a change in gene expression of more than two-fold compared to the control (dimethylsulfoxide) were selected to study their relative expressions by qRT-PCR using a MyiQ single color real-time PCR detection system
The microarray analysis was performed at the UK micro- array core facility (University of Kentucky, Lexington, KY, USA). The total RNA was converted into double-stranded cDNA using a T7-oligo (dT) promoter primer. Following the RNase H-mediated second-strand cDNA synthesis, double-stranded cDNA was purified and served as a
FEBS Journal 274 (2007) 5669–5689 ª 2007 The Authors Journal compilation ª 2007 FEBS
5686
S. K. Panguluri et al.
Ecdysone receptor gene switch ligands
cdk 2-specific phosphorylation of retinoblastoma pro- tein. Mol Cell Biol Res Commun 3, 352–359.
8 Palli SR, Kapitskaya MZ, Kumar MB & Cress DE
(2003) Improved ecdysone receptor-based inducible gene regulation system. Eur J Biochem 270, 1308–1315. 9 Karzenowski D, Potter DW & Padidam M (2005)
Inducible control of transgene expression with ecdysone receptor: gene switches with high sensitivity, robust expression, and reduced size. Biotechniques 39, 191–200.
(Bio-Rad Laboratories). qRT-PCR was performed in a total of 20 lL reaction volume containing 1 lL of cDNA, 1 lL of each of forward and reverse sequence specific prim- ers (from 10 lm primer stock), 10 lL of supermix (Bio-Rad Laboratories) and 7 lL of nuclease free water. All the qRT-PCR reactions were performed using the following reaction conditions: Initial incubation of 95 (cid:3)C for 3 min followed by 45 cycles of 95 (cid:3)C for 10 s, 60 (cid:3)C for 20 s, and 72 (cid:3)C for 30 s. A fluorescence reading determined the extent of amplification at the end of each cycle.
10 Panguluri SK, Kumar P & Palli SR (2006) Functional characterization of ecdysone receptor gene switches in mammalian cells. FEBS J 273, 5550–5563.
11 Dinan L, Savchenko T & Whiting P (2001) On the dis- tribution of phytoecdysteroids in plants. Cell Mol Life Sci 58, 1121–1132.
Standard curves were obtained using a ten-fold serial dilution of pooled cDNA from all treatments. The expres- sion of Homo sapiens actin gene was used as an internal control. For all the candidate genes, the quantities of the mRNA expression relative to actin mRNA levels were obtained. All samples were measured in triplicate. The PCR efficiency and correlation coefficient values were taken into account before estimating the relative expression. Mean and standard errors for each treatment were obtained from all three replicates.
12 Oehme I, Bosser S & Zornig M (2006) Agonists of an ecdysone-inducible mammalian expression system inhi- bit Fas ligand and TRAIL-induced apoptosis in the human colon carcinoma cell line RKO. Cell Death Differ 13, 189–201.
Acknowledgements
13 Hormann RE, Potter DW, Chortyk O, Tice CM, Carl- son GR, Meyer A & Opie TR (2004) Diacylhydrazine ligands for modulating expression of transgenes via chimeric ecdysone receptor complexes. PCT International Application WO 2004078924.
14 Sawada Y, Nakagawa H, Tsukamoto Y, Yanai T,
This work was supported in part by RheoGene Inc. research grant to SRP. This is contribution number 07-08-102 from the Kentucky Agricultural Experimen- tal Station.
References
Yokoi S, Yanagi M & Watanabe T (2002) Synthesis and insecticidal activity of 3,5-dimethylbenzoyl moiety modified analogues of N-tert-butyl-N¢-(4-ethylbenzoyl)- 3,5-dimethylbenzohydrazide. Nippon Noyaku Gakkaishi 27, 365–373.
1 Zoltick PW & Wilson JM (2001) Regulated gene expres-
15 Palli SR, Kapitskaya MZ & Potter DW (2005) The
influence of heterodimer partner ultraspiracle ⁄ retinoid X receptor on the function of ecdysone receptor. FEBS J 272, 5979–5990.
sion in gene therapy. Ann NY Acad Sci 953, 53–63. 2 Palli SR, Hormann RE, Schlattner U & Lezzi M (2005) Ecdysteroid receptors and their applications in agricul- ture and medicine. Vitam Horm 73, 59–100.
3 Wang Y, Blandino G, Oren M & Givol D (1998)
16 Saez E, Nelson MC, Eshelman B, Banayo E, Kode A, Cho GJ & Evans RM (2000) Identification of ligands and coligands for the ecdysone-regulated gene switch. Proc Natl Acad Sci USA 97, 14512–14517.
17 Tice CM, Hormann RE, Thompson CS, Friz JL,
Induced p53 expression in lung cancer cell line pro- motes cell senescence and differentially modifies the cytotoxicity of anti-cancer drugs. Oncogene 17, 1923–1930.
Cavanaugh CK & Saggers JA (2003) Optimization of a-acylaminoketone ecdysone agonists for control of gene expression. Bioorg Med Chem Lett 13, 1883–1886.
4 Suhr ST, Gil EB, Senut MC & Gage FH (1998) High level transactivation by a modified Bombax ecdysone receptor in mammalian cells without exogenous retinoid X receptor. Proc Natl Acad Sci USA 95, 7999–8004.
5 Guo Z & Vishwanathan JK (2000) Effect of regulated
expression of the fragile histidine triad gene on cell cycle and proliferation. Mol Cell Biochem 204, 83–88.
18 Tice CM, Michelotti EL & Hormann RE (2004) Ketone ligands for ecdysterone receptors modulating the expres- sion of exogenous genes via an ecdysone receptor com- plex. PCT International Application WO 2004005478 A2 20040115.
6 Luers GH, Jess N & Franz T (2000) Reporter-linked
19 Kumar MB, Potter DW, Hormann RE, Edwards A,
monitoring of transgene expression in living cells using the ecdysone-inducible promoter system. Eur J Cell Biol 79, 653–657.
Tice CM, Smith HC, Dipietro MA, Polley M, Lawless M, Wolohan PRN et al. (2004) Highly flexible ligand binding pocket of ecdysone receptor. J Biol Chem 279, 27211–27218.
7 Yu B, Lane ME, Pestell RG, Albanese C & Wadler S (2000) Downregulation of cyclin D1 alters cdk 4- and
FEBS Journal 274 (2007) 5669–5689 ª 2007 The Authors Journal compilation ª 2007 FEBS
5687
S. K. Panguluri et al.
Ecdysone receptor gene switch ligands
20 Smith HC, Cavanaugh CK, Friz JL, Thompson CS,
38 Mu¨ ller H-J, Skerka C, Bialonski A & Zipfel PF (1991) Clone pAT 133 identifies a gene that encodes another human member of a class of growth factor induced genes with almost identical zinc-finger domains. Proc Natl Acad Sci USA 88, 10079–10083.
Saggers JA, Michelotti EL, Garcia J & Tice CM (2003) Synthesis and SAR of cis-1-benzoyl-1,2,3,4-tetrahydro- quinoline ligands for control of gene expression in ecdy- sone responsive systems. Bioorg Med Chem Lett 13, 1943–1946.
39 Perez-Castillo A, Pipaon C, Garcia I & Alemany S (1993) NGFI-A gene expression is necessary for T lymphocyte proliferation. J Biol Chem 268, 19445– 19450.
40 Gashler A & Sukhatme VP (1995) Early growth
21 Massrieh W, Derjuga A, Doualla-Bell F, Ku C-Y, San- born BM & Blank V (2006) Regulation of the MAFF transcription factor by proinflammatory cytokines in myometrial cells. Biol Reprod 74, 699–705.
22 Nishizawa M, Kataoka K, Goto N, Fujiwara KT &
response protein 1 (Egr-1): prototype of a zinc-finger family of transcription factors. Prog Nucl Acid Res Mol Biol 50, 191–224.
Kawai S (1989) v-maf, a viral oncogene that encodes a ’leucine zipper’ motif. Proc Natl Acad Sci USA 86, 7711–7715.
23 Zheng L, Fisher G, Miller RE, Peschon J, Lynch DH
41 Beckmann MA & Wilce PA (1997) Egr transcription factors in the nervous system. Neurochem Int 31, 477– 510.
42 Huang RP, Darland T, Okamura D, Mercola D &
& Lenardo MJ (1995) Induction of apoptosis in mature T cells by tumour necrosis factor. Nature 377, 348–351.
24 Zerial M & Stenmark H (1993) Rab GTPases in vesicu-
lar transport. Curr Opin Cell Biol 5, 613–620.
Adamson ED (1994) Suppression of v-sis-dependent transformation by the transcription factor, Egr-1. Oncogene 5, 1367–1377.
43 Huang RP, Liu C, Fan Y, Mercola D & Adamson ED (1995) Egr-1 negatively regulates human tumor cell growth via the DNA-binding domain. Cancer Res 21, 5054–5062.
25 Pfeffer SR (1994) Rab GTPases: master regulators of membrane trafficking. Curr Opin Cell Biol 6, 522–526. 26 Barbosa MDFS, Johnson SA, Achey K, Gutierrez MJ, Wakeland EK, Zerial M & Kingsmore SF (1995) The Rab protein family: genetic mapping of six Rab genes in the mouse. Genomics 30, 439–444.
27 Hanahan D & Weinberg RA (2000) The hallmarks of
44 Lafont R & Dinan L (2003) Practical uses for ecdyster- oids in mammals including humans: an update. J Insect Sci 3, 7.
cancer. Cell 100, 57–70.
28 Hunter T (1997) Oncoprotein networks. Cell 88, 333–
346.
45 Sillje´ HHW, Takahashi K, Tanaka K, Van Houwe G & Nigg EA (1999) Mammalian homolgues of the plant tousled gene code for cell-cycle-regulated kinases with maximal activities linked to ongoing DNA replication. EMBO J 18, 5691–5702.
29 Gottlieb TM & Oren M (1996) p53 in growth control and neoplasia. Biochim Biophys Acta 1287, 77–102. 30 Levine AJ (1997) p53, the cellular gatekeeper for growth
46 Sillje´ HHW & Nigg EA (2001) Identification of human
and division. Cell 88, 323–331.
31 Sherr CJ (1996) Cancer cell cycles. Science 274, 1672–
Asf1 chromatin assembly factors as substrates of Tousled-like kinases. Curr Biol 13, 1068–1073.
1677.
32 Ohiki R, Nemoto J, Murasawa H, Oda E, Inazawa J,
47 Constantino S, Santos R, Gisselbrecht S & Gouilleux F (2001) The ecdysone inducible gene expression system: unexpected effects of muristerone A and ponasterone A on cytokine signaling in mammalian cells. Eur Cytokine Netw 12, 365–367.
Tanaka N & Taniguchi T (2000) Reprimo, a new candi- date mediator of the p53-mediated cell cycle arrest at the G2 phase. J Biol Chem 275, 22627–22630.
33 Heald R, Tourenbize R, Blank T, Sandaltzopoulos R,
48 Dhadialla TS, Carlson GR & Le DP (1998) New insec- ticides with ecdysteroidal and juvenile hormone activity. Annu Rev Entomol 43, 545–569.
Becker P, Hyman A & Karsenti E (1996) Self-organiza- tion of microtubules in bipolar spindles around artificial chromosomes in Xenopus egg extracts. Nature 382, 420– 425.
34 Vaisberg EA, Koonce MP & McIntosh JR (1993) Cyto- plasmic dynein plays a role in mammalian mitotic spin- dle formation. J Cell Biol 123, 849–858.
49 Carlson GR (2000) Tebufenozide, a modern caterpillar control agent with unusually high target selectibity. In ACS Symposium Series 767. Green Chemical Syntheses and Processes (Anastas PT, Heine LG, Williamson TC, eds), pp. 8–17. American Chemical Society, Washington, DC.
35 Afzelius BA (1976) A human syndrome caused by
immotile cilia. Science 193, 317–319.
50 Der SD, Zhou A, Williams BR & Silverman RH (1998) Identification of genes differentially regulated by inter- feron alpha, beta, or gamma using oligonucleotide arrays. Proc Natl Acad Sci USA 95, 15623–15628.
51 Eisen MB & Brown PO (1999) DNA arrays for analysis of gene expression. Methods Enzymol 303, 179–205.
36 Afzelius BA (1979) The immotile-cilia syndrome and other ciliary diseases. Int Rev Exp Pathol 19, 1–43. 37 Milisav I & Affara NA (1998) A potential human axo- nemal dynein heavy-chain gene maps to 17q25. Mamm Genome 9, 404–407.
FEBS Journal 274 (2007) 5669–5689 ª 2007 The Authors Journal compilation ª 2007 FEBS
5688
S. K. Panguluri et al.
Ecdysone receptor gene switch ligands
52 Winzeler EA, Schena M & Davis RW (1999) Fluores- cence-based expression monitoring using microarrays. Methods Enzymol 306, 3–18.
with malignant as well as benign lesions of the human breast and occurs in specific populations of stromal cells. Int J Cancer 98, 656–664.
53 Schuchhardt J, Beule D, Malik A, Wolski E, Lehrach H & Herzel H (2000) Normalization strategies for cDNA microarrays. Nucleic Acids Res 28, E47.
62 St Croix B, Rago C, Velculescu V, Traverso G, Romans KE, Montgomery E, Lal A, Riggins GJ, Lengauer C, Vogelstein B et al. (2000) Genes expressed in human tumor endothelium. Science 289, 1197–1202. 63 Mutch DM, Berger A, Mansourian R, Rytz A &
54 Rajeevan SM, Ranamukhaarachchi DG, Vernon SD & Unger ER (2001) Use of real-time quantitative PCR to validate the results of cDNA array and differential dis- play PCR technologies. Methods 25, 433–451.
Roberts MA (2002) The limit fold change model: a practical approach for selecting differentially expressed genes from microarray data. BMC Bioinformatics 3, 17.
55 Homayouni R, Magdaleno S, Keshvara L, Rice DS & Curran T (2003) Interaction of Disabled-1 and the GTPase activating protein Dab2IP in mouse brain. Mol Brain Res 115, 121–129.
64 Etienne W, Meyer MH, Peppers J & Meyer RA Jr (2004) Comparison of mRNA gene expression by RT-PCR and DNA microarray. Biotechniques 36, 624–626.
65 Addor RW, Kuhn DG & Wright DP Jr (1987) repara-
56 Piddini E, Schmid JA, Martin R & Dotti CG (2001) The Ras-like GTPase Gem is involved in cell shape remodeling and interacts with the novel kinesin-like pro- tein KIF9. EMBO J 20, 4076–4087.
57 Behrendt N, Jensen ON, Engelholm LH, Mortz E,
tion of insecticidal diacylhydrazines and of intermediary insecticidal acylhydrazines. European Patent EP 228564 A2 19870715.
Mann M & Dano K (2000) A urokinase receptor-associ- ated protein with specific collagen binding properties. J Biol Chem 275, 1993–2002.
66 Hsu AC-T, Aller HE, Le DP, Hamp DW, Weinstein B & Murphy RA (2000) Preparation of insecticidal N¢- substituted-N,N¢-disubstituted hydrazines. US Patent 6013836A 20000111.
67 Lidert Z, Le DP, Hormann RE & Opie TR (1996)
Insecticidal N¢-substituted-N,N¢-diacylhydrazines. US Patent 5 530 028.
68 Meyers AI & Mihelich ED (1975) Oxazolines. XXII.
58 Sturge J, Hamelin J & Jones GE (2002) N-WASP activa- tion by a beta 1-integrin-dependent mechanism supports P13K-independent chemotaxis stimulated by urokinase- type plasminogen activator. J Cell Sci 115, 699–711. 59 Blasi F (1993) Urokinase and urokinase receptor: a paracrine ⁄ autocrine system regulating cell migration and invasiveness. Bioessays 15, 105–111.
60 East L & Isacke CM (2002) The mannose receptor fam-
ily. Biochim Biophys Acta 1572, 364–386.
Nucleophilic aromatic substitution on aryl oxazolines. Efficient approach to unsymmetrically substituted bi- phenyls and o-alkyl benzoic acids. J Am Chem Soc 97, 7383–7385.
69 Storey JD (2002) A direct approach to false discovery
61 Schnack Nielsen B, Rank N, Engelholm LH, Holm A, Dano K & Behrendt N (2002) Urokinase receptor-asso- ciated protein (uPARAP) is expressed in connection
rates. J R Statist Soc B 64, 479–498.
FEBS Journal 274 (2007) 5669–5689 ª 2007 The Authors Journal compilation ª 2007 FEBS
5689