
RESEARC H Open Access
Volumetric intensity-modulated Arc (RapidArc)
therapy for primary hepatocellular carcinoma:
comparison with intensity-modulated
radiotherapy and 3-D conformal radiotherapy
Yu-Cheng Kuo
1,2,4
, Ying-Ming Chiu
5
, Wen-Pin Shih
2
, Hsiao-Wei Yu
6
, Chia-Wen Chen
3
, Pei-Fong Wong
7
,
Wei-Chan Lin
1
and Jeng-Jong Hwang
1*
Abstract
Background: To compare the RapidArc plan for primary hepatocellular carcinoma (HCC) with 3-D conformal
radiotherapy (3DCRT) and intensity-modulated radiotherapy (IMRT) plans using dosimetric analysis.
Methods: Nine patients with unresectable HCC were enrolled in this study. Dosimetric values for RapidArc, IMRT, and
3DCRT were calculated for total doses of 45~50.4 Gy using 1.8 Gy/day. The parameters included the conformal index
(CI), homogeneity index (HI), and hot spot (V
107%
) for the planned target volume (PTV) as well as the monitor units
(MUs) for plan efficiency, the mean dose (D
mean
) for the organs at risk (OAR) and the maximal dose at 1% volume (D
1%
)
for the spinal cord. The percentage of the normal liver volume receiving ≥40,>30,>20,and>10Gy(V
40 Gy
,V
30 Gy
,
V
20 Gy
,andV
10 Gy
) and the normal tissue complication probability (NTCP) were also evaluated to determine liver toxicity.
Results: All three methods achieved comparable homogeneity for the PTV. RapidArc achieved significantly better CI
and V
107%
values than IMRT or 3DCRT (p< 0.05). The MUs were significantly lower for RapidArc (323.8 ± 60.7) and
3DCRT (322.3 ± 28.6) than for IMRT (1165.4 ± 170.7) (p< 0.001). IMRT achieved a significantly lower D
mean
of the
normal liver than did 3DCRT or RapidArc (p= 0.001). 3DCRT had higher V
40 Gy
and V
30 Gy
values for the normal liver
than did RapidArc or IMRT. Although the V
10 Gy
to the normal liver was higher with RapidArc (75.8 ± 13.1%) than with
3DCRT or IMRT (60.5 ± 10.2% and 57.2 ± 10.0%, respectively; p< 0.01), the NTCP did not differ significantly between
RapidArc (4.38 ± 2.69) and IMRT (3.98 ± 3.00) and both were better than 3DCRT (7.57 ± 4.36) (p= 0.02).
Conclusions: RapidArc provided favorable tumor coverage compared with IMRT or 3DCRT, but RapidArc is not
superior to IMRT in terms of liver protection. Further studies are needed to establish treatment outcome
differences between the three approaches.
Background
Hepatocellular carcinoma (HCC) is the fifth most com-
mon malignancy and the third most common cause of
cancer-related death in the world [1]. Surgical resection
has been proven as the major treatment modality for
HCC. However, most patients with HCC have unresect-
able disease at diagnosis. These patients are treated with
other treatment modalities, such as percutaneous
ethanol injection (PEI), radiofrequency ablation (RFA)
therapy, transcatheter arterial chemoradiotherapy
(TACE), or sorafenib, but the response to treatment is
limited [2-6].
The use of radiation therapy (RT) for the treatment of
HCC was first investigated more than 40 years ago, but
the early trials reported poor results due to the low toler-
ance of the whole liver to radiation and severe hepatic
toxicity, or radiation-induced liver disease (RILD) caused
by whole liver irradiation [7,8]. RILD, a clinical syndrome
characterized by ascites, anicteric hepatomegaly, and
impaired liver function, is developed in 5% of patients
* Correspondence: jjhwang@ym.edu.tw
1
Dept. of Biomedical Imaging & Radiological Sciences, National Yang-Ming
University, No. 155, Sec. 2, Li-Nong St., Bei-tou, Taipei 11221, Taiwan
Full list of author information is available at the end of the article
Kuo et al.Radiation Oncology 2011, 6:76
http://www.ro-journal.com/content/6/1/76
© 2011 Kuo et al; licensee BioMed Central Ltd. This is an Open Access article distributed under the terms of the Creative Commons
Attribution License (http://creativecommons.org/licenses/by/2.0), which permits unrestricted use, distribution, and reproduction in
any medium, provided the original work is properly cited.

who received 30~33 Gy whole liver irradiation and
usually occurs 2 weeks to 4 months after completion of
RT. RILD usually resolves after supportive care. Unfortu-
nately, severe RILD may develop into hepatic failure and
even death [9,10]. The low hepatic tolerance to radiation
also limits the application of higher radiation doses to
the tumor. In 1991, Emami et al. reported that the TD
5/5
(the tolerance dose leading to a 5% complication rate at
5 years) for 1/3, 2/3, and the whole liver at 1.8~2 Gy/day
were 50 Gy, 35 Gy, and 30 Gy, respectively [11]. Dawson
et al used the normal tissue complication probability
(NTCP) of the Lyman model to describe the relationship
between irradiated liver volume and radiation dose and
they demonstrated that a higher radiation dose could be
delivered safely to liver tumors, with better outcomes, if
only part of the liver was irradiated [12]. As image-based
treatment planning and engineering has advanced, three-
dimensional conformal radiotherapy (3DCRT) was devel-
oped to irradiate the tumor accurately while minimizing
thedosetothenormalliver.Anumberofstudieshave
demonstrated encouraging results showing that a radia-
tion dose could be safely increased to part of the liver
using 3DCRT [13]. For example, Park et al. reported a
significant relationship between the total dose to the liver
tumor and the tumor response (< 40 Gy, 40-50 Gy, and >
50 Gy giving responses of 29.2%, 68.6%, and 77.1%,
respectively) without significant toxicity (rate of liver
toxicity: 4.2%, 5.9%, and 8.4%, respectively).
Despite improvements to 3DCRT, dose distribution
remains suboptimal in some cases. In the early 2000s, the
development of inverse planning systems and multileaf
collimators (MLCs) culminated in a more sophisticated
technique, intensity-modulated radiotherapy (IMRT).
Using an inverse planning algorithm to generate multiple
nonuniform-intensity beams, IMRT can potentially deli-
ver a higher dose to the tumor while delivering a rela-
tively lower dose to the normal liver as compared with
3DCRT. Cheng et al. suggested that IMRT might be able
to preserve acceptable target coverage and potentially
reduce NTCP values (IMRT = 23.7% and 3DCRT =
36.6%, p= 0.009) compared with 3DCRT [14]. Fuss et al.
reported that IMRT allowed a dose escalation to 60 Gy,
in which range 3DCRT had to reduce the total dose to
decrease the probability of RILD to acceptable levels [15].
The RapidArc technique, developed by Varian Medical
Systems about 2 years ago, is a volumetric intensity-
modulated arc therapy that accurately and efficiently
deliversaradiationdosetothetargetusingaone-or
two-arc gantry rotation by simultaneously modulating
the MLC motion and the dose rates. RapidArc has been
shown to be equivalent or superior to IMRT for some
malignancies, including head and neck cancer and pros-
tate cancer [16-18], but there has been no study to
determine the feasibility of using RapidArc for the
treatment of primary HCC. The purpose of our study
was to compare the RapidArc radiation treatment plans
for patients with HCC with 3DCRT and IMRT plans
using dosimetric analysis. The PTV coverage and critical
organ sparing for each technique were determined using
dose-volume histograms (DVH) and the NTCP model.
Methods
Patient Characteristics
From April 2008 to July 2010, we enrolled nine patients
who had primary HCC diagnosed at China Medical Uni-
versity Hospital. All patients underwent alpha-fetoprotein
(AFP) examination, contrast-enhanced computed tomo-
graphy (CT), and ultrasonography to confirm the diagno-
sis. All patients were male and the median age was 57
years (range, 38-81 years). Five patients had Child-Pugh
score A cirrhosis and 4 had Child-Pugh score B cirrhosis.
Eight (88.9%) patients had American Joint Committee on
Cancer (6
th
edition) stage III disease, and 1 (11.1%)
patient had stage IV disease.
Immobilization, Simulation, and Target Delineation
The patients were immobilized using vacuum casts in a
supine position with both arms raised above their heads.
Non-contrast CT simulation was performed with a 5-mm
slice thickness and included whole liver and bilateral kid-
ney scans. Respiratory control and abdominal compres-
sion were not used. After simulation, the CT images
were transferred into the Eclipse treatment planning sys-
tem (Version 8.6.15, Varian Medical System, Inc., Palo
Alto, CA, US), and target delineation was performed with
the aid of the contrast-enhanced CT images.
We defined the gross tumor volume (GTV) as the
volume of primary tumor evident on contrast-enhanced
CT images. The clinical target volume (CTV) was deli-
neated on the basis of the GTV expanded by 5 mm. The
planning target volume (PTV) was defined as the CTV
with a 5-mm radial expansion and a 10-mm craniocaudal
expansion to account for errors caused by the daily setup
process and internal organ motion. The normal liver
volume was defined as the total liver volume minus the
GTV. All of the contours were drawn by the same
physician.
Treatment Planning and Dose Delivery
In our study, we prescribed 95% of total dose to cover ≥
95% of the PTV coverage in daily 1.8-Gy fractions while
keeping the minimum dose ≥93% of total dose and
maximum dose ≤107% of total dose and normalized all
plans to the mean dose of PTV. The guidelines for dose
prescription were as follows. When the normal liver
volume irradiated with > 50% of the isocenter dose was
< 25%, 25-50%, or 50-75%, the total dose prescribed was
> 59.4 Gy, 45-54 Gy, and 41.4 Gy, respectively [19]. No
Kuo et al.Radiation Oncology 2011, 6:76
http://www.ro-journal.com/content/6/1/76
Page 2 of 9

patient received whole liver irradiation. The constraints
for the organs at risk (OARs), can be seen in Table 1.
These were imposed in terms of the TD
5/5
to ensure
that the maximal tolerated doses to the normal liver,
stomach, kidneys, and spinal cord were not exceeded
[11]. Six-or 10-MV photon beams were used, depending
on the tumor location, and the same energy was used
for each patient and for all three methods.
For each patient, three different plans (3DCRT, IMRT,
and RapidArc) were calculated using the Eclipse planning
system with the 120-leaf multi-leaf collimator (MLC) (Var-
ian Medical Systems). For the 3DCRT and IMRT plans, all
the gantry angles and numbers of radiation fields (range,
4-5) were manually selected on the basis of the morpholo-
gical relationship between the PTV and OARs to cover at
least 95% of the PTV and spare the OARs. A dose rate of
400 MU/min was used. For RapidArc, the plans were opti-
mized using the two-arc technique with gantry angle run-
ning counterclockwise from 179° to 181° and clockwise
from 181° to 179° and with the dose rate varied between 0
MU/min and 600 MU/min (upper limit). The optimization
constraints for OARs using RapidArc were the same as the
constraints in Table 1.
Plan Evaluation
1. PTV coverage
ThedosetothePTVwasevaluatedusingDVHs
with the following parameters:
a. V
x%
means the volume receiving ≥x% of the pre-
scribed dose. For example, the V
100%
of the PTV was
used to prescribe the PTV coverage, and V
107%
was
used to represent the hot spot in the PTV.
b. The conformity index (CI) = (V
PTV
/TV
PV
)/(TV
PV
/
V
TV
)=V
PTV
×V
TV
/TV
PV2
, where V
PTV
is the volume
of the PTV, TV
PV
is the portion of the V
PTV
within
the prescribed isodose line, and V
TV
is the treated
volume of the prescribed isodose line [17,20]. The CI
represented the dose fit of the PTV relative to the
volume covered by the prescribed isodose line. The
smaller and closer the value of CI is to 1, the better
the conformity of the PTV.
c. The homogeneity index (HI) = D
5%
/D
95%
,where
D
5%
and D
95%
are the minimum doses delivered to
5% and 95% of the PTV [17,21]. HI is a ratio that is
used to evaluate the homogeneity of the PTV. The
smaller and closer the value of HI is to 1, the better
the homogeneity of the PTV.
2. OARs sparing
a. V
nGy
is the percentage of organ volume receiving ≥
nGy.Inthisstudy,V
40 Gy
was the percentage of the
normal liver volume receiving ≥40 Gy, which repre-
sents high-dose exposure for the normal liver. In con-
trast, V
10 Gy
was the percentage of the normal liver
volume receiving ≥10 Gy, which represented low-
dose exposure for the normal liver.
b. We used the normal tissue complication probabil-
ity (NTCP), from the Lyman model, to measure the
probability of RT complications in the normal liver
[22]. In the NTCP model,
NTCP =1
√
2π
x
−∞
exp(−t
2
/2)dt =1
2[1+erf (x
√
2)
]
(1)
x=EUD −TD50(1)
m×TD50(1) ,EUD =
i
vi×(Di)1/n
n
(2)
where EUD is the equivalent uniform dose, converted
from the dose-volume pairs [D
i
,v
i
], to describe the dose
which, if delivered uniformly to the entire organ, would
achieve the same effect as the given heterogeneous dose
distribution demonstrated by the DVH. The TD
50
(1) is
the dose to the whole liver that would result in a 50%
probability of toxicity. The parameter “m”is the steep-
ness of the dose-complication curve for a fixed partial
volume. The parameter “n”is the slope of the complica-
tion probability, which determines the dose-volume rela-
tionship for the irradiated normal liver. In this study, the
following values for the parameters were used: n = 0.32,
m = 0.15, and TD
50
(1) = 40 Gy [23].
Statistical Analyses
The dosimetric differences among the three treatments
for the nine patients were analyzed using the Friedman
test. When a significant difference (p< 0.05) was found,
the difference between two treatments for each effect
was further examined by Wilcoxon signed-rank test. All
analyses were performed using SPSS software, version
15.0 (SPSS Inc., Chicago, IL).
Results
PTV Coverage, CI, and HI
The mean gross tumor volume (GTV) was 979.3 ± 497.2
cm
3
(range, 346.5-2019.3 cm
3
). The mean planned
tumor volume (PTV) was 1734.2 ± 923.0 cm
3
(range,
Table 1 The dose constraints of organ at risk
OAR Dose constraints
Normal liver Mean dose ≤26 Gy
Stomach Maximum dose ≤54 Gy
Kidney At least one side of kidney ≤23 Gy (mean dose)
Spinal cord Maximum dose ≤47 Gy
(Maximum dose of spinal cord plus 5-mm margin ≤45 Gy)
OAR: Organ at risk.
Kuo et al.Radiation Oncology 2011, 6:76
http://www.ro-journal.com/content/6/1/76
Page 3 of 9
859.6-3253.4 cm
3
). The mean normal liver volume was
1632.4 ± 539.0 cm
3
(range, 933.7-2270.6 cm
3
). None of
the PTVs included the whole liver. The prescribed total
dose was 49.4 ± 1.9 Gy (range, 45-50.4 Gy). The dose
rate of RapidArc varied between 0 MU/min and 461
MU/min. The typical dose distributions and dose-
volume histograms (DVH) for PTV and OARs are
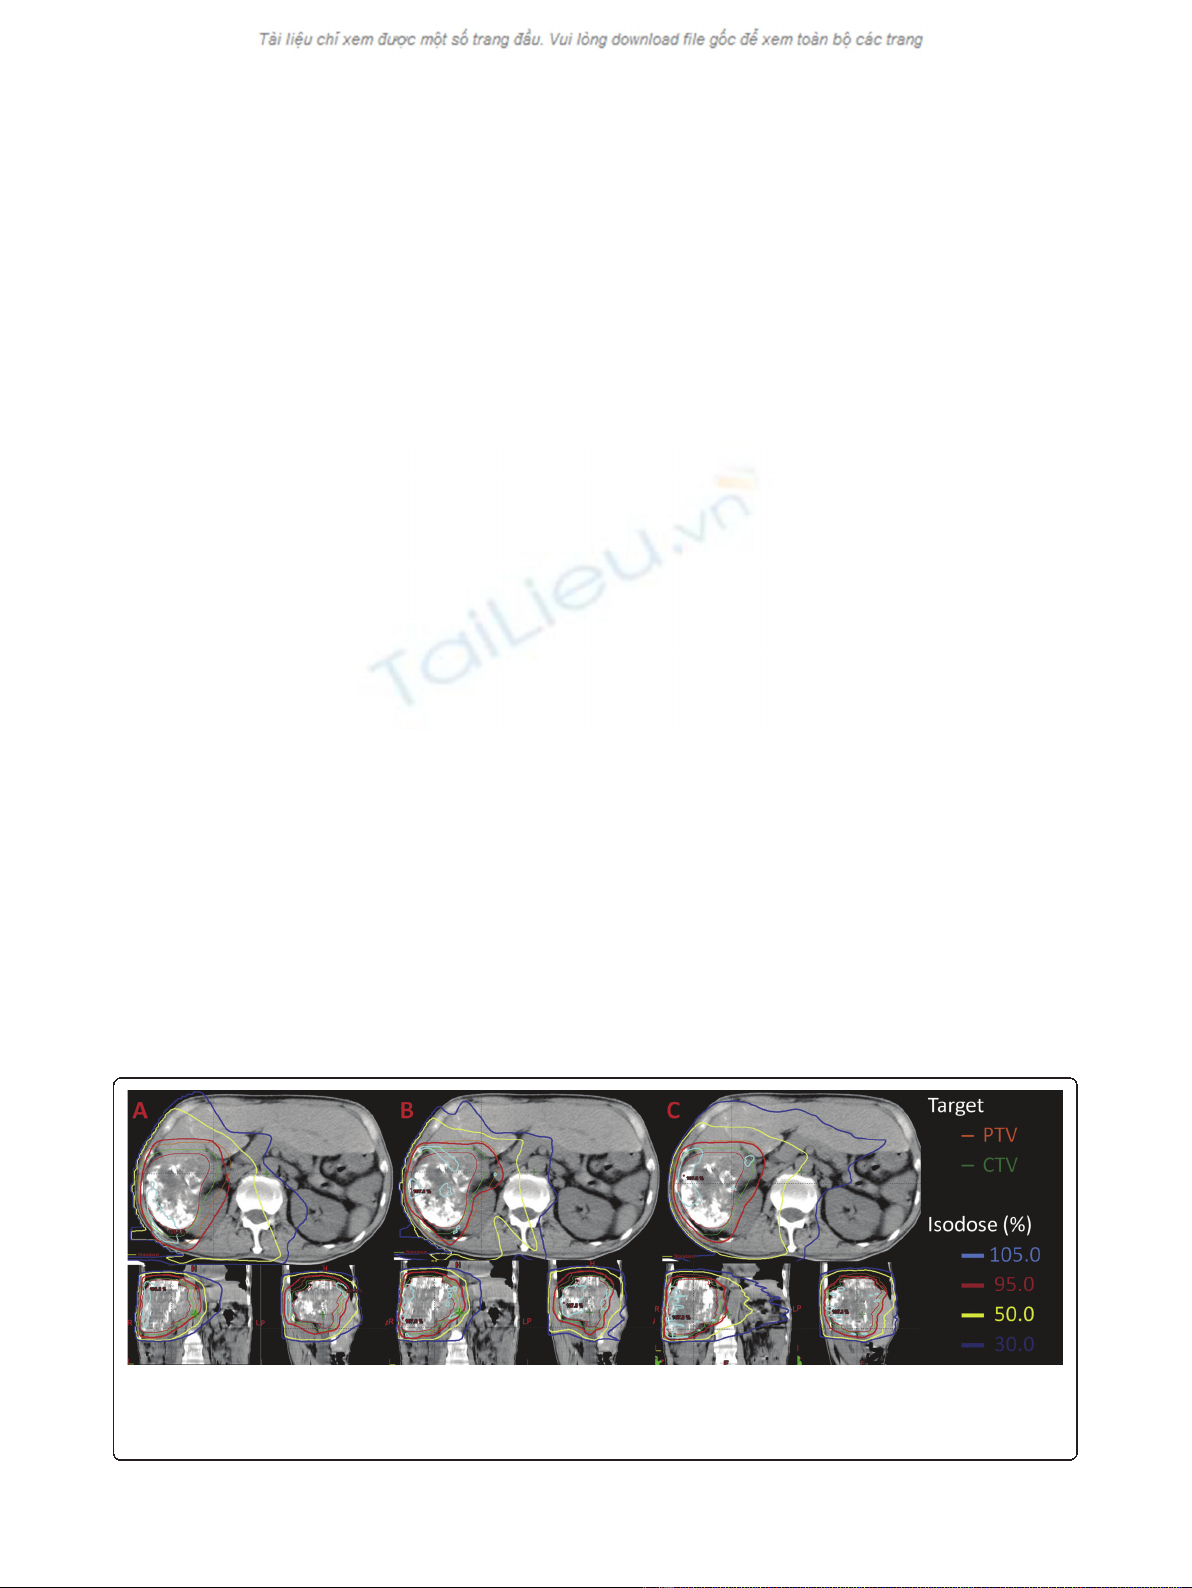
showninFigure1and2,respectively. In Figure 1C,
RapidArc achieved better conformality to the 95% iso-
dose line of the PTV than did 3DCRT and IMRT. In
addition, RapidArc also achieved better spinal cord spar-
ing to the 50% isodose line than did 3DCRT and IMRT.
However, RapidArc resulted in higher coverage at the
30% isodose line in the normal liver as compared with
3DCRT (Figure 1A) or IMRT (Figure 1B), which means
higher low-dose exposure occur for the normal liver
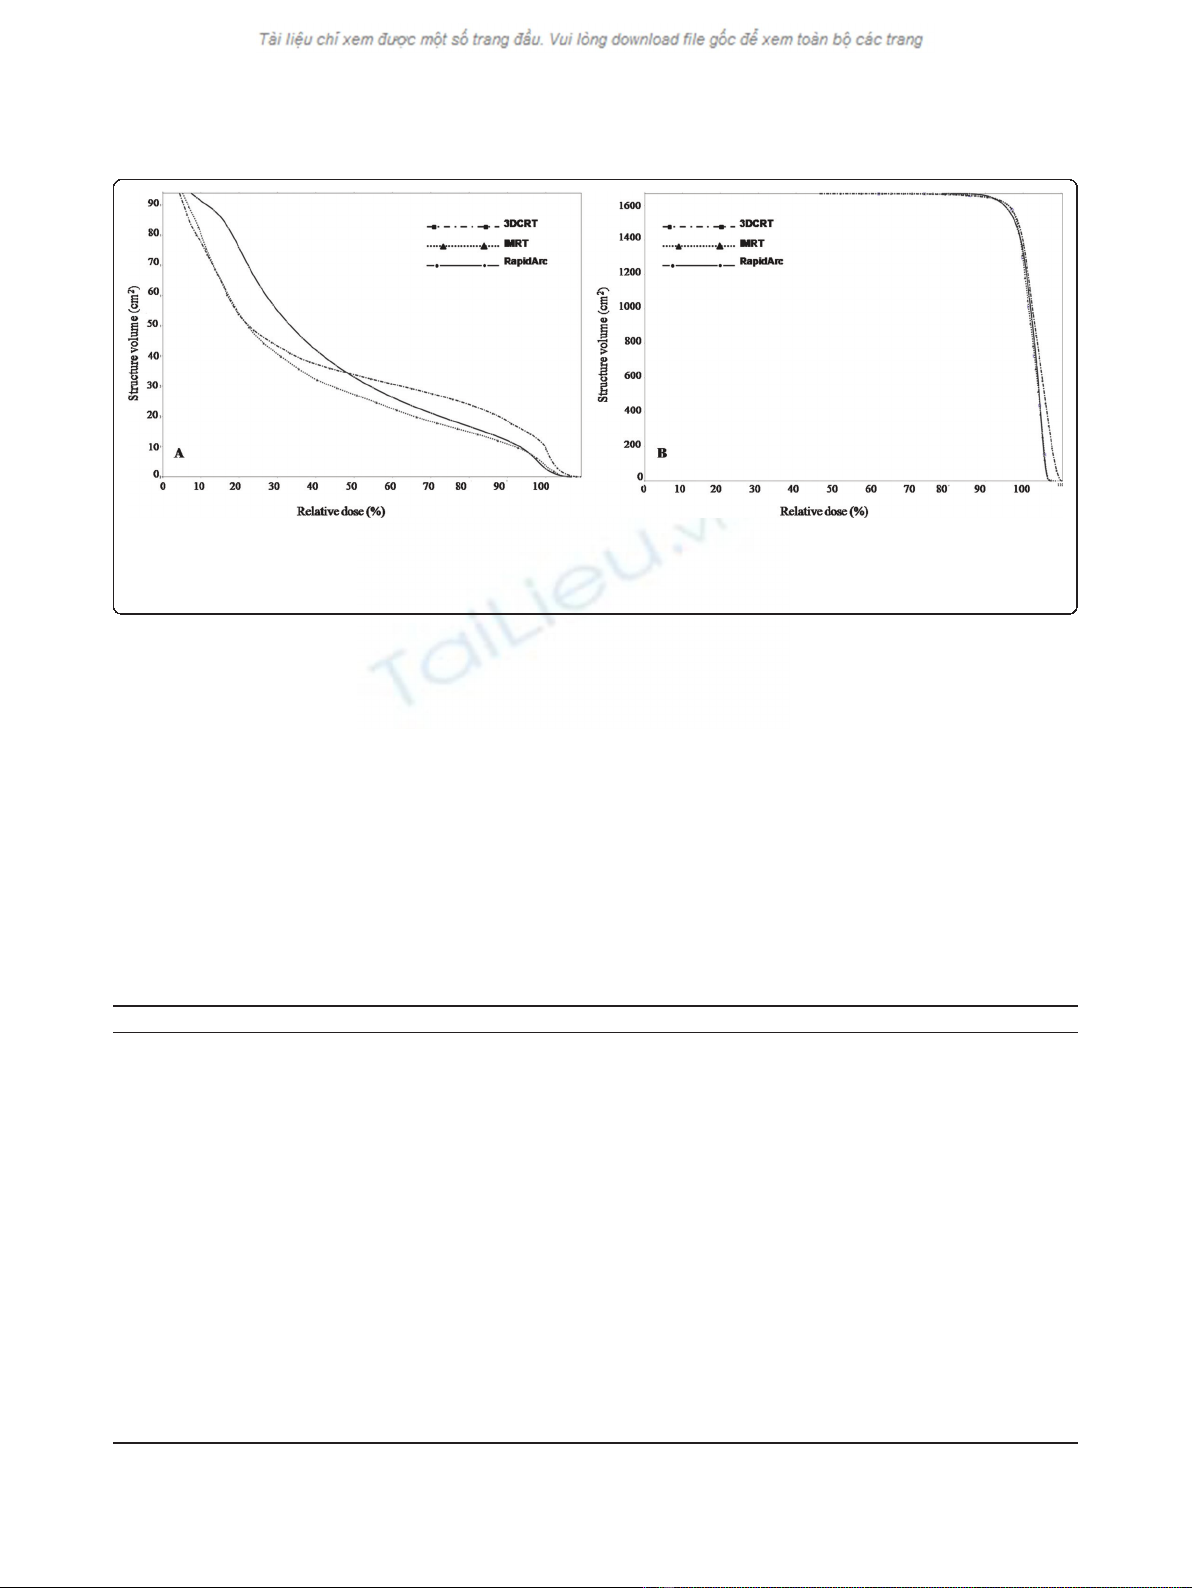
with RapidArc. In Figure 2, the right DVH showed that
all of the PTVs were fixed between V
95%
and V
107%
,
without any significant differences. The left DVH
showed that the low-dose distribution in the normal
liver was greater for RapidArc than for 3DCRT or
IMRT, and the high-dose distribution was greater for
3DCRT than for IMRT or RapidArc.
Table 2 summarizes the results for the investigated
DVH-parameters, including CTV coverage, PTV cover-
age, monitor unit (MU) dose and OAR dose for the 9
patients. Table 3 shows the differences among the
three methods with regard to the DVH parameters.
For target coverage, all V
95%
of CTV for these three
techniques gave at least 99% of the prescribed dose
without any significant difference (p=1.00).Forthe
PTV coverage, the mean CI of RapidArc (1.12 ± 0.05)
was significantly lower than that of IMRT (1.19 ± 0.06)
and 3DCRT (1.286 ± 0.11) (p<0.05).TheV
95%
,and
V
100%
valus for PTVs and HI were 95.50 ± 2.41, 76.81
± 5.95 and 1.13 ± 0.05 (3DCRT), 95.27 ± 1.99, 77.88 ±
4.27 and 1.13 ± 0.04 (IMRT), and 95.31 ± 1.64, 77.47
± 2.64 and 1.12 ± 0.03 (RapidArc), respectively, with
no significant differences among methods (p= 1.00,
1.00 and 0.69, respectively). For the hot spot sparing,
the mean V
107%
of the PTV was significantly highest
for 3DCRT (7.49 ± 7.92) and the lowest was RapidArc
(1.74 ± 2.82); this indicatesthattherewasbetterhot-
spot sparing of the PTV with RapidArc than with
IMRT or 3DCRT (p< 0.05).
OARs Sparing
The mean doses to the normal liver for each method
were 21.58 ± 3.01 Gy (3DCRT), 19.31 ± 2.89 Gy
(IMRT), and 21.97 ± 2.61 Gy (RapidArc), with a signif-
icantly lower mean dose to the normal liver with
IMRT than with 3DCRT or RapidArc (p< 0.05). The
high-dose regions of the normal liver were higher for
V
40 Gy
and V
30 Gy
with 3DCRT (23.05 ± 4.06 and
32.10 ± 6.80) than with IMRT (18.61 ± 4.13 and 26.23
±5.87)(p< 0.01) or RapidArc (18.85 ± 3.97 and 27.77
± 5.34) (p< 0.05). The low-dose region of the normal
liver was higher for V
10 Gy
with RapidArc (75.77 ±
13.13) than with IMRT (57.24 ± 10.02) (p<0.01)or
3DCRT (60.55 ± 10.24) (p< 0.05). In Table 3, the
NTCP value for 3DCRT (7.57 ± 4.36) was significantly
higher than that for IMRT (3.98 ± 3.00) (p<0.01)or
RapidArc (4.38 ± 2.69) (p<0.05),buttherewasno
significant difference in the NTCP between IMRT and
RapidArc (p= 0.26). For the other OARs, there were
no significant differences in dose among the three
methods, except for a lower mean dose to the stomach
and left kidney, respectively, with IMRT (20.63 ± 15.26
Gy and 8.36 ± 4.60 Gy) than with 3DCRT (23.16 ±
16.50 Gy and 11.37 ± 6.62 Gy) (p< 0.05). The maxi-
mum dose to the spinal cord (D
1%
) was equal for all
three methods.
Figure 1 The comparison of isodose distributions of PTV and OAR in 3DCRT, IMRT and RapidArc.A:3DCRT,B:IMRTandC:RapidArc.
RapidArc achieved better conformality to the 95% isodose line (red line) of the PTV and better spinal cord sparing to the 50% isodose line
(yellow line) as compared with 3DCRT and IMRT. However, RapidArc obtained higher 30%-isodose coverage (blue line) of volume of the normal
liver than did 3DCRT and IMRT.
Kuo et al.Radiation Oncology 2011, 6:76
http://www.ro-journal.com/content/6/1/76
Page 4 of 9
Efficiency Analysis
IMRT had three times the MUs (1165.44 ± 170.68) of
RapidArc (323.78 ± 60.65) and 3DCRT (322.33 ± 28.62)
(p< 0.01). There was no significant difference in the
numbers of MUs between 3DCRT and RapidArc (p=
0.859).
Discussion
Historically, the role of RT in HCC has been limited
because of the risk of RILD caused by whole liver irra-
diation. Improved knowledge of partial liver RT has cre-
ated renewed in using RT with HCC and, furthermore,
technical advancements in 3DCRT have allowed higher
doses to targeted to the tumors while minimizing expo-
sure of surrounding liver tissue. Recently, more and
more types of conformal RT have been developed to
deliver highly conformal treatment with minimal
damage to surrounding normal liver parenchyma,
including IMRT, image-guided radiotherapy (IGRT) and
stereotactic body radiotherapy (SBRT) [24]. RapidArc is
a novel form of volumetric intensity-modulated RT that
has the advantages of a short treatment time, fewer
MUs and the availability of highly conformal treatment
plans. Several investigations have demonstrated the
Figure 2 The comparison of DVHs for PTV and normal liver in 3DCRT, IMRT and RapidArc. Right figure = DVHs of PTV. These three
techniques produced similar homogeneity of the PTV. Left figure = DVHs of normal liver. RapidArc obtained the higher low-dose distribution in
the normal liver compared with 3DCRT and IMRT. On the other hand, 3DCRT obtained the high-dose distribution in the normal liver compared
with IMRT and RapidArc.
Table 2 The summary of all investigated DVH-parameters as mean values ± standard deviation (SD)
3DCRT IMRT RA
CTV V
95%
(%) 99.57 ± 0.39 99.65 ± 0.42 99.69 ± 0.42
PTV V
95%
(%) 95.50 ± 2.41 95.27 ± 1.99 95.31 ± 1.64
V
100%
(%) 76.81 ± 5.95 77.88 ± 4.27 77.47 ± 2.64
V
107%
(%) 7.49 ± 7.92 3.71 ± 3.00 1.74 ± 2.82
CI 1.286 ± 0.11 1.19 ± 0.06 1.12 ± 0.05
HI 1.13 ± 0.05 1.13 ± 0.04 1.12 ± 0.03
Normal liver D
mean
(Gy) 21.58 ± 3.01 19.31 ± 2.89 21.97 ± 2.61
V
40 Gy
(%) 23.05 ± 4.06 18.61 ± 4.13 18.85 ± 3.97
V
30 Gy
(%) 32.10 ± 6.80 26.23 ± 5.87 27.77 ± 5.34
V
20 Gy
(%) 42.12 ± 7.56 37.16 ± 8.65 43.67 ± 8.18
V
10 Gy
(%) 60.55 ± 10.24 57.24 ± 10.02 75.77 ± 13.13
NTCP 7.57 ± 4.36 3.98 ± 3.00 4.38 ± 2.69
Stomach D
mean
(Gy) 23.16 ± 16.50 20.63 ± 15.26 23.42 ± 13.70
Left Kidney D
mean
(Gy) 11.37 ± 6.62 8.36 ± 4.60 7.69 ± 5.06
Right Kidney D
mean
(Gy) 14.99 ± 13.11 13.11 ± 11.42 11.84 ± 10.41
Spinal Cord D
1%
(Gy) 38.94 ± 7.62 43.89 ± 2.01 38.51 ± 8.90
MU 322.33 ± 28.62 1165.44 ± 170.68 323.78 ± 60.65
PTV: planned tumor volume; MU: monitor unit; 3DCRT: 3-D conformal radiation therapy; IMRT: intensity-modulated radiation therapy; RA: RapidArc.
Kuo et al.Radiation Oncology 2011, 6:76
http://www.ro-journal.com/content/6/1/76
Page 5 of 9


%20--%3e%3cdefs%3e%3cstyle%3e%20.st0%20{%20fill:%20%23fff;%20}%20.st1%20{%20fill:%20%237800fa;%20}%20%3c/style%3e%3c/defs%3e%3cpath%20class='st1'%20d='M117.78,12.18H43.11c2.9,3.47,4.65,7.94,4.65,12.82,0,5.6-2.3,10.66-6.01,14.29h76.02l7.22-13.56-7.22-13.56Z'/%3e%3cg%3e%3cpath%20class='st0'%20d='M53.58,26.17h-.59v-1.46h.59v-4.96h2.83c1.78,0,2.67.94,2.67,2.82v5.76c0,1.87-.89,2.81-2.67,2.81h-2.83v-4.96ZM55.36,21.37v3.34h1.1v1.46h-1.1v3.34h1.01c.61,0,.91-.37.91-1.1v-5.93c0-.74-.3-1.1-.91-1.1h-1.01Z'/%3e%3cpath%20class='st0'%20d='M65.99,31.14h-1.8l-.31-2.07h-2.19l-.31,2.07h-1.64l1.82-11.39h2.62l1.82,11.39ZM65.28,18.04c-.25.46-.51.77-.75.94-.21.15-.47.22-.79.22-.26,0-.57-.07-.92-.22l-.38-.15c-.14-.05-.26-.07-.37-.07-.3,0-.53.18-.71.54l-.91-.68c.25-.46.51-.77.75-.94.21-.14.48-.21.79-.21.26,0,.57.07.92.21l.38.15c.14.05.26.07.37.07.3,0,.53-.18.71-.54l.91.68ZM61.91,27.52h1.73l-.87-5.76-.87,5.76Z'/%3e%3cpath%20class='st0'%20d='M74.53,26.89v1.52c0,1.91-.89,2.86-2.67,2.86s-2.67-.95-2.67-2.86v-5.93c0-1.91.89-2.86,2.67-2.86s2.67.95,2.67,2.86v1.11h-1.69v-1.22c0-.75-.31-1.12-.93-1.12s-.93.37-.93,1.12v6.15c0,.74.31,1.11.93,1.11s.93-.37.93-1.11v-1.63h1.69Z'/%3e%3cpath%20class='st0'%20d='M81.4,31.14h-1.8l-.31-2.07h-2.19l-.31,2.07h-1.64l1.82-11.39h2.62l1.82,11.39ZM75.9,19.2l1.52-1.91h1.71l1.51,1.91h-1.61l-.76-.95-.75.95h-1.61ZM77.32,27.52h1.73l-.87-5.76-.87,5.76ZM83.1,15.99l-1.76,1.91h-1.26l1.17-1.91h1.86Z'/%3e%3cpath%20class='st0'%20d='M84.86,19.75c1.78,0,2.67.94,2.67,2.82v1.48c0,1.87-.89,2.81-2.67,2.81h-.85v4.28h-1.79v-11.39h2.64ZM84.01,21.37v3.86h.85c.58,0,.87-.36.87-1.08v-1.71c0-.71-.29-1.07-.87-1.07h-.85Z'/%3e%3cpath%20class='st0'%20d='M93.51,19.75c1.78,0,2.67.94,2.67,2.82v1.48c0,1.87-.89,2.81-2.67,2.81h-.85v4.28h-1.79v-11.39h2.64ZM92.66,21.37v3.86h.85c.58,0,.87-.36.87-1.08v-1.71c0-.71-.29-1.07-.87-1.07h-.85Z'/%3e%3cpath%20class='st0'%20d='M98.8,31.14h-1.79v-11.39h1.79v4.88h2.03v-4.88h1.83v11.39h-1.83v-4.88h-2.03v4.88Z'/%3e%3cpath%20class='st0'%20d='M105.36,24.55h2.46v1.62h-2.46v3.34h3.09v1.63h-4.88v-11.39h4.88v1.63h-3.09v3.18ZM108.17,17.29l-1.76,1.91h-1.26l1.17-1.91h1.86Z'/%3e%3cpath%20class='st0'%20d='M112.2,19.75c1.78,0,2.67.94,2.67,2.82v1.48c0,1.87-.89,2.81-2.67,2.81h-.85v4.28h-1.79v-11.39h2.64ZM111.35,21.37v3.86h.85c.58,0,.87-.36.87-1.08v-1.71c0-.71-.29-1.07-.87-1.07h-.85Z'/%3e%3c/g%3e%3ccircle%20class='st1'%20cx='25'%20cy='25'%20r='20'/%3e%3cpath%20class='st0'%20d='M32.78,19.27c2.92,0,4.43,2.55,5.28,5.33l.71,2.17c.14.38-.33.75-.71.75h-5.61c.19-.33.24-.71.09-1.08l-.75-2.45c-.43-1.32-.99-2.64-1.79-3.77.75-.57,1.65-.94,2.78-.94h0ZM25,18.38c3.25,0,4.9,2.78,5.89,5.89l.76,2.45c.14.42-.33.8-.8.8h-11.69c-.42,0-.94-.38-.8-.8l.75-2.45c.99-3.11,2.64-5.89,5.89-5.89h0ZM25,11.35c1.74,0,3.11,1.37,3.11,3.11s-1.37,3.11-3.11,3.11-3.11-1.41-3.11-3.11,1.41-3.11,3.11-3.11h0ZM17.27,19.27c1.08,0,1.98.38,2.73.94-.8,1.13-1.37,2.45-1.74,3.77l-.8,2.45c-.14.38-.05.75.09,1.08h-5.56c-.42,0-.9-.38-.75-.75l.71-2.17c.9-2.78,2.41-5.33,5.33-5.33h0ZM17.27,12.91c1.51,0,2.78,1.27,2.78,2.83s-1.27,2.83-2.78,2.83-2.83-1.27-2.83-2.83,1.27-2.83,2.83-2.83h0ZM32.78,12.91c1.56,0,2.78,1.27,2.78,2.83s-1.23,2.83-2.78,2.83-2.83-1.27-2.83-2.83,1.27-2.83,2.83-2.83h0ZM27.07,28.56v.09c0,.57-.24,1.08-.61,1.46h0v.05c-.38.33-.9.57-1.46.57s-1.08-.24-1.46-.61h0c-.38-.38-.61-.9-.61-1.46v-.09h1.41v.09c0,.19.05.38.19.47v.05c.09.09.28.19.47.19s.38-.09.47-.19v-.05c.14-.09.24-.28.24-.47t-.05-.09h1.41ZM30.99,28.56v.09c0,1.65-.66,3.16-1.74,4.24-1.08,1.08-2.59,1.79-4.24,1.79s-3.16-.71-4.24-1.79l-.05-.05c-1.04-1.08-1.7-2.55-1.7-4.2v-.09h1.41v.09c0,1.27.47,2.4,1.27,3.25h.05c.85.85,1.98,1.37,3.25,1.37s2.4-.52,3.25-1.37c.85-.8,1.37-1.98,1.37-3.25v-.09h1.37ZM34.99,28.56v.09c0,2.78-1.13,5.28-2.92,7.07-1.79,1.79-4.29,2.92-7.07,2.92s-5.23-1.13-7.07-2.92c-1.79-1.79-2.92-4.29-2.92-7.07v-.09h1.41v.09c0,2.4.94,4.53,2.5,6.08,1.56,1.56,3.72,2.5,6.08,2.5s4.52-.94,6.08-2.5c1.56-1.56,2.5-3.68,2.5-6.08v-.09h1.41Z'/%3e%3c/svg%3e)