
RESEARC H Open Access
Differential expression of interferon-induced
microRNAs in patients with chronic hepatitis C virus
infection treated with pegylated interferon alpha
Carolina Scagnolari
1*
, Pompea Zingariello
2
, Jacopo Vecchiet
2
, Carla Selvaggi
1
, Delia Racciatti
2
, Gloria Taliani
3
,
Elisabetta Riva
4
, Eligio Pizzigallo
2
, Guido Antonelli
1
Abstract
There have been reports of in-vitro interferon (IFN)-mediated antiviral activity against the hepatitis C virus (HCV)
through microRNAs (miRNAs). The main aim of this study was to evaluate the expression of several miRNAs (miR-1,
miR-30, miR-128, miR-196, miR-296) in peripheral blood mononuclear cells (PBMCs) from healthy individuals after in
vitro IFN-treatment and in PBMCs from patients with chronic hepatitis C (CHC) before and 12 hours after the first
injection of pegylated IFN alpha. We demonstrated that expression of these miRNAs could be recorded in PBMCs
collected from healthy individuals before and after in-vitro IFN alpha treatment. Our analysis revealed that the
levels of expression of all miRNAs investigated in patients with CHC were different to those in healthy individuals.
When levels of the miRNAs were measured 12 hours after the first IFN injection, increases in expression levels of
IFN-induced miRNAs were observed in 25-50% of patients, depending on the type of miRNA examined. No correla-
tions were observed between HCV viral load, alanine aminotransferase status and expression of miRNA. Together
these findings suggest that: (i) IFN alpha in-vitro treatment of PBMCs leads to a transcriptional induction of all miR-
NAs investigated; (ii) miRNAs can be induced differentially by IFN treatment in patients with HCV. Given the impor-
tance of miRNAs in defending the host against virus infections, it is possible that IFN-induced miRNAs may
represent an important determinant of the clinical outcome of IFN therapy in HCV infection.
Introduction
MicroRNAs (miRNAs) are an important class of small
non-coding RNA molecules that have recently come to
prominence as critical regulators in a wide array of
mechanisms of cell physiology. There is increasing evi-
dence that miRNAs may also have an important func-
tion in viral replication and may be used by host cells to
control viral infection [1,2]. Indeed, it has been demon-
strated that viral RNAs and the miRNA machinery may
interact in various ways. First, mammalian viruses
encode miRNAs that can act on both the control of
viral genes and of cellular genes by repressing their
expression. Second, cellular miRNAs may recognize viral
RNAs and silence them, or control the expression of a
cellular protein necessary for the virus life cycle.
It has also been suggested that miRNAs may be an
effector in the classical vertebrate innate immune system
[3], and recently an even more direct link between IFN
and miRNAs has emerged [4]. Interferon (IFN) beta has
been reported as modulating the expression of several
cellular miRNAs that are capable of inhibiting hepatitis
C virus (HCV) replication and infection, because they
have sequence-predicted targets within the HCV geno-
mic RNA. In addition, Pederson and co-authors
reported that IFN beta downregulated the expression of
miR-122, which has been implicated in the control of
HCV RNA replication. This finding could lead to a bet-
ter understanding of the factors involved in the failure
of IFN therapy in patients with chronic hepatitis C
(CHC). Due to different viral, environmental and host
factors, a sustained virological response is achieved in
about 50% of patients infected with HCV genotype 1
and in about 80% of patients infected with HCV geno-
types 2 or 3; more importantly, despite extensive
* Correspondence: carolina.scagnolari@uniroma1.it
1
Department of Molecular Medicine, Laboratory of Virology, “Sapienza”
University of Rome; Rome, Italy
Full list of author information is available at the end of the article
Scagnolari et al.Virology Journal 2010, 7:311
http://www.virologyj.com/content/7/1/311
© 2010 Scagnolari et al; licensee BioMed Central Ltd. This is an Open Access article distributed under the terms of the Creative
Commons Attribution License (http://creativecommons.org/licenses/by/2.0), which permits unrestricted use, distribution, and
reproduction in any medium, provided the original work is properly cited.

examination of the biological and clinical effects of IFN
in patients with CHC, the prediction of treatment
responses in individual patients still remains difficult
[5,6].
In the framework of a study aimed at further charac-
terizing the state of responder, and at improving our
knowledge and understanding of IFN therapy effects on
patients with CHC, we undertook in-vitro and ex-vivo
expression analyses of cellular miRNAs that had pre-
viously been reported as being involved in IFN-mediated
antiviral activity against HCV [4], using real-time quan-
titative reverse transcription polymerase chain reaction
(RT-PCR) assay. The ex-vivo analysis was undertaken
before and 12 hours after the first injection of pegylated
IFN alpha in CHC patients. Gene expression analysis of
MxA, a well-characterized IFN type I gene, was also
undertaken as a control. The association between
miRNA expression and alanine aminotransferase (ALT)
status, HCV genotype, HCV-RNA and response to ther-
apy was evaluated.
Methods
Patients and healthy blood donors
Peripheral blood samples were obtained from 12
patients with hepatitis C and ten healthy volunteers.
The patients with HCV were treated by subcutaneous
injection with either 180 μgPegIFNalpha-2a
(PEGASYS; Hoffmann-LaRoche, Basel, Switzerland) (n =
9) or 1.5 μg/kg PegIFN alpha-2b (PegIntron; Schering-
Plough,Kenilworth,NJ,USA)(n=3)plusribavirin.
Treatment duration was 24 or 48 weeks according to
HCV genotype. Patients who were HCV-RNA negative
after 24 weeks of post-treatment follow-up were consid-
ered sustained viral responders. The demographic and
clinical data of patients at the time of sample collection
aresummarizedinTable1.Noneofthepatientshad
been treated previously with IFNs or other immunosup-
pressive therapy (treatment-naïve patients). Written
informed consent was obtained from each patient, and
the study was approved by the Ethics Committees and/
or Institutional Review Boards of the participating insti-
tutions. PBMCs from healthy donors were treated with
100 international unit (IU)/ml of IFN alpha [leukocyte,
Alfaferone (AlfaWassermann, Bologna, Italy)] for 20
hours, the incubation time selected in previous studies
aimed at the measurement of IFN-stimulated genes
(ISGs) [7,8].
PBMCs from CHC patients were collected at baseline
and 12 hours after the first injection of pegylated IFN
alpha. The timing was determined by the following:
first, only two sample collections (i.e., pre- and post-
dose) were considered to be suitable by the Ethics Com-
mittee; second, previous reports had shown significant
changes in ISGs expression 12 hours after IFN type I
administration in patients with different chronic dis-
eases, including CHC [9-14].
Blood sampling
Venous peripheral blood from each patient and healthy
control was drawn into tubes containing ethylenediami-
netetraacetic acid. Peripheral blood mononuclear cells
(PBMCs) were separated using Ficoll-Hypaque gradient
sedimentation; 5 × 10
6
PBMCs were collected, pelleted
and frozen at -80°C until examined. After centrifuging,
plasma samples were stored at -80°C until required.
Taqman quantitative RT-PCR for MxA-mRNA
MxA gene transcripts in PBMCs from patients with
CHC and healthy individuals were quantified by a real
time 5’exonuclease RT-PCR Taqman assay using an
ABI 7000 sequence detector (Applied Biosystems,
Monza, Italy). Briefly, the total cellular RNA was
extracted from cells using the Trizol reagent, following
the manufacturer’s instructions, and was retrotran-
scribed as previously described [15]. Next the following
primer pair and probe for MxA were added to the uni-
versal PCR master mix (Applied Biosystems) at 300 and
100 nM, respectively, in a final volume of 50 mL. (for-
ward primer, 5’-CTGCCTGGCAGAAAACTTACC-3’;
reverse primer, 5’-CTCTGTTATTCTCTGGTGAGTCT
CCTT-3’; probe, 5’CATCACACATATCTGTAAATCTC
TGCCCCTGTTAGA-3’). Co-amplification of the beta-
glucuronidase gene (Assay-On-Demand, Hs99999908_mL,
Applied Biosystems) was used to normalize the amount of
total RNA present. The relative amount of each transcript,
normalized to beta-glucuronidase mRNA, was calculated
using the arithmetic formula (2 - ΔCt) or (2 - ΔΔCt)
according to the supplier’s guidelines (Applied
Biosystems).
Taqman quantitative RT-PCR for microRNAs
MicroRNAs (miR-1, miR-30, miR-128, miR-196, miR-
296) in PBMCs collected from patients with CHC and
healthy individuals were quantified by a real time 5’exo-
nuclease RT-PCR Taqman assay.
All primer and probes of each miRNA investigated
were present in the TaqMan microRNA assays pur-
chased from Applied Biosystems.
MiRNAs were extracted from the cells using the mir-
Vana miRNA Isolation Kit (Ambion, Austin, TX),
according to the manufacturer’s protocol. Applied Bio-
systems TaqMan MicroRNA Reverse Transcription Kit
(Applied Biosystems, Monza, Italy) was used (following
the manufacturer’s protocol) for reverse transcription
(RT) of extracted total miRNAs. Each RT reaction con-
tained 5 ng of extracted total miRNA, 3 μLofTaqMan
MicroRNA assays, 1.50 μL of RT10x buffer, 0.25 mM
each of dNTPs, 3.33 U/μL Multiscribe reverse
Scagnolari et al.Virology Journal 2010, 7:311
http://www.virologyj.com/content/7/1/311
Page 2 of 9

transcriptase and 0.25 U/μL RNase inhibitor. The 15 μL
reactions were incubated in a Biometra T3 Thermocycler
(MMedical, Italy) in a 96-well plate for 30 minutes at
16°C, 30 minutes at 42°C, 5 minutes at 85°C, and then
held at 4°C. For the real-time PCR step, amplification
was carried out using TaqMan MicroRNA assays
(Applied Biosystems) on the Applied Biosystems 7000
Real-Time PCR system. The 20 μL reaction included 1.33
μL RT product, 10 μL of TaqMan Universal PCR Master
Mix with no UNG and 1 μLofTaqManMicroRNA
assays. The reactions were incubated in a 96-well optical
plate at 95°C for 10 minutes, following by 40 cycles of 95°
C for 15 s and 60°C for 1 minute. Real-time PCRs for
each miRNA were run in triplicate. The relative expres-
sion levels of each miRNA were measured using the con-
stitutively expressed RNU6B as endogenous control The
expression of each miRNA relative to RNU6B was deter-
mined using the arithmetic formula (2 - ΔCt) or (2 -
ΔΔCt) according to the supplier’sguidelines(Applied
Biosystems).
Statistical analysis
All results are expressed as the mean ± standard devia-
tion (median). The coefficient of variation (CV) was
used to measure the interpatient variability in blood
concentrations of miRNAs and MxA. Levels of miRNAs
and MxA observed in PBMCs from three healthy indivi-
duals before and after the stimulation in vitro with IFN
alpha were compared using a T-test as suggested by
Bland and Altman [16]. Differences between patients
with CHC and healthy individuals, and between patient
groups, in terms of blood concentrations in miRNAs
and MxA, were compared using the Wilcoxon test. The
same test was used to assess differences between miR-
NAs and MxA expression levels in patients with CHC.
A Spearmen rho coefficient was calculated to assess the
correlation between pre-dose and HCV viral load, ALT
status. Significance was fixed at the 5% level. Analysis
was performed using spss version 13.0 for Windows.
Results
Baseline and in vitro IFN alpha induced expression of
microRNAs in PBMCs collected from healthy individuals
As there are no published reports about expression pro-
files of miR-1, miR-30, miR-128, miR-196, and miR-296
in PBMCs from normal individuals, our first investiga-
tion was of their expression in PBMCs from healthy
volunteers using real-time quantitative RT-PCR. The
expression of MxA in these individuals was also evalu-
ated for control purposes.
PBMCs isolated from healthy donors were found to
express all the miRNA considered with varying expression
levels, depending on the examined miRNA type. Specifi-
cally, the baseline miRNA values in PBMCs that were
determined using the equation (2 - ΔCt), according to the
supplier’s guidelines, ranged between 0.30 and 128.96.
MxA-mRNA levels were also found in PBMCs from all
healthy donors (Table 2).
We then examined whether leukocyte IFN alpha could
stimulate in-vitro expression of the miRNAs listed above
as previously reported for IFN beta. PBMCs, freshly iso-
lated from three healthy individuals, were treated in
vitro with IFN alpha at 100 IU/ml (leukocyte, Alfafer-
one), and levels of miRNA and MxA-mRNA were mea-
sured 20 hours later by quantitative real-time RT-PCR.
Again, levels of MxA transcripts were measured as posi-
tive controls for IFN action. The results showed that
IFN alpha in-vitro treatment of PBMCs leads to a tran-
scriptional induction of all miRNAs investigated as well
as MxA-mRNA (Figure 1). In particular, of the miRNAs
Table 1 Demographic and clinical characteristics of patients with chronic hepatitis C
Patient
no.
Sex Age HCV
GT*
Baseline
HCV-RNA
(copies/ml)
4 weeks
HCV-RNA
(copies/ml)
4-weeks
response*
12 weeks
HCV-RNA
(copies/ml)
12-
weeks
response
Ribavirin
(mg)
Weight,
(Kg)
Type
of peg
IFN
AST ALT FOLLOW-
UP
1 F 62 2a/2c 8224917 NEG R NEG R 800 70 Alfa 2a 28 31 SVR
2 F 69 2 19948356 NEG R NEG R 1000 78 Alfa 2a 28 30 SVR
3 F 39 2c 2748250 NEG R NEG R 800 64 alfa 2a 30 38 SVR
4 F 51 2a/2c 4486254 NEG R NEG R 1000 68 Alfa 2a 17 24 SVR
5 M 47 1b 1573026 6800 NR NEG R 1200 82 Alfa 2a 49 68 SVR
6 M 67 1a 6018477 21700 NR NEG R 1000 78 Alfa 2a 137 214 SVR
7 F 68 1b 941010 NEG R NEG R 1000 74 Alfa 2a 25 54 SVR
8 M 47 2a/2c 3347068 445000 NR 937560 NR 1000 80 Alfa 2b 93 172 NR
9 M 49 2a 2859813 437000 NR 378000 NR 1000 84 Alfa 2b 110 115 NR
10 F 44 1a 2505703 17500 NR 327000 NR 1200 68 Alfa 2a 23 26 NR
11 F 66 1b 21967894 1200000 NR 2550 NR 800 51 Alfa 2a 44 80 NR
12 F 42 1a 1469947 161000 NR 16100 NR 1000 72 Alfa 2b 73 110 NR
*GT, genotype; R, responder, SVR, sustained viral responder; NR, non-responder; IFN, interferon; HCV, hepatitis C virus; AST, aspartate aminotransferase; ALT,
alanine aminotransferase.
Scagnolari et al.Virology Journal 2010, 7:311
http://www.virologyj.com/content/7/1/311
Page 3 of 9
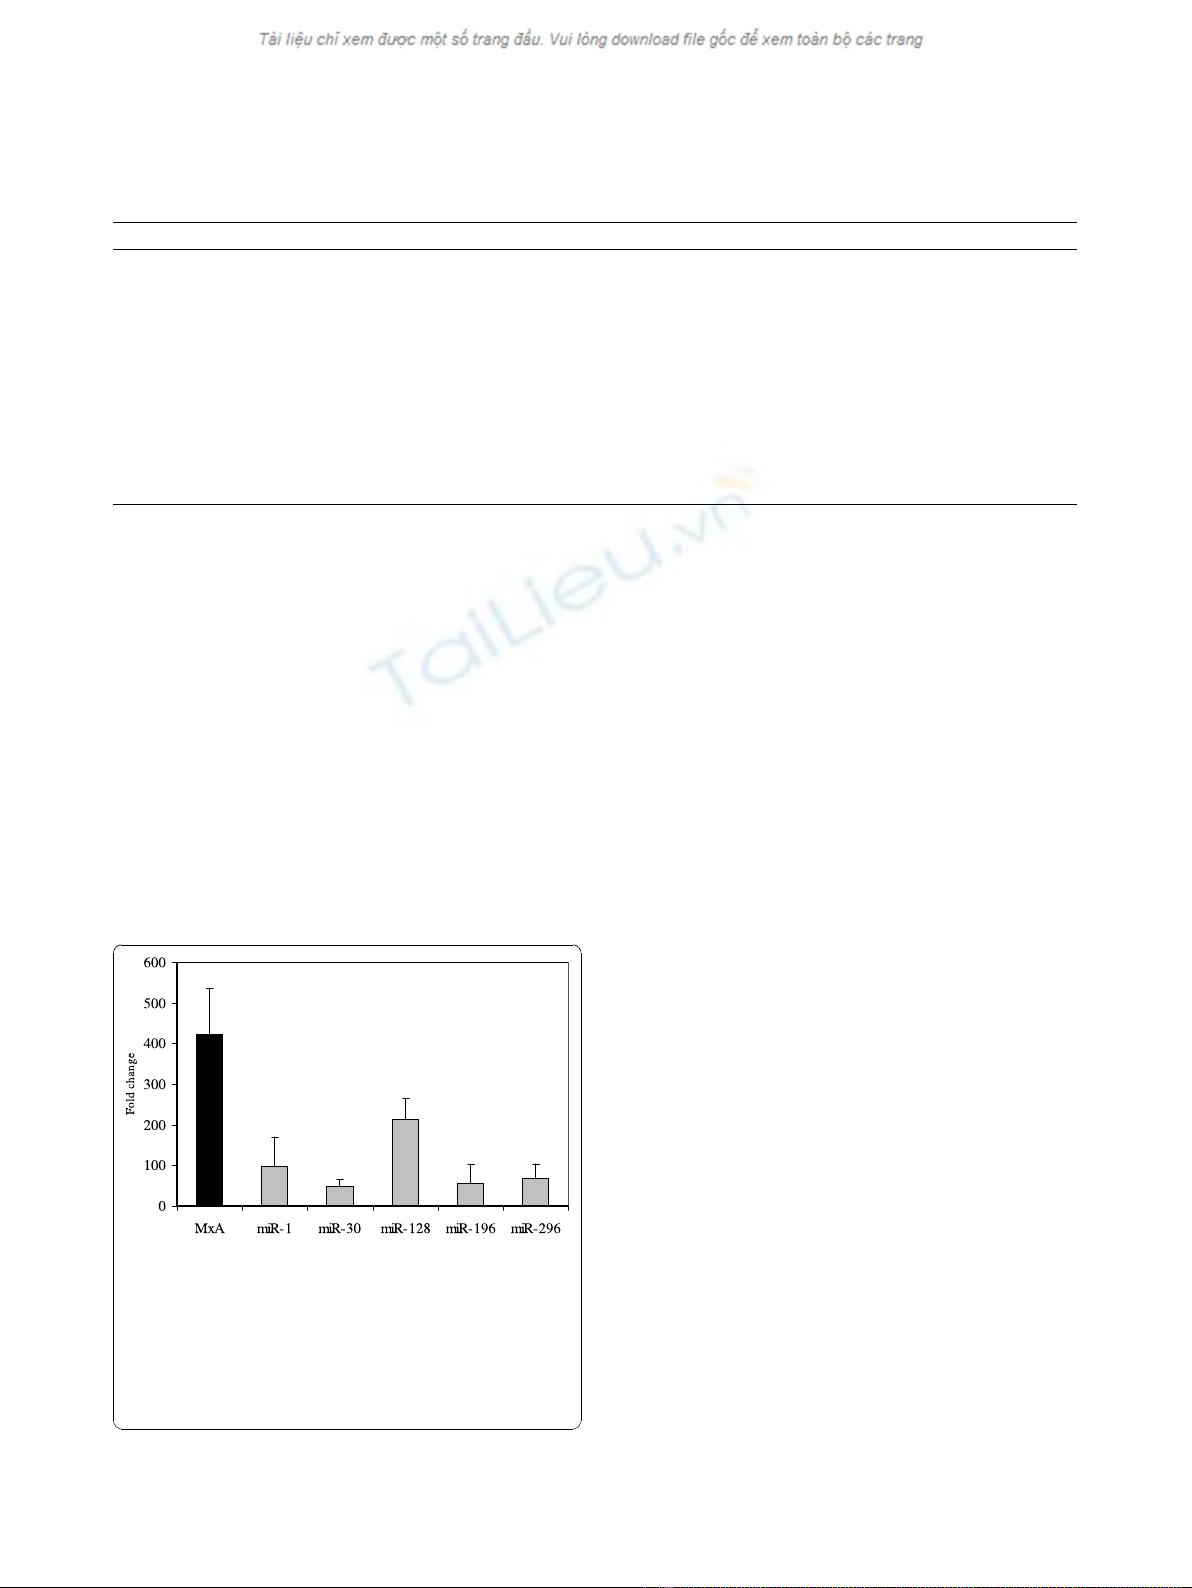
detected 20 hours post treatment, miR-1 and miR-128
had increased the most relative to untreated PBMCs,
whereas miRNA-30 had increased the least.
Expression of microRNAs in PBMCs collected from
patients with CHC before and after the first injection of
IFN alpha
Having established that a baseline expression of miR-1,
miR-30, miR-128, miR-196 and miR-296 could be
recorded in PBMCs collected from healthy donors
before and after in-vitro IFN alpha treatment, we
decided to analyse the expression of the same miRNAs,
as well as MxA, in 12 patients with CHC, of whom 7
were classified as responders and five as non-responders
to Peg-IFN alpha plus ribavirin therapy. Blood samples
were collected before and 12 hours after the first Peg-
IFN alpha administration.
Patients with CHC expressed baseline levels of all
examined miRNAs but the levels were highly variable
(CV > 100%). Importantly, the levels of expression of
miRNAs were different for patients with CHC compared
with healthy controls. There were higher levels of
almost all miRNAs in patients with CHC compared
with healthy individuals with the exception of miR-196
(Table 2). The differences did not reach statistical signif-
icance, probably because of the low number of patients
and the wide variability in miRNA expression observed
in them. As expected, the same trend was also observed
for MxA.
We then examined the expression of IFN-induced
miRNAs and MxA in patients with CHC after the first
injection of IFN alpha. The results are shown in Figure
2. It can be seen that 12 hours after IFN alpha adminis-
tration, a greater than 1.5-fold increase in MxA was
recorded in 58% of patients with CHC, whereas IFN
induction of miRNAs varied between 25% and 50%,
depending on the type of miRNA examined. The great-
est increase in miRNA and MxA levels after IFN injec-
tion were observed independently in patients no. 2
(miR-1, miR-196 and MxA), no. 3 (miR-30), no. 5 (miR-
128) and no.7 (miR-296).
In addition, different increases after IFN treatment
relative to baseline were observed for miR-1, miR-30,
miR-296 and MxA (p < 0.05) (Figure 3).
The baseline levels of miRNAs were also analysed to
determine whether the expression of these molecules
could be associated with the clinical outcome of IFN
therapy. The analyses showed that baseline levels of
miRNAs were not significantly different between
responders and non-responders (Table 3). However, a
trend toward higher baseline expression of miR-296 was
observed in non-responder compared with responder
Table 2 Baseline expression of microRNAs and MxA-mRNA in healthy controls and in patients with chronic
hepatitis C (CHC)
Healthy controls* n = 10 Patients with CHC* n = 12 Mean ratio CHC/healthy controls
miR-1 0.30 ±1.43
(0.36)
2.82 ±5.09
(0.10)
9.4
miR-30 128.96 ±93.99
(128.61)
255.57 ±466.62
(27.41)
1.98
miR-128 1.39 ±3.31
(0.05)
19.54 ±36.15
(0.03)
14.05
miR-196 1.85 ±3.21
(0.73)
0.81 ±1.52
(0.04)
0.43
miR-296 3.39 ±7.12
(0.46)
12.94 ±40.96 (0.31) 3.81
MxA** 2.45 ±1.05
(0.02)
9.42 ±10.64
(7.09)
3.84
* Data are expressed as mean ± standard deviation (median).
Figure 1 Interferon (IFN) induced expression of microRNAs
(miR-1, miR-30, miR-128, miR-196, miR-296) in peripheral
blood mononuclear cells collected from three healthy
individuals after in-vitro treatment with IFN alpha (100
international unit (IU)/ml). Expression of MxA-mRNA was also
evaluated. Significant increases, relative to baseline, after in vitro IFN
treatment were observed for miR-1,
miR-30, miR-128, miR-196, miR-296 and MxA (p < 0.05 using
student’s T-test).
Scagnolari et al.Virology Journal 2010, 7:311
http://www.virologyj.com/content/7/1/311
Page 4 of 9

Figure 2 Fold induction of microRNAs (miR)-1 (Panel A), miR-30 (Panel B), miR-128 (Panel C), miR-196 (Panel D), miR-296 (Panel E) and
MxA-mRNA (Panel F) in peripheral blood mononuclear cells collected from all single patients with chronic hepatitis C after interferon
treatment.
Scagnolari et al.Virology Journal 2010, 7:311
http://www.virologyj.com/content/7/1/311
Page 5 of 9


![Bộ Thí Nghiệm Vi Điều Khiển: Nghiên Cứu và Ứng Dụng [A-Z]](https://cdn.tailieu.vn/images/document/thumbnail/2025/20250429/kexauxi8/135x160/10301767836127.jpg)
![Nghiên Cứu TikTok: Tác Động và Hành Vi Giới Trẻ [Mới Nhất]](https://cdn.tailieu.vn/images/document/thumbnail/2025/20250429/kexauxi8/135x160/24371767836128.jpg)


