
VNU Journal of Science: Natural Sciences and Technology, Vol. 40, No. 3 (2024) 38-48
38
Original Article
Synthesis of CeO2 Coupling rGO Material Oriented
to Rhodamine B Degradation under Optical Irradiation
Nguyen Hoang Hao1,*, Nguyen Thi Ngoc Anh1, Nguyen Duy Kien1,
Hoang Yen Nhi1, Phan Dinh Khanh Nguyen1, Nguyen Thi Hoa1,
Phung Thi Lan2, Nguyen Van Thuc3
1College of Education, Vinh University, 182 Le Duan, Vinh, Nghe An, Vietnam
2Hanoi National University of Education, 136 Xuan Thuy, Cau Giay, Hanoi, Vietnam
3VNU University of Science, 19 Le Thanh Tong, Hoan Kiem, Hanoi, Vietnam
Received 04th April 2024
Revised 03rd July 2024; Accepted 09th July 2024
Abstract: In the present work, CeO2 with different loading was embedded on reduced graphene
oxide (rGO) by a simple one-pot hydrothermal method. The synthesized samples were
characterized using XRD, EDX mapping, FESEM, and UV-Vis DRS techniques. The
photocatalytic activity of the as-synthesized CeO2, rGO, and 0,5% (1,5% and 5,0% wt) CeO2/rGO
was studied by monitoring the degradation of Rhodamine B dye (denotes RhB) under xenon light
irradiation. The analyses show that CeO2 particles were evenly dispersed on rGO and the optical
properties of the xCeO2/Rgo (x = 0,5; 1,5; and 5,0%wt)/rGO material were significantly enhanced
due to the interaction between CeO2 and rGO. The effects of CeO2 loading, initial RhB
concentration, and pH were thoroughly investigated. Under the irradiation, the RhB degradation
reached 100% over 1.5%CeO2/rGO. The high performance of the synthesized composites was
attributed to the significant suppression of the recombination rate of photo-generated electron-hole
pairs due to charge transfer between rGO sheets and CeO2 particles and the smaller optical band-
gap in the CeO2/rGO nanocomposite.
Keywords: Reduced graphene oxide (rGO), CeO2, Rhodamine B, photocatalysis.
1. Introduction *
The unsuitable discharge of wastewater
containing various harmful pollutants, e.g.
harmful organic dyes used in the textile
industry, has become a severe threat to the
water environment [1]. Many techniques,
_______
* Corresponding author.
E-mail address: haonguyen0404@gmail.com
https://doi.org/10.25073/2588-1140/vnunst.5658
including physical adsorption, photocatalysis,
chemical oxidation, and nanofiltration have
been used to remove dangerous pollutants from
water [2, 3]. Among them, photocatalysis is
thought to be a promising technique in the
elimination of water due to its high efficacy,
low cost, and environmental friendliness [4].
Therefore, developing highly efficient and
long-lasting photocatalysts is essential to the
photocatalysis process.

N. H. Hao et al. / VNU Journal of Science: Natural Sciences and Technology, Vol. 40, No. 3 (2024) 38-48
39
Cerium dioxide (CeO2), an environmentally
friendly rare earth oxide, has attracted a lot of
attention about its low cost, good chemical
stability, good oxygen transfer capability,
Ce3+/Ce4+ redox pairs, and capacity to degrade a
variety of pollutants [5, 6]. However, the
usefulness of CeO2 in photocatalysis is
restricted by a broad bandgap, and CeO2
particles tend to become agglomerated during
their processing, which often leads to their poor
catalyst activities [7]. Consequently, a variety
of techniques have been developed to enhance
light absorption, including element doping [8],
noble metal deposition [9], and heterojunction
structure construction [10]. Among these,
developing a heterojunction with additional
semiconductors has proven to be a successful
technique because it can increase solar energy
utilization and hasten the separation of charge
carriers produced by photosynthesis [11].
The previous problems might be resolved
by adhering these CeO2 particles to reduced
graphene oxide (rGO) surfaces. rGO contains
functional groups like hydroxyl and epoxide
groups on the basal plane and carboxyl
groups at the edge [12, 13]. The presence of
π-conjugation systems and oxygen groups
causes rGO to absorb visible light and impart
high hydrophilicity to rGO. Moreover, rGO
effectively inhibits the agglomeration of CeO2
particles and acts as electron acceptors to
reduce the band gap of CeO2. Additionally, they
are also capable of resolving the critical
problem of poorly ordered graphene sheet
stacking brought on by π-π interactions. More
active sites will be effectively exposed by a
highly homogeneous distribution of CeO2
particles on rGOs, which is crucial for catalytic
performance [14-16].
2. Experimental
2.1. Chemicals
Chemicals such as H2SO4, KMnO4, KNO3,
H2O2, Na2CO3, Ce(NO3)3, graphite, and
rhodamine B were purchased from China with
purity greater than 99%.
2.2. Materials Synthesis
2.2.1. Preparation of CeO2 Material
To synthesize CeO2, 50 mL of Ce(NO3)3
(0.05 M) was first added to 75 mL of Na2CO3
solution (0.075 M). The resulting solution was
stirred magnetically for 30 minutes and
transferred into a 200 mL Teflon flask. The
Teflon flask is placed in a stainless steel flask,
then placed in a drying oven for 24 hours at
200 oC. After natural cooling, the precipitate
was washed with ethanol and separated by
centrifugation at 7000 rpm several times. The
obtained powder was dried at 100 oC in air for
10 hours.
2.2.2. Preparation of rGO Material
The rGO synthesis process follows these steps:
Step 1: Add 2 g of graphite to 100 mL of
98% H2SO4 while stirring for 20 minutes, then
gradually add 4 g of KNO3 and stir for 3 hours.
Next, add 8 g of KMnO4, stir for 4 hours, and
keep the temperature below 10 oC. Afterward,
raise the system temperature to 35 oC and stir
for 17 hours, then add 200 mL of a 5% H2SO4
solution and continue stirring for 4 hours.
Step 2: Lower the temperature to room
temperature, then add 25 mL of 30% H2O2
gradually (oxidize the remaining KMnO4) and
stir for 2 hours to obtain a light brown product.
Step 3: Wash and centrifuge the product in
step 2 with 5% H2SO4, then continue washing
with distilled water until pH 7. Finally, filter to
remove solids and dry overnight.
2.2.3. Preparation of CeOx/rGO Material
40 mL of rGO (10 mg/mL) was diluted with
120 mL of deionized water. Next, add V mL
(calculated amount) of 0.05 M Ce3+ solution
into 160 mL of the obtained GO solution and
ultrasonicate for 30 minutes. Then, gradually
add 40 mL of 0.075 M Na2CO3 and stir
continuously for half an hour. Put the mixture
in a Teflon jar and dry at 200 oC for 18 hours.
Finally, the obtained product was washed to a
neutral pH and dried at 80 oC for 12 hours. The
as-preapred materials were denoted as
x%CeO2/r-GO (x = 0.5, 1.5, and 5.0).
N. H. Hao et al. / VNU Journal of Science: Natural Sciences and Technology, Vol. 40, No. 3 (2024) 38-48
40
2.3. Characterization Techniques
The X-ray diffraction (XRD) spectroscopy
was carried out on a Bruker D8 Advance
diffraction machine with a Cu-K radiation
source (wavelength 0.15418 nm) to evaluate the
presence of crystalline phases. The energy
dispersive X-ray spectroscopy (EDX) and
FeSEM images were performed on the FESEM
S-4800 equipment system in Horiba, England,
to determine elemental composition and the
morphology of the material. The ultraviolet-
visible diffuse reflectance spectrum (UV-Vis
DRS spectrum) was performed on a Shimadzu
UV-2600 device in Japan to determine the light
absorption ability of the material.
Photocatalytic activity evaluation The
photocatalytic activity of as-prepared catalysts
was evaluated by the photodegradation of RhB,
a model pollutant. Generally, 150 mL of
RhB solution at pH 3 and an initial
concentration of 20 mg/L were conducted in
photocatalytic procedures, together with 50 mg
of catalyst mass (0.3 g/L mass-to-volume ratio).
A quartz glass beaker was placed in a
temperature-controlled bath at 25 °C, and a
250W Xenon lamp was located 20 cm above
the solution surface. At 30-minute intervals
during irradiation, by using UV-visible
absorption spectroscopy at a wavelength of
554 nm, the RhB concentration was monitored
to assess the catalytic activity of the synthesized
samples. The total light irradiation time was
120 minutes.
For an experimental test with the effect of
CeO2 content, the ratios calculated by a mass
percentage of CeO2 were chosen as follows:
0%, 0.5%, 1.5%, and 5%.
The influence of RhB initial concentration
was conducted at three concentrations: 10, 20,
30, and 40 ppm.
The pH range from 1.5 to 6.3 was chosen to
investigate the effect of pH on RhB
decomposition efficiency.
The percentage 2,4-D degradation was
calculated using the formula:
where C0 is the initial (at zero minutes)
concentration of RhB in solution and Ct is the
concentration of RhB after a time interval of t.
3. Results and Discussion
3.1. Characterization of as-synthesized Material
XRD analysis
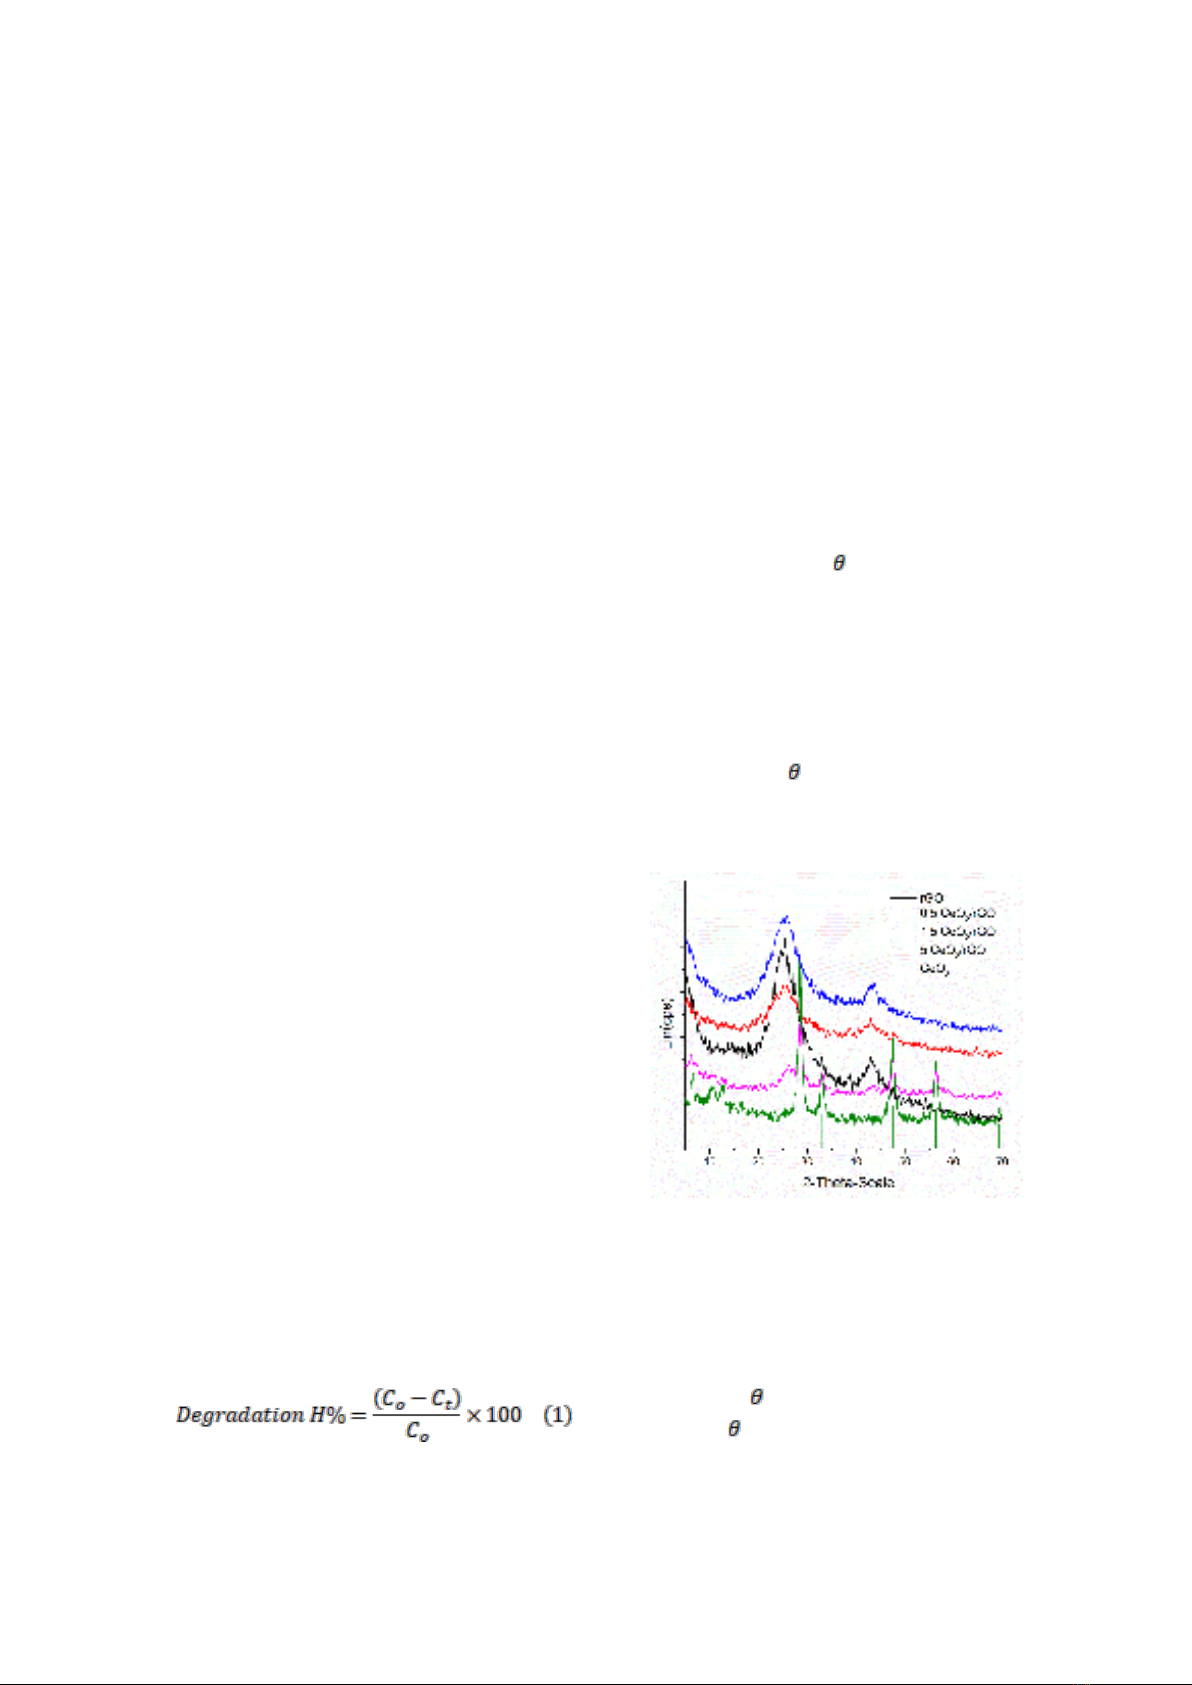
X-ray diffraction (XRD) patterns of rGO,
0.5CeOx/rGO, 1.5CeOx/rGO, and 5CeOx/rGO
were presented in Figure 1.
In the XRD pattern of pure CeO2, the
diffraction peaks with 2 angles of 28.3°, 32.9°,
47.3°, 56.2°, and 69.8° correspond to the (111),
(200), (220), (311), and (400) crystal planes of
cubic CeO2, respectively. This corresponds to
the CeO2 standard pdf card (JCPDS 34-0394)
[14-16]. The high intensity and sharp peaks
reveal that CeO2 has high crystallinity. Two
distinctive peaks are shown in the XRD pattern
of pure rGO at 2 angles of 24.3°, which is
usual for the (002) plane, and 43.1°, which
is typical for the (100) plane (JCPDS file
no. 75 - 2078) [12].
Figure 1. XRD of rGO; 0.5CeOx/rGO;
1.5CeOx/rGO; và 5.0CeOx/Rgo.
The diffraction peaks of pure CeO2 and
pure rGO are visible in the XRD patterns for
the CeO2/rGO sample, indicating the
coexistence of these compounds in the
composites (2 angles of 24.3° and 43.1° for
rGO and 2 angles of 28.02, 33, 11, 47.45,
N. H. Hao et al. / VNU Journal of Science: Natural Sciences and Technology, Vol. 40, No. 3 (2024) 38-48
41
56.33, 59.08, 69.4, 76.69 for CeO2). When the
amount of CeO2 in the CeO2/rGO sample
increases, the intensity of the characteristic
peaks for rGO gradually weakens, while the
peaks specific to CeO2 gradually intensify,
indicating a strong interaction between g- CeO2
and rGO, especially the 5% CeO2 content.
However, these peaks are not seen in samples
with low CeO2 contents, e.g., 0.5% and 1.5%,
because of the low CeO2 content.
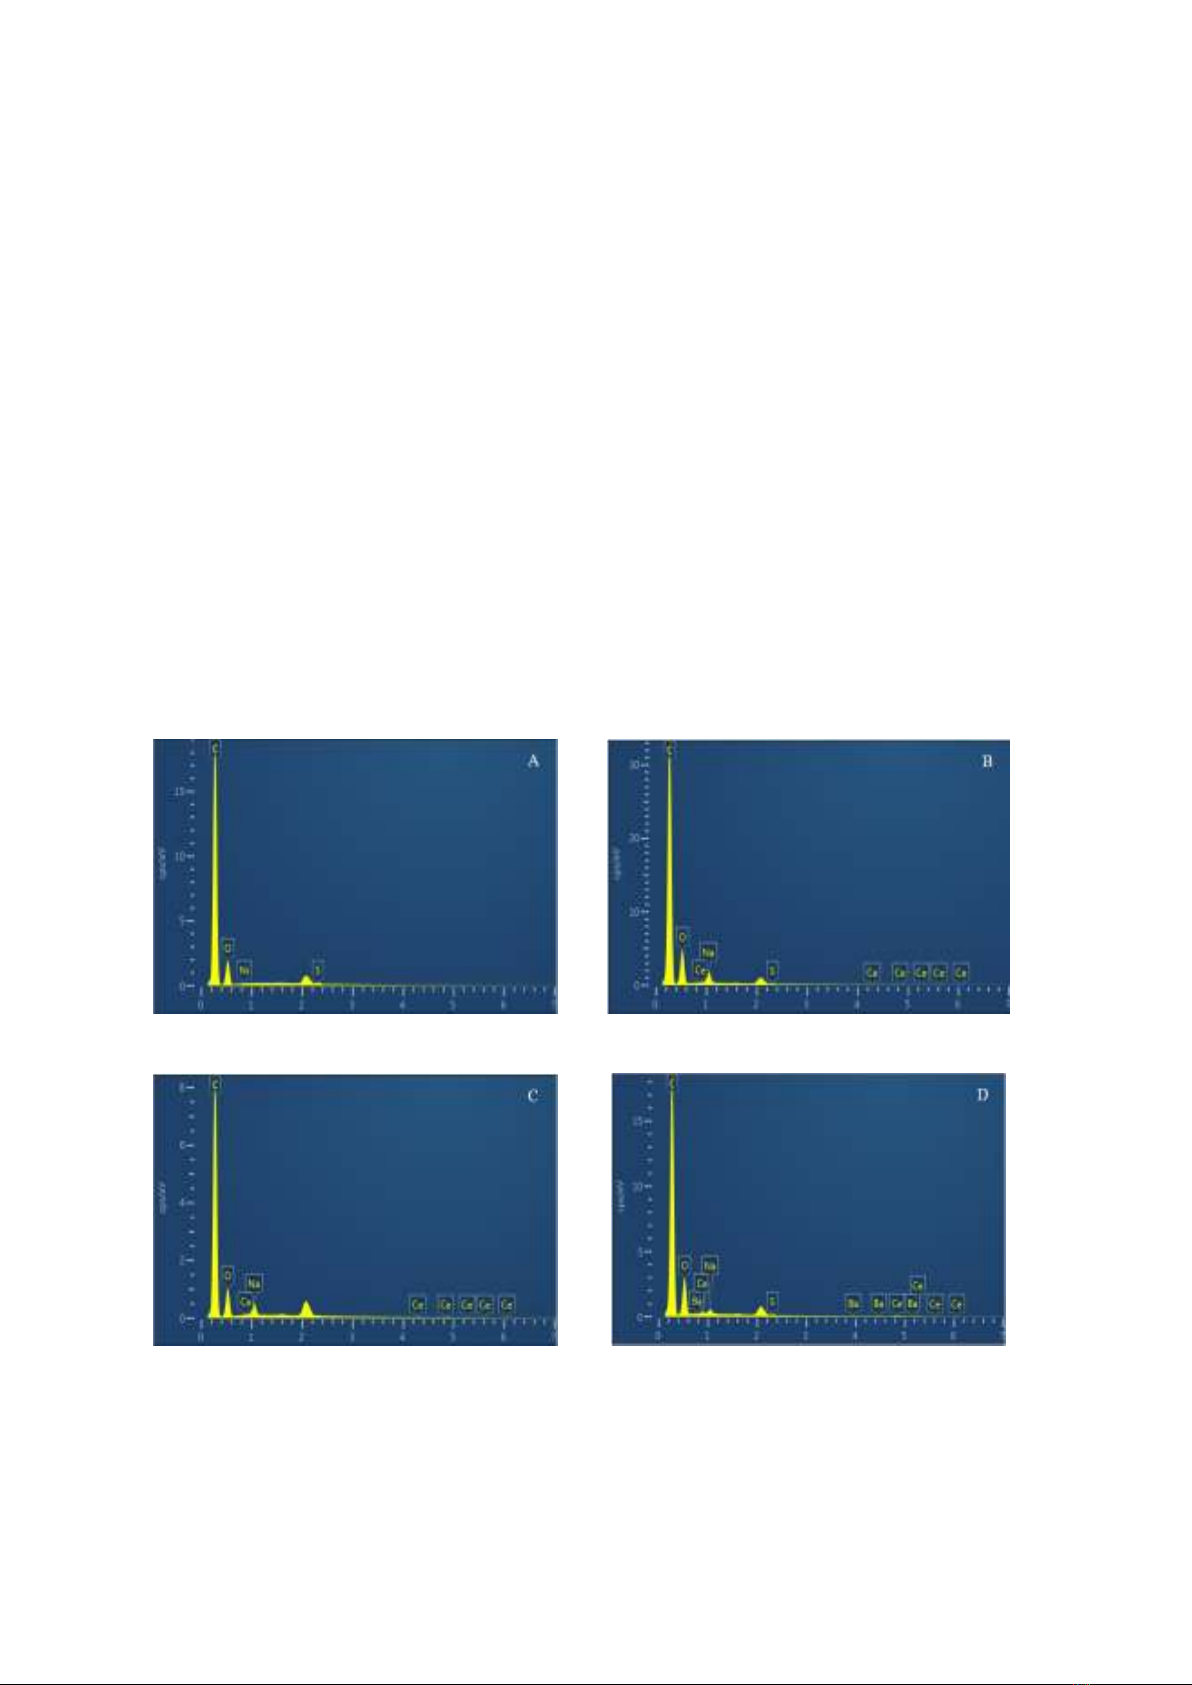
EDX analysis
X-ray energy-dispersive spectroscopy was
employed to identify the as-synthesized
sample's elemental composition.
Figure 2 and Table 1 present the findings.
The EDX spectrum analysis results show
that O, with a mass greater than 12.70%, and C,
with a loading greater than 83.31%, are the
primary components of the rGO.
The findings of the EDX spectrum analysis
in Table 1 also show that Ce content in pristine
rGO, 0.5%CeOx/rGO, 1.5%CeOx/rGO, and
5%CeOx/rGO were analyzed as follows: 0%,
0.16%, 0.37%, and 1.5%, respectively.
Although there are variations from the
estimated amounts, these results are entirely
consistent with the XRD results' appearance of
a distinctive CeO2 peak. This remarkable
concordance could be regarded as evidence that
the synthesis procedure is successful. In
addition to the main elements, the samples also
export some impurities, e.g., Na, Ba, S, and Ni,
but the content is quite low. These substances
appear to be probably from synthetic
precursors. However, for ease of reading, we
kept the sample's original symbols.
f
Figure 2. EDX spectrum of rGO (A); 0.5%CeOx/rGO (B); 1.5% CeOx/rGO (C); 5%CeOx/rGO (D).
N. H. Hao et al. / VNU Journal of Science: Natural Sciences and Technology, Vol. 40, No. 3 (2024) 38-48
42
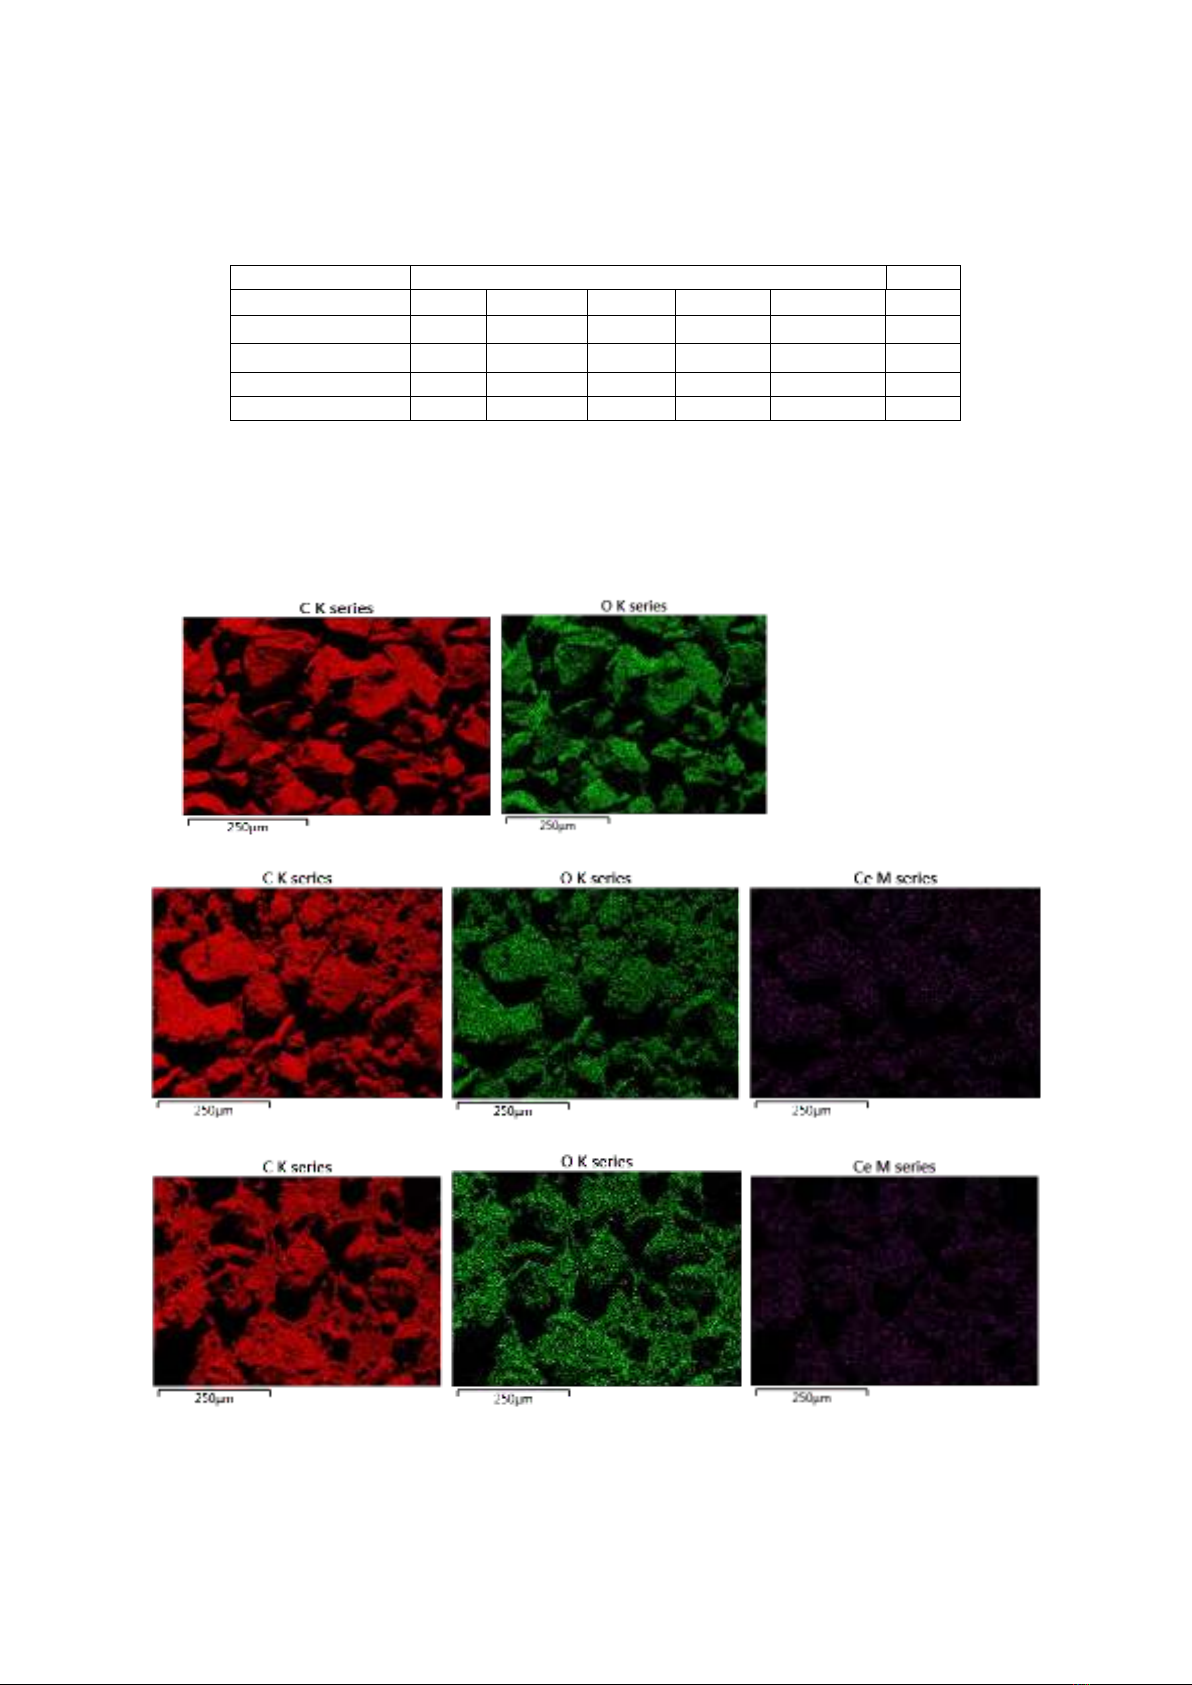
Table 1. Elemental composition (wt%) of four synthesized materials
Sample
Elemental composition (%)
Total
C
O
Ce
Na
Impurities
rGO
87.17
12.70
0.0
0.0
0.13
100
0.5% CeOx/rGO
83.31
15.54
0.13
1.00
0.02
100
1.5% CeOx/rGO
85.28
13.33
0.30
1.09
0.0
100
5% CeOx/rGO
83.54
14.72
1.22
0.39
0.13
100
b
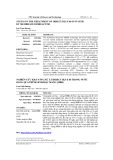
Figure 3 displays energy dispersive X-ray
(EDX) mapping analysis of carbon, oxygen,
and cerium atoms for as-prepared samples
(rGO, x%CeO2/rGO (x = 0.5, 1.5, and 5). It is
evident from the elemental distribution map that
the distribution of elements is fairly uniform. The
Ce element is widely distributed throughout the
sample surface rather than being concentrated in
one area. According to the data, CeO2 is
successfully loaded and uniformly distributed
across the surface of rGO.
g
rGO
0.5%CeO2/rGO
1.5%CeO2/rGO


![Câu hỏi ôn tập Vi sinh môi trường [năm hiện tại]](https://cdn.tailieu.vn/images/document/thumbnail/2025/20250710/kimphuong1001/135x160/8671752134731.jpg)


![Giáo trình Tài nguyên năng lượng và bảo vệ môi trường - Trường CĐ Cơ điện Hà Nội [Mới nhất]](https://cdn.tailieu.vn/images/document/thumbnail/2026/20260323/lionelmessi01/135x160/8121774378783.jpg)
![Đề cương bài giảng Kỹ thuật xử lý môi trường - Trường Cao đẳng Cơ điện Hà Nội [Chuẩn nhất]](https://cdn.tailieu.vn/images/document/thumbnail/2026/20260323/lionelmessi01/135x160/75051774429892.jpg)


