Original article
Diagnosing plant water status as a tool for quantifying
water stress on a regional basis
in Mediterranean drylands
Moreno Vertoveca, Serdal Sakçalib, Munir Ozturkb, Sebastiano Salleoa,*,
Paola Giacomicha, Enrico Feolia, Andrea Nardinia
a Dipartimento di Biologia, Università degli Studi di Trieste, Via L. Giorgieri 10, 34127 Trieste, Italy
b Department of Biology, Fatih University, Buyukcekmece, 34900 Istanbul, Turkey
(Received 17 May 2000; accepted 24 August 2000)
Abstract – This study reports measurements of stomatal conductance, relative water content and water potential (ΨL) from three
dominant evergreens (Ceratonia siliqua L., Quercus coccifera L. and Olea oleaster Hoffmgg. et Link) growing in four coastal sites
of Turkey. In particular, a fully vegetated site (H) was selected and compared for the above parameters to three degraded sites (D1,
D2 and D3) with decreasing vegetation covers. From the integral of the diurnal time course of ΨL, the water stress impact on each
species (WSIS) was calculated. C. siliqua and Q. coccifera showed similar WSIS’s, increasing significantly from H to D3. O. oleast-
er was sensitive both to summer drought and to increasing site degradation. The impact of water stress was scaled up from the
species to the vegetation level (WSIV) as WSIV = Σ WSISS(1–fs) where fswas the relative frequency of the species studied. WSIV
was rather sensitive to the impoverishment of vegetation and was correlated to vegetation density as estimated both by field observa-
tions and remotely sensed Normalized Difference Vegetation Index.
desertification / leaf water potential / Mediterranean evergreens / Normalized Difference Vegetation Index / water stress
impact
Résumé – Diagnostiquer l’état de l’eau dans la plante : un outil pour quantifier le stress hydrique au niveau régional dans les
régions sèches méditerranéennes. Cette étude rapporte les mesures de conductance stomatique, de la teneur relative en eau et du
potentiel hydrique (ΨL) d’arbres à feuilles persistantes (Ceratonia siliqua L., Quercus coccifera L. et Olea oleaster Hoffmgg. Et
Link) croissant sur 4 sites côtiers de Turquie. En particulier, un site totalement recouvert de végétation (H) a été sélectionné et com-
paré, pour les paramètres ci-dessus, à 3 sites dégradés (D1, D2 et D3) ayant une couverture végétale de plus en plus faible. A partir
de l’intégrale de ΨL, pour le cycle diurne, l’impact du stress hydrique de chaque espèce (WSIS) a été calculé. C. siliqua et Q. coc-
cifera montrent des WSIS similaires, augmentant significativement de H à D3. O. oleoaster a été sensible à la fois à la sécheresse
estivale et à l’accroissement de la dégradation du site. Un changement d’échelle, du niveau de l’espèce à celui de la végétation, a été
réalisé pour l’impact du stress hydrique (WSIV) par la transformation WSIV = ΣWSISs (1–fs) ou fsest la fréquence relative de
l’espèce étudiée. WSIV est particulièrement sensible à l’appauvrissement de la végétation et est corrélé à la densité de la végétation
estimée à la fois par des observations aux champs et par l’indice normalisé de différentiation de la végétation par observation satelli-
taire.
désertification / potentiel hydrique des feuilles / arbre à feuilles persistantes méditerranéen / index normalisé de différentia-
tion des espèces / impact du stress hydrique
Ann. For. Sci. 58 (2001) 113–125 113
© INRA, EDP Sciences, 2001
* Correspondence and reprints
Tel. +39 040 6763875; Fax. +39 040 568855. e-mail: salleo@univ.trieste.it

M. Vertovec et al.
114
1. INTRODUCTION
Today, most Mediterranean countries have to face
progressive degradation of their vegetation cover due to
increasing anthropic pressure [13, 31, 33, 57] leading to
improper use of resources. Overgrazing, repeated fire
events and indiscriminate urbanization are common fac-
tors [21, 32] contributing to impoverishment of
Mediterranean forests and grasslands and, hence, to
increasing environmental aridity.
Whenever evapotranspiration increases beyond given
limits, water availability to plants becomes insufficient
to sustain the transpirational and physiological demand
and water stress develops in plants; these plants then
react by reducing gas exchange and, hence, CO2fixation
and productivity [11, 29, 55]. A problem arising when
large areas are considered in this regard, is how to quan-
tify the impact of water stress on a regional scale, based
on the response of a few individuals of a single or sever-
al species. The aim of such scaling exercises are to: a)
discriminate drought resistant from vulnerable species;
b) select the species more suitable for reforestation
and/or cultivation; c) derive an index describing the
impact of water stress on plant and system processes;
and d) use such an index to assess larger scale trends and
patterns (i.e. degradation, recovery, etc.).
Water stress is usually estimated in terms of plant
water relations parameters such as leaf relative water
content (RWC), water potential (ΨL) and conductance to
water vapour (gL) [2, 42, 47] as well as in terms of loss
of hydraulic conductance (KWL) of the soil-to-leaf path-
way [25, 30]. In spite of some known limits in the inter-
pretation of pressure chamber-derived ΨLmeasurements
[14, 51, 59], ΨLis easily and rapidly measured in the
field and provides a reliable measure of plant water sta-
tus, especially for comparative purposes. Nonetheless,
field measurements of ΨLrequire some caution in their
use. Common reference parameters used to estimate the
extent to which plants suffer water deficit stress are pre-
dawn leaf water potential (Ψpd), minimum diurnal leaf
water potential (Ψmin) and maximum diurnal water
potential drop (∆Ψ = Ψpd – Ψmin) [43]. In turn, whole-
plant hydraulic conductance (KWL) is usually estimated
in terms of the Ohm’s law analogue i.e. as:
KWL = EL/ (Ψsoil – Ψmin) (1)
where ELis the transpiration rate and Ψsoil is the soil
water potential, usually assumed to be in equilibrium
with ΨLwhen measured as Ψpd [58].
The significance of both Ψpd and Ψmin as indicators of
plant water status has been questioned. As an example,
Ψpd has been reported not to coincide with soil water
potential [3, 8, 43] during dry periods due to an air gap
between roots and soil [53]. In other cases (e.g. in
Eucalyptus grandis Hill ex Maiden [5]) plants lose sig-
nificant amounts of water in the night so that Ψpd no
longer equilibrates with Ψsoil. In turn, Ψmin provides use-
ful information of whether leaves reach their turgor loss
point (Ψtlp) at which growth is stopped [18, 47, 60] or
the cavitation threshold (Ψcav) at which whole-plant
hydraulic conductance is reduced due to xylem
embolism [6, 52]. Nonetheless, mere Ψmin measurements
are unable to give information of the true impact of
water stress on plant growth and productivity. This is
because it is the duration of the minimum levels of ΨL
that determines the extent to which plant growth is limit-
ed. In other words, the longer the time plant organs
remain at low water potentials, the greater the likelihood
of damage to living cells and of extensive xylem
embolism [29].
More detailed information of the impact of water
stress on plants might be provided by the entire diurnal
time course of ΨL, expressed in the integrated form as
suggested by Mishio and Yokoi [23] or:
WSIS = to∫txΨL
.dt (2)
where WSIS is the impact of water stress on individuals
of a given species and dtis the time interval when ΨL
measurements are performed (usually between pre-dawn,
t0, and sunset, tx). In this form, diurnal changes of leaf
water potential can be used to estimate the amount of the
“environmental pressure” exerted on plants by water
stress [23].
The present study reports measurements of water rela-
tions parameters in woody species dominant in different
sites of the Mediterranean coastal area of Turkey. Sites
were chosen to reflect increasing degradation of the veg-
etation cover (see below). The specific objectives of our
study were to: a) quantify the impact of water stress on
three different Mediterranean evergreen sclerophylls as
typical components of vegetation of Mediterranean dry-
lands; and b) assess the reliability of a relatively easily
measured ecophysiological parameter to estimate the
degree and duration (or intensity) of water stress. A sec-
ondary objective was to evaluate the use of remotely
sensed spectral vegetation indices such as NDVI
(Normalized Difference Vegetation Index) to estimate
vegetation density.
To this purpose, a reference area was selected in the
Dilek Yarimadasi Milli Park, characterized by optimal
development of vegetation cover. Three more areas were
added to the study, with decreasing vegetation cover. In
all the study sites, three typical Mediterranean evergreen
sclerophylls [9, 24] were selected i.e. Ceratonia siliqua L.
Diagnosing plant water status in Mediterranean drylands 115
(Carob tree), Quercus coccifera L. (Kermes oak) and Olea
oleaster Hoffmgg. et Link (wild olive tree).
2, MATERIALS AND METHODS
2.1. Description of study sites
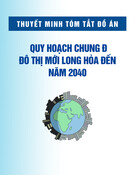
Four study sites were selected in two different regions
of Turkey (figure 1a) i.e. in the Dilek peninsula (figure
1b) and in the Mersin State (figure 1c). In particular, the
reference site was selected in the northern part of Dilek
Yarimadasi Milli Park, near the city of Güzelçamli
(37°41' N, 27°08' E, altitude 30 m) showing optimal,
undisturbed development of vegetation consisting of sev-
eral woody species among which the evergreen sclero-
phylls C. siliqua, Q. coccifera and O. oleaster were
dominant. This site was considered as “healthy” (site H,
figure 1b) and taken as a reference status of vegetation in
comparison with the other three “degraded” sites (sites
D, figures 1b and 1c). These, showed decreasing devel-
opment of vegetation cover because of concurrent effects
of climatic factors and anthropogenic pressure. Site D1
(figure 1c) was located along the coastal area of the State
of Mersin, near the city of Kuyuluk (36°46' N, 34°31' E,
altitude 3 m); site D2 (figure 1b) was located in the
southern part of the Dilek peninsula, facing the coast of
Karine (37°38' N, 27°07' E, altitude 20 m) and site D3
(figure 1c) was located in the State of Mersin, near the
city of Mut (36°34' N, 33°19' E, altitude 270 m). In all
the three D sites, the dominant species were the same as
in site H (i.e. C. siliqua, Q. coccifera and O. oleaster).
Both Dilek and Mersin regions have a typical
Mediterranean climate, characterized by dry, warm sum-
mers and mild, humid winters. The mean annual precipi-
tation in the Dilek peninsula (1961–1991) is about 645
mm. Between June and September the rainfall is as low
as 20 mm. The Mersin region is somewhat drier, with a
mean annual precipitation of about 595 mm and about 30
mm rainfall during the summer period.
Measurements in site H were performed in May 1998
and repeated in September 1998. Measurements in the
spring were aimed at providing reference values of the
water relations parameters, because in this month plants
were actively growing and water availability was likely
high after winter rains. Total precipitation during March,
April and May 1998 at site H was about 130 mm and air
temperatures were between 15 and 25 °C. In contrast,
September is the driest period in the Mediterranean
Basin region and therefore, represents the peak of
drought stress likely suffered by plants. Measurements at
sites D1, D2 and D3 were performed in September 1998,
with the aim of estimating the maximum annual impact
of water stress in areas at different levels of landscape
degradation.
Istanbul
Bursa
Izmir
Antalya Adana
Ankara
Site H (Güzelçamli)
Site D2 (Karine)
Site D1 (Kuyuluk)
Site D3 (Mut)
North a
bc
Figure 1. a) The two study areas, located in the
Dilek peninsula near Izmir and in the State of
Mersin, between the cities of Antalya and
Adana, respectively; b) reference site (H) near
the city of Güzelçamli and degraded site (D2)
near the village of Karine, both within the
Dilek peninsula; c) degraded sites D2 and D3
near the city of Kuyuluk and Mut, respectively.

M. Vertovec et al.
116
2.2. Estimating vegetation density
Vegetation cover was estimated both by direct obser-
vations in the field and by remotely sensed satellite
images. Field measurements of vegetation cover were
made in September 1998. The percentage vegetation
cover was estimated by laying ten 4 ×4 m square
quadrats in each of the four sites studied. The frequency
of the three species selected was estimated by counting
the number of individuals of each species growing in the
selected 16 m2areas.
Remotely sensed images were acquired from the
NOAA-14 satellite equipped with the AVHRR sensor
[22, 39, 54]. Images with a resolution of 1 ×1 km were
taken of Turkey on September 18, 1998, i.e. in the same
period when field measurements of vegetation cover and
water relations were performed. September 18 was a
clear sunny day in all the areas selected for the study.
Images were obtained from USGS (United States
Geological Survey) already georeferenced and radiomet-
rically calibrated. Images were then processed in Trieste
and corrected for the atmospheric effect [22]. Channel 1
(Red reflectance, RED, λ= 0.58–0.68 µm) and channel 2
(Near-infrared reflectance, NIR, λ= 0.725–1.00 µm)
were used to estimate the NDVI (Normalized Difference
Vegetation Index) from the equation:
NDVI = (NIR – RED) / (NIR + RED). (3)
In this form, NDVI ranges between –1 and +1. In partic-
ular, clouds, snow and water produce negative NDVI
values. Rocky and bare soil areas result in vegetation
indices near zero, while positive values of NDVI corre-
spond to vegetated areas [16]. NDVI has been reported
to provide a reliable estimate of vegetation cover and is
widely used to study changes in several vegetation fea-
tures such as seasonal dynamics of vegetation, tropical
forest clearance, and biomass. In turn, these vegetation
attributes have been used in different models to study
photosynthesis, carbon budgets and water balance [16,
41, 46, 54].
2.3. Field measurements of gL, ΨLand RWC
Leaf conductance to water vapour (gL), water poten-
tial (ΨL) and relative water content (RWC) were mea-
sured every 90 min between 05:30 and 20:30.
Measurements were repeated every 60 min in the time
interval between 10:00 and 14:00 to provide more
detailed information on minimum diurnal ΨL(Ψmin),
minimum RWC and mid-day gL. All the measurements
were performed on one-year-old leaves from at least
three different plants per species in May and September
1998 at site H and in September 1998 at D sites (see
above).
In particular, gLwas measured on at least 20 leaves
per species each daytime while still attached to the tree,
using a steady-state porometer (LI-1600, LI-COR Inc.,
Lincoln, NE, USA). Each measurement was completed
within about 30 s. Air temperature and relative humidity
were also estimated using the porometer cuvette held at
about 1 m from the plant crown.
Relative water content (RWC) of at least 15 leaves
per species each daytime was measured from different
trees. Leaves were cut off while within plastic bags,
placed in zip-lock plastic sacks and kept in a thermal bag
at about 4 °C. At the end of the experiments, leaves were
brought to the laboratory and weighed on a digital bal-
ance to obtain their fresh weights (fw). Leaves were then
resaturated with water to full turgor by immersing their
petioles in distilled water, covering the leaf blades with
plastic film and leaving them in the dark, overnight.
Leaves were reweighed to get their turgid weight (tw)
and then dried at 70 °C for 3 days to get their dry weight
(dw). Finally, RWC was calculated as 100 × (fw-dw) /
(tw-dw).
Leaf water potential (ΨL) was measured on six to ten
leaves per species each daytime, using a portable
Scholander-Hammel pressure chamber (PMS 1000, PMS
Instrument Company, Corvallis, OR, USA) [45]. All the
leaves sampled grew on the southern part of the crown
and were sun leaves.
2.4. Estimating the impact of water deficit stress on
single species (WSIS) and vegetation (WSIV)
The curve describing the pattern of diurnal leaf water
potential was used to calculate the integrated water stress
for each species according to equation (2). In order to
describe the amount of water stress suffered by the three
species relative to their frequency in the different sites,
WSIS was multiplied by (1 – fs) where fs is the relative
frequency of the species i.e. the ratio of the number of
individuals of each species to the total number of indi-
viduals of all the three species studied. Each individual
was then combined to give a weighted site stress (WSIV,
water stress of vegetation) from:
WSIV = Σ(1 – fS).WSISS = (1 – fCS).WSISCS
+ (1 – fQC) .WSISQC + (1 – fOO) .WSISOO (4)
where CS, QC and OO are C. siliqua, Q. coccifera and
O. oleaster, respectively.
Diagnosing plant water status in Mediterranean drylands 117
3. RESULTS
3.1. Vegetation cover and species relative
frequencies
The vegetation cover as estimated by direct field
observations was 78.5, 76.5, 65.0 and 56.5% for sites H,
D1, D2 and D3, respectively (table I) whereas calculated
NDVI was 0.615, 0.317, 0.241 and 0.190, respectively
(figures 2a and 2b). A highly significant, non-linear rela-
tionship was noted between the percentage vegetation
cover and NDVI (figure 3). However, nearly equal vege-
tation covers estimated for sites H and D1 corresponded
to very different NDVI’s (almost double at site H versus
site D1, figure 3) whereas covered changed by only 2%.
This was likely the effect of the dominant growth form
changing from tree at site H to shrub at site D1 (and also
D2 and D3, table I). The relative frequencies of C. sili-
qua also decreased from site H (about 34%) to sites D
(12 to 17%). At site D1 (the least degraded site), C. sili-
qua was apparently replaced by O. oleaster and at sites
D2 and D3 by Q. coccifera (table I).
Table I. Percentage vegetation cover, relative frequency and growth form as estimated by field observations in a well developed vegetation site (H) and
in three degraded sites (D1, D2 and D3).
Site Vegetation C. siliqua Q. coccifera O. oleaster
Cover, % Frequency / Growth form Frequency / Growth form Frequency / Growth form
H 78.5 0.34 / Tree 0.31 / Tree 0.34 / Tree
D1 76.5 0.12 / Tree 0.34 / Shrub 0.54 / Shrub
D2 65.0 0.17 / Shrub 0.49 / Shrub 0.33 / Shrub
D3 56.5 0.17 / Shrub 0.49 / Shrub 0.34 / Shrub
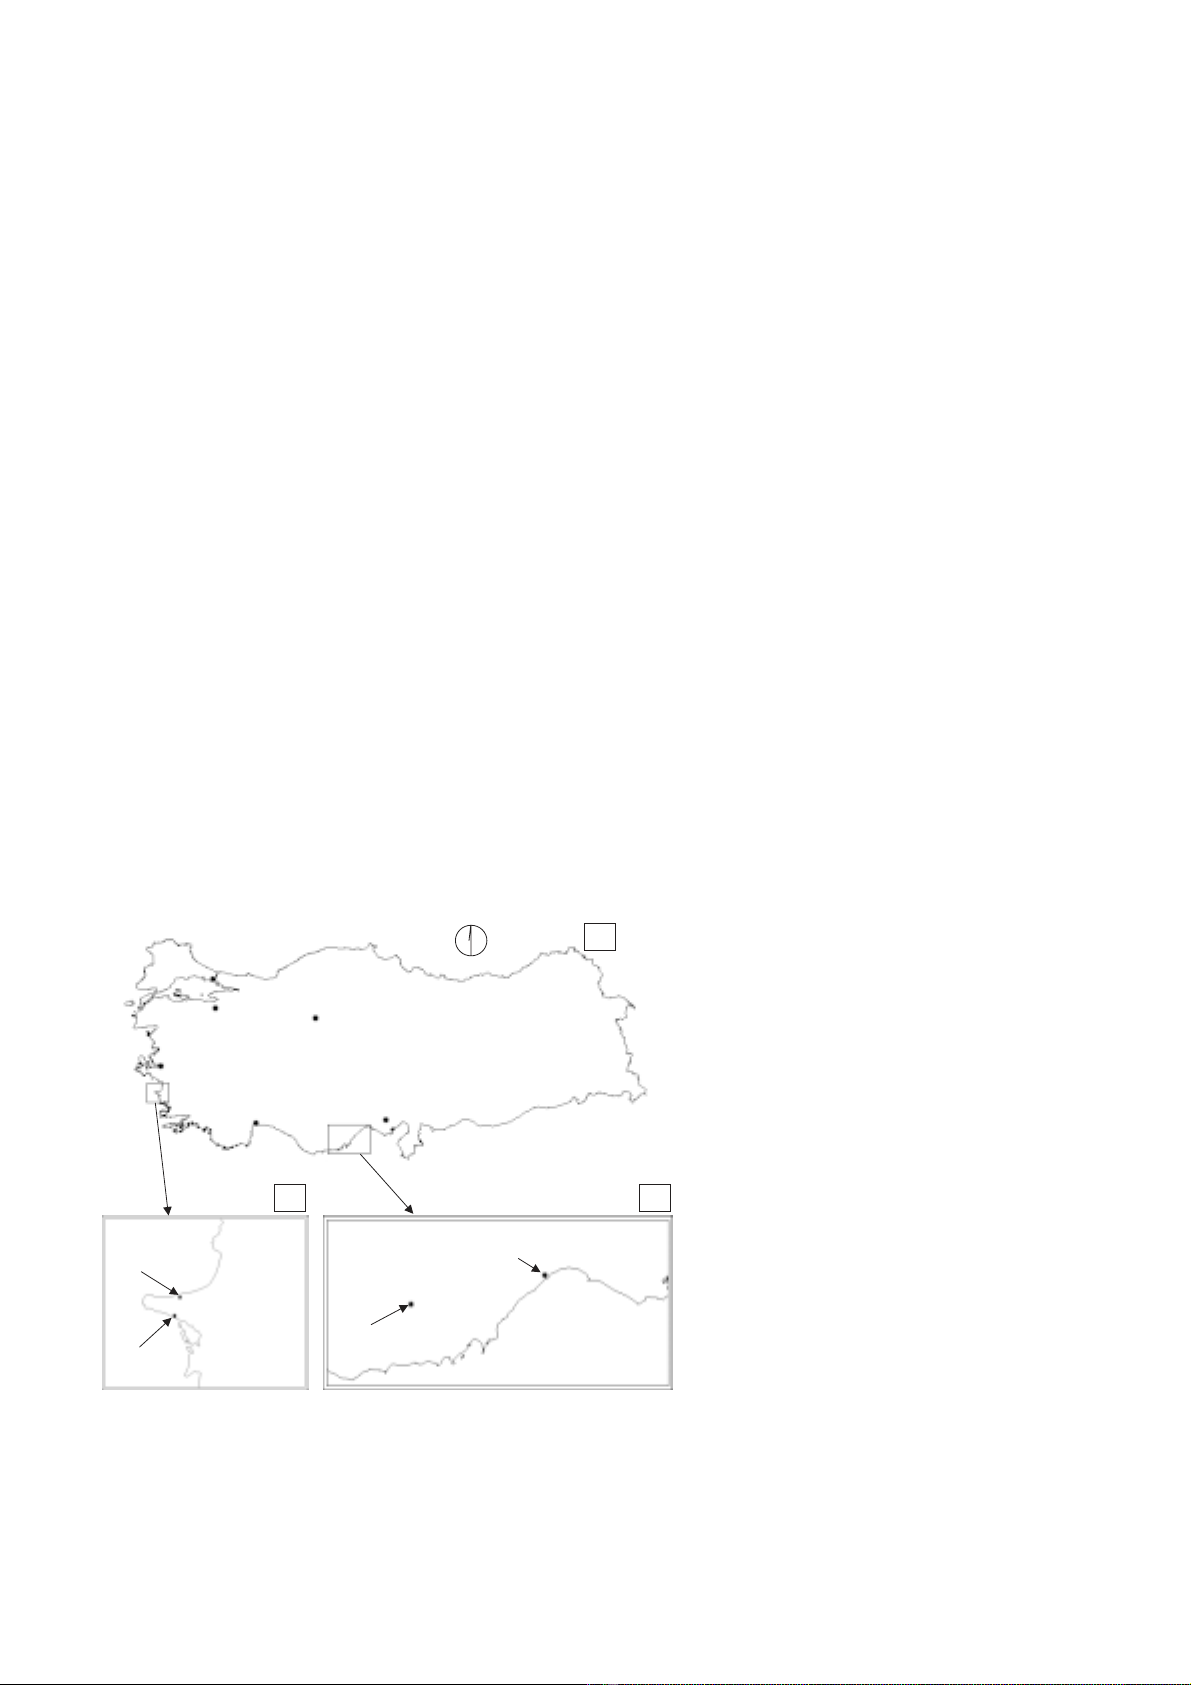
a
Site H (Güzelçamli)
37°41’N
27°08’E
NDVI=0.615
Site D2 (Karine)
37°38’N
27°07’E
NDVI=0.241
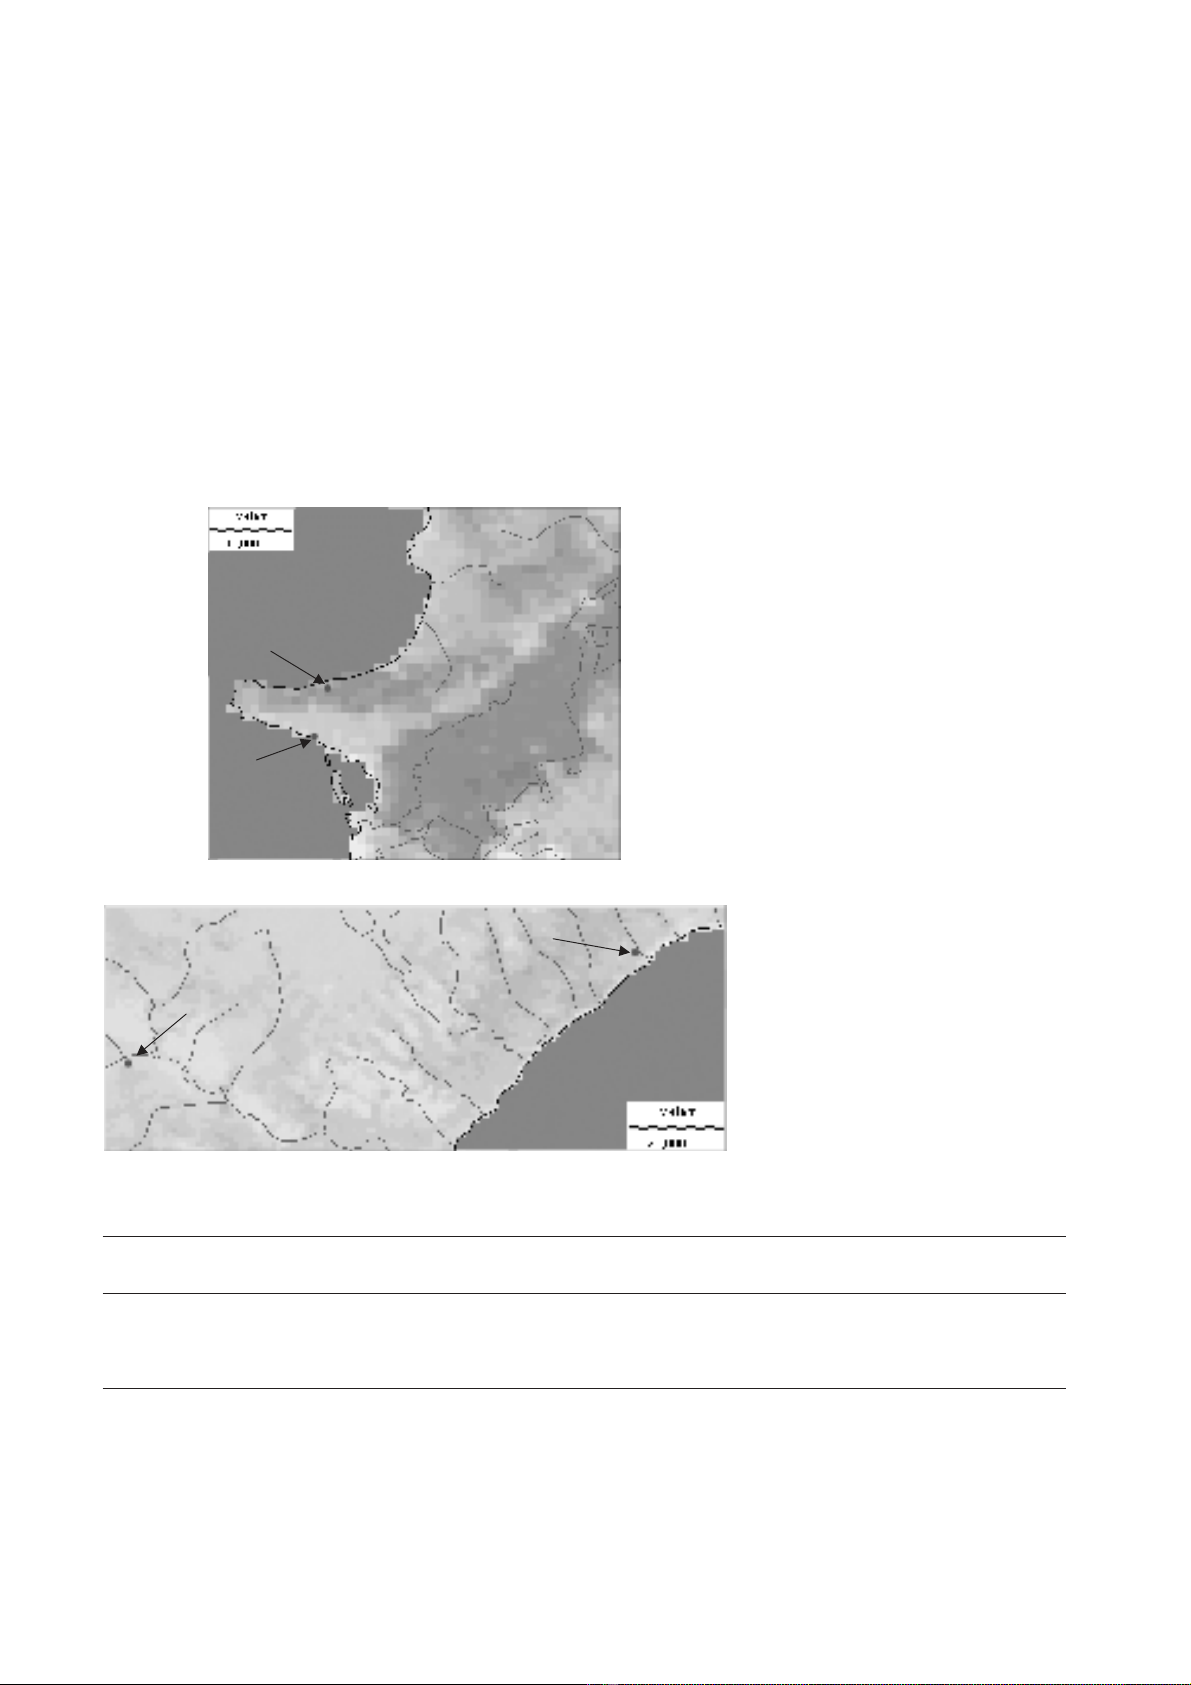
b
Site D1 (Kuyuluk)
36°46’N
34°31’E
NDVI=0.317
Site D
3
(Mut)
3
3
6°34’N
33°19’E
NDVI=0.190
Figure 2. Images from NOAA-14
satellite. Resolution 1x1 km. For each
of the four sites studied (H, D1, D2
and D3, respectively), latitude and lon-
gitude as well as the satellite derived
Normalized Difference Vegetation
Index (NDVI) are reported.