
I nvest opedia.com – the resource for investing and personal finance educat ion.
This tut orial can be found at: ht t p: / / ww w. inv est opedia.com / un iv ersit y/ indicat or_oscillat or/ default .asp
Exploring Oscillators and
Indicators
http://www.investopedia.com/university/indicator_oscillator/default.asp
Thanks very much for downloading the printable version of this tutorial.
As always, we welcome any feedback or suggestions.
http://www.investopedia.com/contact.aspx
Table of Contents
1) Exploring Oscillators and Indicators: Introduction
2) Exploring Oscillators and Indicators: Leading And Lagging Indicators
3) Exploring Oscillators and Indicators: On-Balance Volume
4) Exploring Oscillators and Indicators: Accumulation/Distribution Line
5) Exploring Oscillators and Indicators: Average Directional Index
6) Exploring Oscillators and Indicators: Aroon Indicator
7) Exploring Oscillators and Indicators: MACD
8) Exploring Oscillators and Indicators: RSI
9) Exploring Oscillators and Indicators: Stochastic Oscillator
10) Exploring Oscillators and Indicators: Market Indicators
11) Exploring Oscillators and Indicators: Conclusion
By Chad Langager and Casey Murphy, senior analyst of ChartAdvisor.com
1) Introduction
Technical analysis is broken into two main categories, chart patterns and
indicators. Indicators are essentially calculations based on the price and the
volume of a security and measures factors such as money flow, trends, volatility
and momentum.
Within technical analysis, indicators are used as a measure to gain further insight
into to the supply and demand of securities. Indicators, such as volume, are used
to confirm price movement and the probability that the given move will continue.
Along with using indicators as secondary confirmation tools, they can also be
used as a basis for trading as they can form buy-and-sell signals. In this tutorial,
we'll take you through the second building block of technical analysis and explore
oscillators and indicator in depth.
(Page 1 of 20)
Copyright © 2007, I nvest opedia.com - All rights r eserved.

I nvest opedia.com – t he resource for investing and personal finance educat ion.
This tut orial can be found at: ht tp: / / www .invest opedia.com / un iv er sit y / indicator_oscillat or/ default .asp
If you don't know the basics yet of technical analysis, try this Technical
Analysis tutorial instead. Or, if you want to read about the other bulding block to
technical analysis, check out this tutorial, Analyzing Chart Patterns.
2) Leading And Lagging Indicators
Indicators can be separated into two main types - leading and lagging - both
differing in what they show users.
Leading Indicators
Leading indicators are those created to proceed the price movements of a
security giving predictive qualities.
Two of the most well-known leading indicators are the Relative Strength Index
(RSI) and the Stochastics Oscillator.
A leading indicator is thought to be the strongest during periods of sideways or
non-trending trading ranges, while the lagging indicators are regarded as more
useful during trending periods. Users need to be careful to make sure the
indicator is heading in the same direction as the trend.
The leading indicators will create many buy and sell signals that make it better for
choppy non-trending markets instead of trending markets where it is better to
have less entry and exit points.
The majority of leading indicators are oscillators. This means that these
indicators are plotted within a bounded range. The oscillator will fluctuate into
overbought and oversold conditions based on set levels based on the specific
oscillator.
Note: An example of an oscillator is the RSI, which varies between zero and 100.
A security is traditionally regarded as overvalued when the RSI is above 70.
Lagging Indicators
A lagging indicator is one that follows price movements and has less predictive
qualities. The most well-known lagging indicators are the moving averages and
Bollinger bands. The usefulness of these indicators tends to be lower during non-
trending periods but highly useful during trending periods. This is due to the fact
that lagging indicators tend to focus more on the trend and produce fewer buy-
and-sell signals. This allows the trader to capture more of the trend instead of
being forced out of their position based on the volatile nature of the leading
indicators.
(Page 2 of 20)
Copyright © 2007, I nvest opedia.com - All rights r eserved.

I nvest opedia.com – t he resource for investing and personal finance educat ion.
This tut orial can be found at: ht tp: / / www .invest opedia.com / un iv er sit y / indicator_oscillat or/ default .asp
How Indicators Are Used
The two main ways that indicators are used to form buy and sell signals are
through crossovers and divergence.
Crossovers occur when the indicator moves through an important level or a
moving average of the indicator. It signals that the trend in the indicator is shifting
and that this trend shift will lead to a certain movement in the price of the
underlying security.
For example, if the relative strength index crosses below the 70-level it signals
that security is moving away from an overbought situation, which only will occur
when the security declines.
The second way indicators are used is through divergence, which occurs when
the direction of the price trend and the direction of the indicator trend are moving
in the opposite direction. This signals that the direction of the price trend may be
weakening as the underlying momentum is changing.
There are two types of divergence - positive and negative. Positive divergence
occurs when the indicator is trending upward while the security is trending
downward. This bullish signal suggests that the underlying momentum is starting
to reverse and that traders may soon start to see the result of the change in the
price of the security. Negative divergence gives a bearish signal as the
underlying momentum is weakening during an uptrend.
On the other hand, assume that the relative strength index is trending upward
while the security's price is trending downward. This negative divergence can be
used to suggest that even though the price is lagging the underlying strength,
shown by the RSI, traders could still expect to see bulls regain control of the
asset's direction and have it conform to the momentum predicted by the indicator.
Indicators that are used in technical analysis provide an extremely useful source
of additional information. These indicators help identify momentum,
trends, volatility and various other aspects in a security to aid traders when
making decisions. It is important to note that while some traders use a single
indicator solely for buy and sell signals they are best used in conjunction with
price movement, chart patterns, and other indicators.
3) On-Balance Volume
The on-balance volume indicator (OBV) is one of the most well-known technical
indicators and it focuses on the importance of volume and how it can affect a
(Page 3 of 20)
Copyright © 2007, I nvest opedia.com - All rights r eserved.
I nvest opedia.com – t he resource for investing and personal finance educat ion.
This tut orial can be found at: ht tp: / / www .invest opedia.com / un iv er sit y / indicator_oscillat or/ default .asp
given price and asset's momentum. The OBV indicator is used to measure the
positive and negative flow of volume in a security relative to its price over time. It
is a simple measure that keeps a cumulative total of volume by adding or
subtracting each period's volume depending on the price movement. This
measure expands on the basic volume measure by combining volume and price
movement.
The idea behind this indicator is that
volume precedes price movement, so
if a security is seeing an increasing
OBV it is a signal that volume is
increasing on upward price moves. Decreases mean that the security is seeing
increasing volume on down days.
Calculation
The OBV is calculated by taking the total volume for the trading period and
assigning it a positive or negative value depending on whether the price was up
or down during the trading period. If the price traded above the previous period it
is assigned a positive value while a negative value is assigned when the price
has fallen during the period.
(Current Period Volume will be positive if the price increased and negative if the
price fell during the period.)
The positive or negative volume total for the period is then added to the previous
period's OBV. The OBV itself is simply a running total that is adjusted each
period depending on the amount of volume and the direction of the security for
the period.
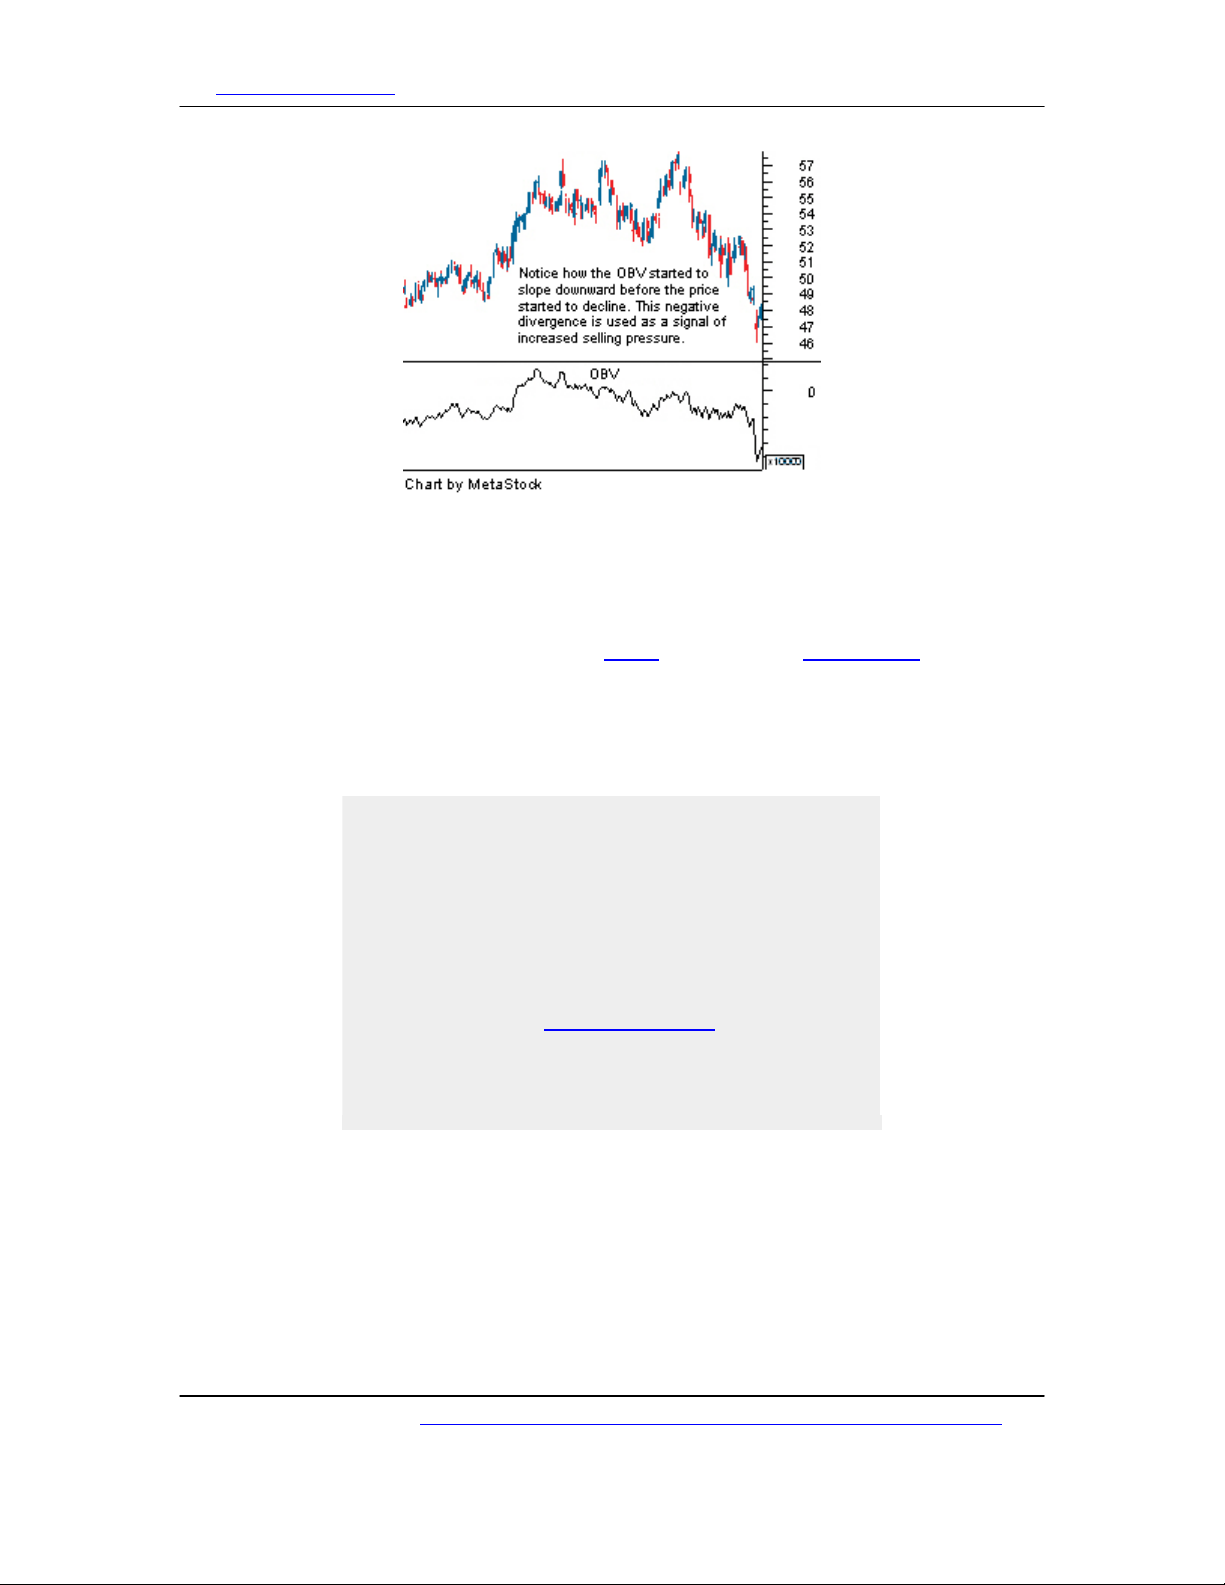
Using the OBV
Again, the idea behind the OBV measure is that volume is thought to precede
price movements. If volume is decreasing when the price of a security is rising
then it is a sign of increased selling pressure, which if continued, will send the
price of a security lower. The opposite is true with increasing volume on up days,
which is a sign of buying pressure.
(Page 4 of 20)
Copyright © 2007, I nvest opedia.com - All rights r eserved.
I nvest opedia.com – t he resource for investing and personal finance educat ion.
This tut orial can be found at: ht tp: / / www .invest opedia.com / un iv er sit y / indicator_oscillat or/ default .asp
The main focus with this indicator should be on its trend. The actual value of the
OBV doesn't matter as it includes a lot of past data and there is no relative
comparison between the OBV of one security and another. By looking at the
recent trend of OBV, one can see whether buying pressure is increasing or
decreasing to either confirm an existing trend or to identify divergence.
If the OBV is moving in the same direction as the existing trend, it is a signal that
the strength of the trend remains. When the OBV starts to move against the
trend, it is a signal that the existing trend is weakening and may reverse.
For example, when the volume is not
increasing during up days in an upward trend it
is a sign that buying pressure is weakening. If
buying pressure is weakening it is not likely that
the upward trend is sustainable.
To help confirm a price trend reversal with the
OBV a 20-period moving average of the OBV is
often added. When the OBV crosses the 20-
period moving average the divergence signal of
a trend reversal is confirmed.
The on-balance volume measure is one of the least complex volume indicators
that try to measure price and volume together. While there are more complex
indicators, it is the ease of understanding and use that make this volume
indicator so popular.
4) Accumulation/Distribution Line
(Page 5 of 20)
Copyright © 2007, I nvest opedia.com - All rights r eserved.


![Câu hỏi trắc nghiệm và bài tập Thị trường chứng khoán [mới nhất]](https://cdn.tailieu.vn/images/document/thumbnail/2025/20251001/kimphuong1001/135x160/75961759303872.jpg)


![Quỹ đầu tư chứng khoán: Đề tài thuyết trình [Mới Nhất]](https://cdn.tailieu.vn/images/document/thumbnail/2025/20250912/truongmy050404@gmail.com/135x160/80601757732705.jpg)


![Đề thi Đầu tư quốc tế học kì 1 năm 2024-2025 có đáp án (Đề 2) - [kèm đáp án chi tiết]](https://cdn.tailieu.vn/images/document/thumbnail/2025/20250822/kimphuong1001/135x160/84781755852396.jpg)
