* Corresponding author.
E-mail address: wateniwut@polikant.ac.id (W. A. Teniwut)
© 2019 by the authors; licensee Growing Science, Canada.
doi: 10.5267/j.dsl.2018.8.001
Decision Science Letters 8 (2019) 137–150
Contents lists available at GrowingScience
Decision Science Letters
homepage: www.GrowingScience.com/dsl
GIS-Based multi-criteria decision making model for site selection of seaweed farming
information centre: A lesson from small islands, Indonesia
Wellem Anselmus Teniwuta*, Mariminb and Taufik Djatnab
aFisheries Agribusiness Study Program, Tual State Fisheries Polytechnic, Langgur, Southeast Maluku, Indonesia
bDepartment of Agroindustrial Technology, Faculty of Agricultural Technology, Bogor Agricultural University, Bogor, West Java,
Indonesia
C H R O N I C L E A B S T R A C T
Article history:
Received July 3, 2018
Received in revised format:
July 10, 2018
Accepted August 2, 2018
Available online
August 2, 2018
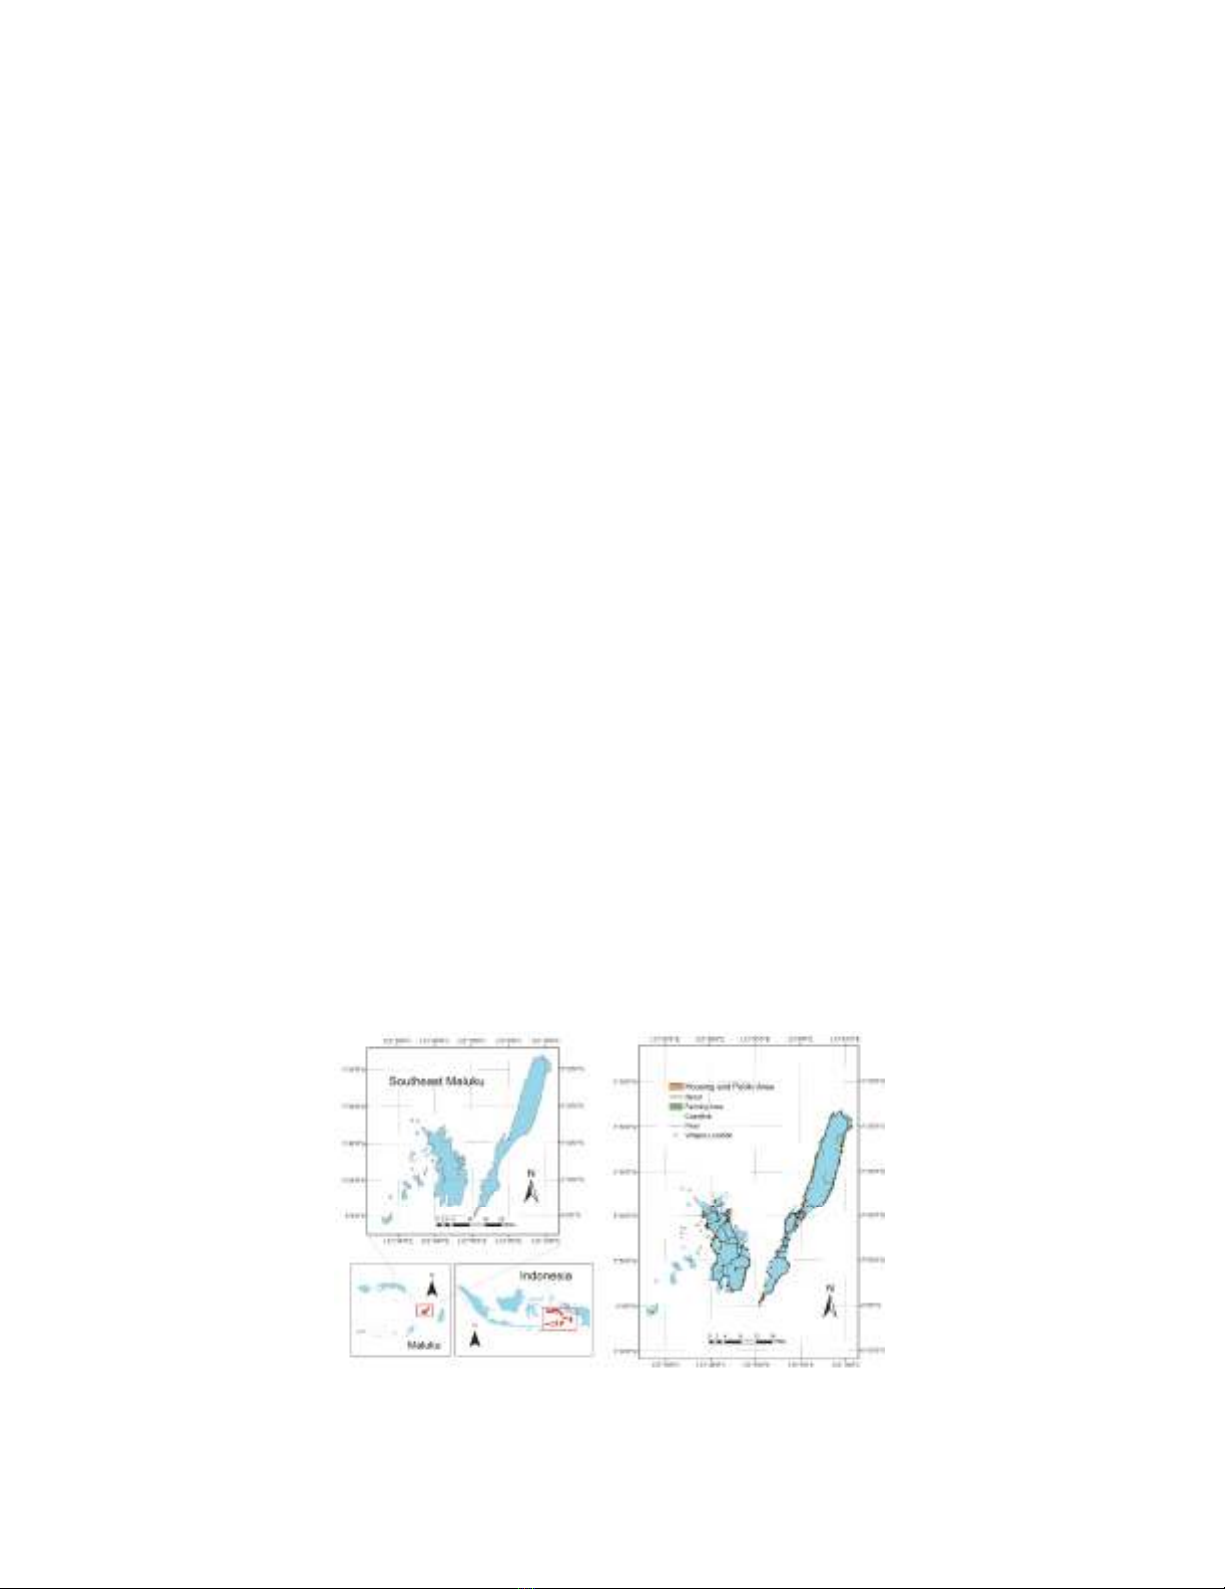
Seaweed had proven to become a fisheries commodity to provide a significant multiplier
economic effect for coastal community in Southeast Maluku District during 2005-2013.
However, the declining on the productivity of seaweed has given a direct impact on welfare of
farmers and coastal communities in this region during the recent years, due to asymmetric
information on seaweed farming associated with prices, latest technology and all pre and post
production activities. Thus, forming a dedicated information centre for seaweed farming in the
region has become a necessity. As small island regions, in Southeast Maluku district, farmers
and all stakeholder have to deal with cliché problems such as insufficient infrastructure, lack of
transportation, farmers locations that spread across the islands. This paper focused on the
selection of suitable location for the information centre for seaweed farming in Southeast Maluku
district, Indonesia. Analytical hierarchy process (AHP), in classical and fuzzy forms, was an
approach used on this study for suitability analysis. Moreover, GIS for spatial analysis in addition
to AHP was used to compare the best results for the location of information centre for seaweed
farmers. The results show that fuzzy AHP could provide more suitability location compared with
conventional AHP. Most of suitability locations were located in three sub-districts regions and
also most of them were located in Kei Kecil Island and Kei Besar Islands due to the geographical
characteristics of the region. The sensitivity analysis was conducted to measure the sensitivity of
the results when the weight of each criterion was changed. The outcome of this study was to
serve its purpose as an input and comparison study for a recent local government of Southeast
Maluku' policy on developing seaweed farming in this region.
.2018 by the authors; licensee Growing Science, Canada©
Keywords:
Seaweed farming
Small islands
Information centre
Site selection
GIS-MCDM
1. Introduction
The role of information for the success of any kind of business such as small business is significantly
high (Vaughan, 1999), despite the change of information technology has shifted the behaviour of people
(Lyu & Hwang, 2014), but the condition still cannot be applied to all regions in the world. In small
islands region especially in Indonesia, access of internet and the knowledge of using search engine is
not as much as the people who live in urban and big cities, which can affect the productivity of coastal
community’ daily activities includes fisheries. As evidence in Southeast Maluku District, where
seaweed farmers struggled to maintain their productivity in recent years due to asymmetric information
related to seaweed farming supply chain (Teniwut, et al., 2017a). Therefore, it is crucial to improve the
138
information flow among seaweed farmer in the region. In general, seaweed farming offers favourable
features in terms of easiness to conduct and also economic multiplier impact on marginal coastal
community, compared with other fisheries activities; namely fishing, crabs and grouper cultivation
(Hurtado-Ponce et al., 1996). Since seaweed has proven to contribute the higher multiplier boost for
local economic, local government of Southeast Maluku district which has decided to make seaweed as
one of region’ top commodity, in 2017, local government has decided to put seaweed in their Regional
MediumTerm Development Plan for 2017-2022.
As archipelagic region which consists of many small islands, Southeast Maluku has a great advantage
in particular in environmental support to meet all the requirements for seaweed cultivation. As small
islands are surrounded by sea, this makes the region to be broadly coastal zone, which contains
vegetation, energy, minerals and biology as the major source for many sea creatures includes seaweed
(Chunye & Delu, 2017). In addition to its natural support, the potential impact welfare of coastal
community makes seaweed cultivation becomes an obvious choice to be major sources of income.
During the span of 7-8 years, the contribution of seaweed for the development of local economy had
greatly presented but since 2013 the number of farming have declined gradually because of pest and
diseases, price instability, lack of the availability of seaweed’ seeds and access to technology (Teniwut
& Kabalmay, 2015). Thus, it is necessary to form an information centre for seaweed cultivation that
will act as a hub to connect farmers to information on the latest technology and knowledge, information
on the market condition related to demand and selling price also helping farmer to deal with technical
problem on seaweed farming. The information centre can provide services also support the needs of
the user on their related activities (Essex et al., 1998). Because of the geographical conditions, which
consist of small islands added with the lack of sufficient infrastructures, road accessibility and
transportation on this region, it is relatively hard to select the exact and accurate location for the
information centre.
To date, GIS-based suitability analysis has been commonly used for site selection, where this approach,
in general, is an analysis on layers that contains spatial data to evaluate and select particular area based
on its suitability criteria classified according to certain measures and processes (Malczewski, 2006b;
Malczewski & Rinner, 2015). The applications of GIS-based suitability analysis for site selection have
widely applied for marine and fisheries field and also in other fields, likes in site selection for marine
fish cage (Pérez et al., 2003); sustainability aquaculture management area (Longdill et al., 2008);
mangrove oyster raft culture (Buitrago et al., 2005); selfish aquaculture (Silva et al., 2011); offshore
marine fish farm (Dapueto et al., 2015); artificial reefs (Mousavi et al., 2015); industrial area (Rikalovic
et al., 2014); industrial wastewater discharge in coastal regions (Li et al., 2017); wind farms (Villacreses
et al., 2017). Although as it has found on previous studies, there was a limited number of studies on
marine and fisheries sector especially in selecting specific areas of inland. Furthermore, the
combination of GIS and multiple criteria decision making (MCDM) can bring greater advantage on the
strengthening of the result on suitability analysis, GIS can provide support on solving spatial problem
(Malczewski, 2006a) and combine with tools in MCDM namely analytical hierarchy process (AHP)
can provide organized construct on selecting the effective solution based on different criteria (Marimin,
2005). In addition, to overcome the uncertainty on AHP, fuzzy logic has been used by researcher along
with AHP method known as fuzzy AHP (FAHP) (Sun, 2010). The implementation of GIS-based
MCDM especially with AHP or FAHP widely has been applied by researchers (Mosadeghi et al., 2015;
Pourghasemi et al., 2012; Zhang et al., 2015). Despite the number of researchers to use MCDM along
with spatial analysis, there was only smaller number of studies to use, at least, more than one MCDM
tools, for instance, AHP and FAHP, or ANP and VIKOR, etc. There also combination of GIS and
MCDM to rank the best criteria which are either explicit or implicit characteristics (Malczewski,
2006a). In this study criteria used for suitability analysis for information centre on seaweed cultivation
are used in GIS application to select the efficient alternative for site location, (Feizizadeh & Blaschke,
2013). In this study, we conside different criteria for information centre for seaweed cultivation namely;
slope, road access, village distance, number of seaweed farmers in each sub-district in GIS application.
W. A. Teniwut et al. / Decision Science Letters 8 (2019)
139
AHP and fuzzy AHP are used to rank the weight of each criterion on suitability location for information
centre for seaweed cultivation. In this study, we also consider uncertainty for different criteria.
This paper focuses on conducting spatial analysis with AHP and fuzzy AHP (FAHP) approaches on
selecting the most suitable location for information centre for seaweed cultivation in Southeast Maluku
district, Indonesia. The combination of GIS with AHP and FAHP can provide powerful and better
results for information centre for seaweed cultivation site selection. Furthermore, the composition of
the rest of this paper is as follows, section 2 includes material and method. Section 3 provides the results
of this study, discusses the restriction model, suitability model and final parcel selection for suitability.
In Section 4 we discuss of the results and continue with section 5, where conclusion and future
implication are discussed.
2. Material and Method
2.1. Study Location
Indonesia is considered as the largest archipelago country in the world, with over 18,100 islands and
estimated over 60% of its people live in small islands region (CTI-CFF, 2009). The study location is
part of Kei Islands, located in Southeast of Maluku Province in the eastern part of Indonesia. Southeast
Maluku geographically is located in 5º to 6,5º south latitude and 131º to 133,5º east longitude, this
region consists of two largest islands (larger island and smaller island) added with 25 small islands
spread along the area (Fig. 1). The centre of local government and economy activity is located in smaller
islands, thus, the infrastructure and road access are significantly better than larger islands. This region
covers more than ± 7.856,70 km² where almost half of this region is water at ± 3.180,70 km² and land
area is ± 4.676,00 km². This region is located in average ± 100m to 115m below sea level, as reported
in 2016, the population of Southeast Maluku district was 98.684, where the population density of
Southeast Maluku district in 2016 reached 95.64 people/km2 (Statistic Indonesia, 2017). There are 11
sub-districts in this region, six sub-districts is located on smaller Kei island (Kei Kecil) and five sub-
districts on larger Kei island (Kei Besar) to cover a total of 191 villages. Southeast Maluku has several
famous marine tourism destination location in the country namely pasir panjang and ngurmunwatwahan
beaches in Ngilngof Village and Ohoidertutu Village, sandbar in Warbal Village and coral reefs views.
Most of the community in this regions rely on fisheries and marine sector such as fishing and
mariculture (pearl, grouper and seaweed), some of the community members also rely on agriculture
sector for major source of income. As overall fisheries sector gives the largest contribution on district
regional growth domestic product (GDP). In 2016, the number of fishermen were 5.620 compared with
the number of mariculture farmers at 4.652 (Statistic Indonesia, 2017). The productivity of mariculture
largely was contributed by seaweed cultivation at 6.455,70 ton in 2017 contributed to IDR
38.734.202.000,- in 2017 (Marine and Fisheries Office of Southeast Maluku District, 2017).
Fig. 1. Study Location
140
GIS
Criterion
Processing
Restricted
Area
Suitability
Rating
Spatial
Model
Analysis
MCDM
Hierarchy
Schematic
Calculate
Weight
Criterion
AHP Fuzzy
AHP
Suitability Analysis
Final Suitability with restriction
Sensitivity Analysis
Literature Review
2.2 Method
The framework of this study is illustrated in Fig 2, which is in two parts.
Fig. 2. Study Framework
One part uses ESRI ArcGIS 10.4 to process the data related to spatial analysis, and for the processing
of the other part of the study, which is based on the implementation of MCDM, Microsoft Excel was
used to calculate the weights for all criteria both for AHP and fuzzy AHP. By combining these two
approaches, we obtain the suitability parcel location and also sensitivity analysis.
2.2.1. Evaluation criteria
For the decision-making process, the use of multi-criteria decision making becomes a common thing
in order to select the best alternative that coexistence in many types of criteria (Al Garni & Awasthi,
2017). There are two stages in this study for the evaluation of each criterion for selecting the final parcel
for information center for seaweed cultivation locations. The first stage: identification and selection of
the possible criteria; namely distance from the road, distance from each village, slope and number of
seaweed farmers from each sub-district which are accomplished using MCDM technique. When we
choose criteria in this study, we based our model from two conditions, first was the characteristics of
the study area and input from the previous studies, where researchers always include slope as one the
mandatory criteria for suitability analysis (Şener et al., 2010; Van Haaren & Fthenakis, 2011; Vasiljević
et al., 2012), distance from certain location and road access (Rikalovic et al., 2014; Hadipour et al.,
2015; Ahmadisharaf et al., 2016; Bunruamkaew and Murayam, 2011; Azizi et al., 2014) and density of
population (Vlachopoulou et al., 2001; Longdill, et al., 2008) and in this study this is the number of
seaweed farmers in each sub-district. In second stage we calculate the weights of different criteria to
obtain the final ranking of all criteria. For prioritizing each criterion this study uses three categories of
experts. First; practitioners, in this case, they are farmers and distributors of seaweed in the region.
Second: academician, where in this study, researcher and lecturer with expertise in information and
W. A. Teniwut et al. / Decision Science Letters 8 (2019)
141
communication also marketing communication are considered. Third: bureaucrats and this was the head
of marine culture division on Marine and fisheries office of Southeast Maluku District. These experts
were asked to give their perceptions on ranking the importance of criteria based on their experiences
and areas of expertise. For the ranking, AHP is used where intermediate values are ‘‘Perfect,”
‘‘Absolute,” ‘‘Very good,” ‘‘Fairly good,” ‘‘Good,” ‘‘Preferable,” ‘‘Not Bad,” ‘‘Weak advantage” and
‘‘Equal”, in adjustment to fuzzy AHP, the following fuzzy numbers in this study are used (Gumus,
2009) presented in Table 1.
Table 1
Fuzzy membership numbers
Linguistic Term Scale of Fuzzy Number Linguistic Term Scale of Fuzzy Number
Perfect (8, 9, 10) Preferable (3, 4, 5)
Absolute (7, 8, 9) Not Bad (2, 3, 4)
Very Good (6, 7, 8) Weak Advantage (1, 2, 3)
Fairly Good (5, 6, 7) Equal (1, 1, 1)
Good (4, 5, 6)
Furthermore, to carry the fuzzy AHP analysis we used the approach by Sun (2010), where there are
two steps in fuzzy AHP analysis. Step 1: Pairwise comparison matrix on all criteria by asking which
criteria is more important, as shown below matrix 󰆻:
󰆻1
 1⋯

⋯

⋮⋮
 ⋱⋮
⋯1
1

1
1⋯

⋯

⋮⋮
1
1

⋱⋮
⋯1
(1)
where
9,8
,7
,6
,5
,4
,3
,2
,1
,1
,2
,3
,4
,5
,6
,7
,8
,9

1
Step 2: To define fuzzy geometric mean and fuzzy weights of each criterion, we use geometric mean
(Hsieh et al., 2004)
⊗…⊗⊗…⊗
, (2)

󰇟
⊗…⊗
⊗…⊗
󰇠,
where,  is fuzzy comparison value of criterion to criterion, thus, is geometric mean of fuzzy
comparison criterion to each criterion, is the fuzzy weight of the th criterion, indicated by TFN,
󰇛,
,󰇜. Also,  is lower value,  is middle value and represents upper
value of fuzzy weight of the th criterion. The consistency on matrix we used is the standard consistency
ratio (CR) as follows,

, (3)
where RI is random index and CI is consistency index. In addition to determining CI, we used the
following equation:

1 ,
(4)
where  is the maximum value of eigenvector; n is the number of criteria. Value of CR is acceptable
when CR below 0.1 (Saaty, 1980).
2.2.2. Define and rank suitability criteria
For the determination of suitability for each criterion, literature study is combined with a preliminary
field study to obtain a comprehensive information about the recent conditions of this region. For