Reporting study results 77
Table 7.7 Mean SF-36 pain scores over time by treatment group with all valid
patients at each time point4
SF-36 Treatment group Mean P-valuec
dimensiona
differenceb
Usual care Acupuncture
(95% CI)
n Mean (SD) n Mean (SD)
0 m – SF-36 pain 80 30.4 (18.0) 159 30.8 (16.2)
3 m – SF-36 pain 71 55.4 (25.4) 146 60.9 (23.0)
12 m – SF-36 pain 68 58.3 (22.2) 147 64.0 (25.6)
24 m – SF-36 pain 59 59.5 (23.4) 123 67.8 (24.1)
Mean follow-up 76 57.2 (19.8) 153 63.4 (20.9) 6.3 0.03
SF-36 pain score (0.6–12.0)
Pain AUC 55 127.1 (41.7) 118 141.1 (44.6) 14.0 0.05
(0.1 to 28.1)
CI: Confi dence interval.
aThe SF-36 pain dimension is scored on a 0 (alot) to 100 (no) pain scale.
bA positive mean difference indicates the acupuncture group has the better HRQoL.
cP-value from two independent samples t-test.
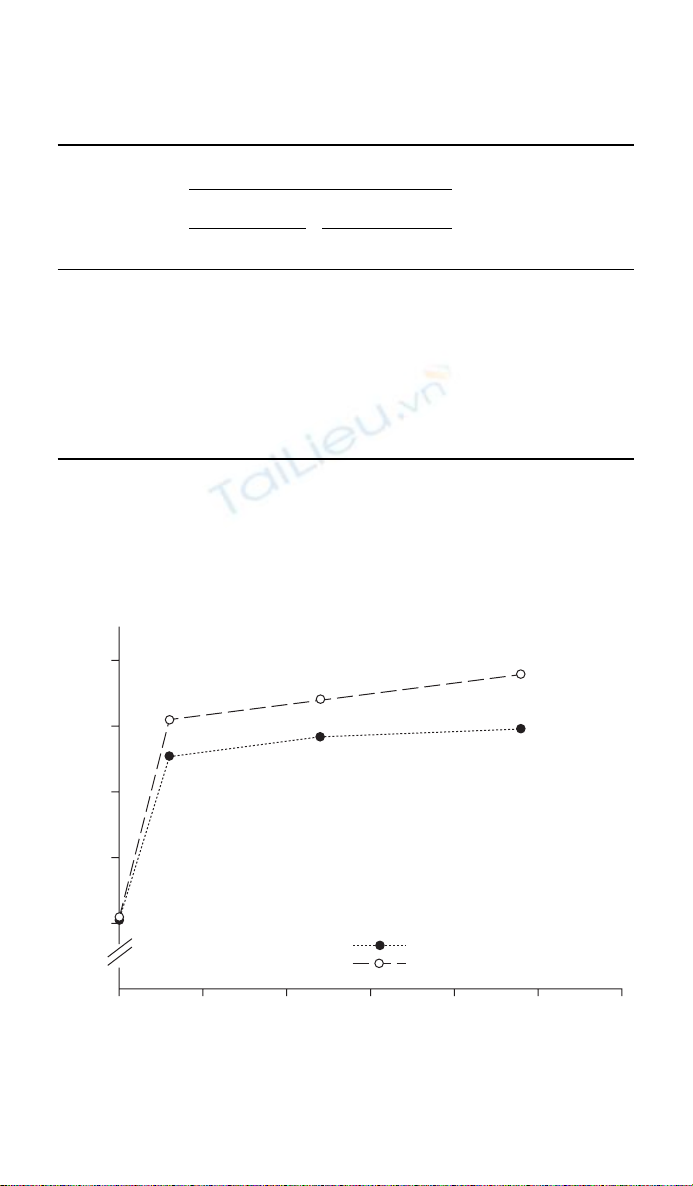
Figure 7.4 Profi le of mean SF-36 pain scores over time by treatment group.4
05
30
40
SF-36 pain score
50
60
70
10 15 20 25 30
Usual care (max n 80)
Acupuncture (max n 159)
Time (months)

78 How to Display Data
the mean pain scores together with solid lines. One other important feature
of this graph is the exclusion of confi dence intervals for the means at each
time period. To do so would be to imply that it is appropriate to compare
the groups at each time point. As it is inappropriate to perform a signifi -
cance test at each time period, so it is inappropriate to include confi dence
intervals for the estimates of the mean at each time point.
7.8 Randomised controlled trials
It is important that RCTs are reported adequately, since they have consid-
erable potential to affect patient care. Concern over the variability in the
quality of the reporting of RCTs in the medical literature lead to the devel-
opment of the Consolidation of Standards for Reporting Trials (CONSORT)
statement.9 It consists of a fl ow diagram and a checklist of 22 items which
should be reported in the paper for every RCT (see Table A7.1 in the appen-
dix). While the CONSORT statement was designed to be used to report the
results of RCTs, only 5 of the 22 items in the checklist specifi cally apply to
RCTs and the majority of the items are applicable for most other studies
that collect quantitative data. Therefore we recommend that the fl ow dia-
gram and CONSORT checklist be used as a guideline for the reporting
of the results of other studies including cross-sectional surveys and other
observational studies. More details can be found at http://www.consort-
statement.org.
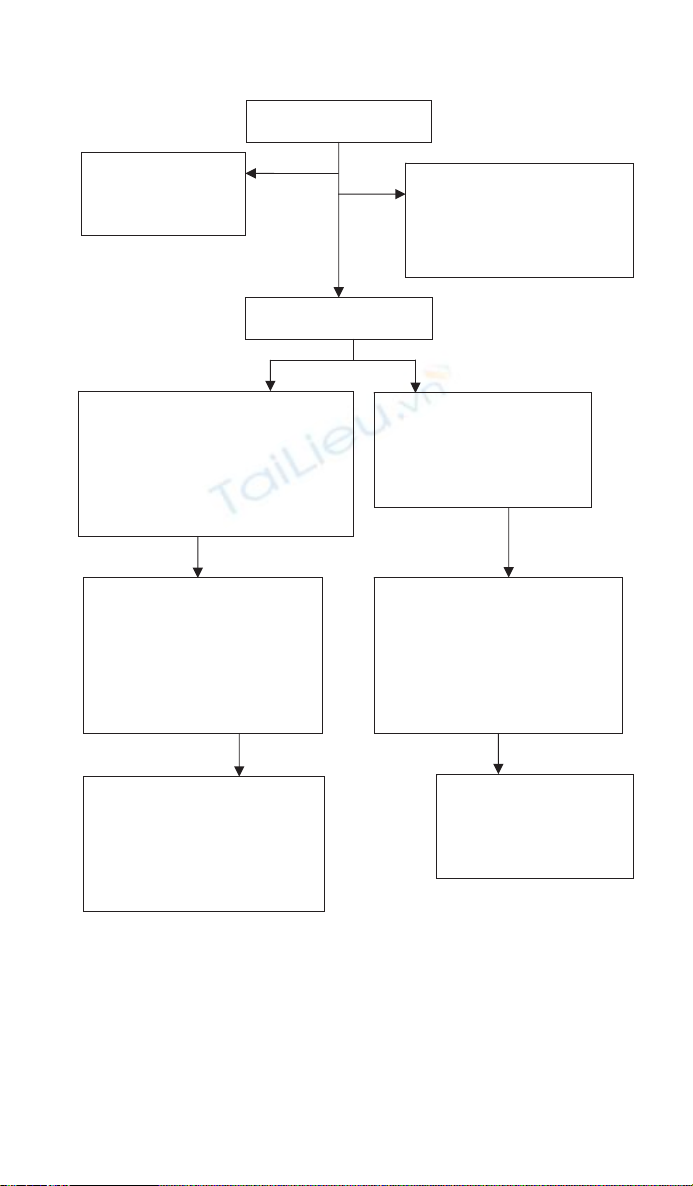
7.9 Patient fl ow diagram
Figure 7.5 shows a CONSORT fl ow diagram for the acupuncture trial.4 It
allows readers to understand quickly how many eligible participants were
randomly assigned to each arm of the trial and whether there are any
imbalances with respect to the numbers of patients withdrawing from or
failing to comply with their assigned treatment. The group allocation was
on a 2:1 basis in favour of acupuncture and from Figure 7.5 it is easy to see
that of the 241 eligible patients consented to be randomised, 160 patients
were offered acupuncture and 81 were allocated to usual care. One patient
in each group withdrew from the study immediately after randomisation.
Ideally the reasons for patients dropping out should be recorded. At 12
months follow-up there were 215 patients with outcome data available for
analysis (147 in the acupuncture group and 68 in the usual care group). By
24 months follow-up the number of patients with data available for analysis
had dropped further to 182.
Reporting study results 79
7.10 Comparison of entry characteristics
The fi rst table in the report of a RCT should provide a summary of the
entry or baseline characteristics of the patients in the study groups. It is
important to show that the groups are similar with respect to variables that
Figure 7.5 Patient progress through trial: CONSORT fl ow chart for acupuncture study.4
Randomised
(n 241)
Allocated to offer of acupuncture (n 160)
Chose acupuncture (n 160)
Did not receive acupuncture appointment: patient
withdrew due to intercurrent illness (n 1)
Received acupuncture appointment (n 159)
Did not receive acupuncture treatment (n 9)
Withdrew early from acupuncture treatment
(n 16)
Allocated to usual management (n 81)
Received usual management (n 81)
Patient withdrew consent to participate
in study immediately after
randomisation (n 1)
Lost to follow-up:
Non-responders at 3 months (n 13)
Non-responders at 12 months (n 12)
General practitioner notes found (12/12)
Non-responders at 24 months (n 36)
General practitioner notes found (24/36)
Outcomes analysed:
3 month (n 71, 92%)
12 month (n 68, 85%)
24 month (n 59, 73%)
All included in primary and
secondary analyses
Outcomes analysed:
3 month (n 146, 92%)
12 month (n 147, 93%)
24 month (n 123, 77%)
All included in primary analyses
11 excluded in secondary analyses
Reason: Permanently unable to work due to
low back pain at trial entry
Identified by general practitioners
(n 289)
Exclusions (n 20):
Back pain resolved (n 12)
Outside age range (n 5)
Back pain > 12 months (n 1)
Pending litigation (n 1)
Currently receiving acupuncture (n 1)
Refused (n 28):
On speaking to
general practitioner (n 13)
On speaking to researcher
(n 15)
Enrolment
Allocation
Follow-up
Lost to follow-up:
Non-responders at 3 months (n 9)
Non-responders at 12 months (n 12)
General practitioner notes found (12/12)
Non-responders at 24 months (n 21)
General practitioner notes found (16/21)
Analysis

80 How to Display Data
Table 7.8 Baseline characteristics of patients by treatment group4
Characteristic Treatment group
Usual care Acupuncture
n Mean or % n Mean or %
Age (years) 80 44.0 159 41.9
(range) (20–64) (26–64)
Duration of back 80 16.7 159 17.1
pain (weeks) (SD) (14.6) (13.5)
SF-36 pain (SD) 80 30.4 159 30.8
(18.0) (16.2)
Gender Male 34/80 (43) 60/159 (38)
Number of previous None 13 (16) 25 (16)
episodes of low 1–5 23 (29) 57 (36)
back pain 5 44 (55) 77 (48)
Expectation of back Better 30 (38) 80 (51)
pain in 6 months Same 37 (46) 56 (35)
Worse 12 (16) 21 (13)
may have an impact on the patient’s response,10 although performing a
hypothesis test to compare the baseline characteristics of the groups is not
recommended. If the randomisation has been performed properly, any dif-
ferences between the two treatment groups must be due to chance.
The table of baseline characteristics, such as Table 7.8 for the acupunc-
ture trial allows the reader to see if there are any variables with known or
suspected prognostic importance that are not closely balanced between the
groups. Data for the intervention and control groups are reported in col-
umns and the baseline variables are reported by row. For the categorical out-
comes the percentages are also reported; this helps compare the two groups,
since the 2:1 randomisation schedule has resulted in twice as many patients
in the acupuncture arm of the trial. For outcomes with only two categories
the result should be given as x/n (y%). For more than two categories the
total should be given as a separate row to avoid repeating it for each category
and to enable a check that all categories are present. In this way we can see
there is one missing value in ‘expectation of back pain’ in the control group
and two missing values in the intervention group.
From the CONSORT fl ow diagram in Figure 7.5 we see that 241 patients
were randomised in the acupuncture study but only 182 (i.e. 75% of the
original cohort) had outcomes at 24 months that were analysable. In the

Reporting study results 81
Table 7.9 Baseline characteristics of patients of all recruited patients (n 239) vs.
those with outcomes for analysis at 24 months (n 182) by group4
Characteristic Treatment group
Usual care Acupuncture
All patients Analysed at All patients Analysed at
(n 80) 24 months (n 159) 24 months
(n 59) (n 123)
n Mean n Mean n Mean n Mean
Age (years) 80 44.0 59 45.5 159 41.9 123 42.5
(range) (20–64) (20–64) (26–64) (26–64)
Duration of 80 16.7 59 16.0 159 17.1 123 17.0
back pain (14.6) (14.1) (13.5) (13.3)
(weeks) (SD)
SF-36 pain 80 30.4 59 29.9 159 30.8 123 30.8
(SD) (18.0) (18.7) (16.2) (16.6)
Gender Male 34 (43%) 23 (39%) 60 (38%) 44 (36%)
Number of None 13 (16%) 10 (17%) 25 (16%) 20 (16%)
previous 1–5 23 (29%) 16 (27%) 57 (36%) 42 (34%)
episodes 5 44 (55%) 33 (56%) 77 (48%) 61 (50%)
of low back
pain
Expectation Better 30 (38%) 25 (42%) 80 (51%) 57 (47%)
of back pain Same 37 (46%) 23 (39%) 56 (35%) 47 (39%)
in 6 months Worse 12 (16%) 10 (17%) 21 (13%) 17 (14%)
Don’t 1 (1%) 1 (2%) 1 (1%) 1 (1%)
know
original cohort of 239 patients Table 7.8 clearly shows that the two groups
were well matched at baseline. However, withdrawal may be caused by treat-
ment-related side effects. Whatever the reason, the incomplete data may
compromise the initial baseline balance between the two treatment groups.
Thus a table comparing the baseline characteristics of those randomised with
those actually analysed is also useful, though rarely reported (Table 7.9).
7.11 Forest plots
A forest plot is commonly used for displaying the quantitative results of
studies included in meta-analyses and systematic reviews. The forest plot
consists of a graph that shows the estimated effect and the corresponding


![Bài giảng Phân tích thiết kế hệ thống [Mới nhất]](https://cdn.tailieu.vn/images/document/thumbnail/2025/20250811/vijiraiya/135x160/642_bai-giang-phan-tich-thiet-ke-he-thong.jpg)