
REGULAR ARTICLE
How to produce accurate inelastic cross sections from an indirect
measurement method?
Maëlle Kerveno
1,*
, Greg Henning
1
, Catalin Borcea
2
, Philippe Dessagne
1
, Marc Dupuis
3
, Stéphane Hilaire
3
,
Alexandru Negret
2
, Markus Nyman
4
, Adina Olacel
2
, Eliot Party
1
, and Arjan Plompen
4
1
Université de Strasbourg CNRS, IPHC UMR 7178, Strasbourg, France
2
Horia Hulubei National Institute of Physics and Nuclear Engineering, Bucharest-Magurele, Romania
3
CEA, DAM, DIF, Arpajon, France
4
European Commission, Joint Research Centre, Geel, Belgium
Received: 31 October 2017 / Received in final form: 8 March 2018 / Accepted: 14 May 2018
Abstract. Inelastic reactions ((n,xn) for x≥1) play a key role in reactor cores as they influence the slowing
down of the neutrons. A reactor neutron energy spectrum depends thus on this process which is in strong
competition with elastic scattering and fission; a nice example is the case of
238
U. Inelastic scattering (x=1)
impacts k
eff
and radial power distribution in the nuclear reactor. For several years, it has been shown that the
knowledge of the inelastic cross sections in nuclear databases is not good enough to accurately simulate reactor
cores and a strong demand for new measurements has emerged with very tight objectives (only a few percent) for
the uncertainties on the cross section. To bypass the well-known experimental difficulty to detect neutrons, the
prompt g-ray spectroscopy method is a powerful but indirect way to obtain inelastic cross sections. Our
collaboration has used this method for more than ten years and have produced a lot of (n,n0g) cross sections for
nuclei from
7
Li to
238
U. In this article, we will first discuss the issues of the prompt g-ray spectroscopy regarding
the control of all the uncertainties involved in the (n,n0g) cross section estimation. Secondly, we will focus on the
role of theoretical modeling which, in certain cases, is crucial to reach the objectives of a few percent uncertainty
on the (n,n0) cross sections.
1 Introduction
For new generation reactor development or optimization of
fuel cycles and operating procedures, quality of nuclear
data is the basic prerequisite for accurate simulations.
Among processes affecting neutron population and energy
distribution in a reactor, neutron inelastic scattering
(n,n0)is particularly important as it acts as a slowing
down process. Further, the (n,xn) reactions result in
neutron multiplication. Moreover, neutron inelastic scat-
tering is a key reaction which influences the radial power
distribution and k
eff
core parameters. Nevertheless, it has
been shown that the knowledge of these cross sections is not
satisfactory to ensure accurate core parameters calcula-
tions as seen in references [1–3]. This situation leads finally
to several requests in the High Priority Request List of
NEA/OECD [4]. For example, the demand concerning the
238
U inelastic scattering is to reduce by a factor of two [3]or
four [1] the uncertainty which reaches 20% in current
evaluated nuclear data files.
The collaboration of three teams from CNRS (France),
EC-JRC-Geel (Belgium) and IFIN-HH (Romania) has
developed, fifteen years ago, two experimental setups
dedicated to precise measurements of neutron inelastic
scattering cross sections at the neutron time-of-flight
facility GELINA operated by EC-JRC-Geel [5]. Setups are
based on the prompt g-ray spectroscopy method coupled to
time-of-flight measurements. This method allows the
measurements of g-production cross sections (n,xng)
which are used in a second step to determine the total
(n,xn) cross section using level and decay sequence
information from literature. This method is thus consid-
ered as an indirect method, unlike direct methods that
detect secondary neutrons, and the deduced total (n,xn)
cross section is often a lower limit for energies above the
energy of the highest level that can be observed by g-de-
excitation. Nevertheless, this technique can provide a large
set of (n,xng) cross sections which constitute severe tests
and constraints for theoretical models. The question is
therefore, from the various partial cross section measure-
ments, how can we accurately determine the total cross
section which fully satisfy the level of accuracy requested
by the applications? In the following section, we will detail
*e-mail: maelle.kerveno@iphc.cnrs.fr
EPJ Nuclear Sci. Technol. 4, 23 (2018)
©M. Kerveno et al., published by EDP Sciences, 2018
https://doi.org/10.1051/epjn/2018020
Nuclear
Sciences
& Technologies
Available online at:
https://www.epj-n.org
This is an Open Access article distributed under the terms of the Creative Commons Attribution License (http://creativecommons.org/licenses/by/4.0),
which permits unrestricted use, distribution, and reproduction in any medium, provided the original work is properly cited.

the experimental method. The third section is devoted to
the description of the procedure that we have elaborated to
maximize the control of uncertainties and minimize their
magnitudes. In the fourth section, a discussion is proposed
about the tools we develop to produce accurate (n,xn)
reaction cross sections from the measured (n,xng) cross
section. And finally, conclusions and perspectives end the
paper.
2 Indirect experimental method
2.1 The (n,xng) technique
The (n,xn) reactions can be studied by three experimental
methods based either on the detection of emitted neutrons
or g’s. Each method, direct or indirect, has its own
advantages and disadvantages [5] in terms of detection
difficulties, corrections to apply, neutron beams suitability,
etc. Our collaboration has chosen the prompt g-ray
spectroscopy method which is an indirect one, but which
allows to perform experiments at white neutron sources
using time-of-flight measurements. With this technique,
the g-rays coming from the de-excitation of the nucleus
formed by the (n,xn) process, are detected and the (n,xng)
cross sections can be deduced. The detection time of the
g-rays is used to deduce, thanks to the pulsation of the
accelerator, the in-beam neutron time-of-flight, which is
related to the incident neutron energy. From these
measured cross sections, two ways are possible to produce
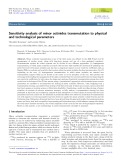
the (n,xn) cross sections as shown schematically in Figure 1.
The first possibility is to use the structure information
(level scheme of the nucleus of interest, branching ratios
and internal conversion coefficients if necessary) to deduce
the experimental (n,xn) cross sections from the measured
cross sections. Indeed, the total (n,xn) cross section is equal
to the sum of all the partial cross sections of g-transitions
that feed the ground state (GS). If a g-transition to GS
from an excited level is not detected for various
experimental reasons but another one from the same level
is observed, then the transition to GS can be deduced using
the branching ratio (if known) and used for the
determination of the total (n,xn) cross section. Neverthe-
less, in practice, not all the (n,xng) cross sections for
transitions to GS can be measured over the entire neutron
energy range, thus the obtained total cross sections is often
a lower limit. More precisely, for x>1, the GS can be
produced directly (no g-ray emission) and the method
provides thus always a lower limit of the total cross section.
For x≥1, due to physics, measurement issues and limited
knowledge of the decay of the nucleus, one can miss some
transitions to the GS.
To bypass this limitation, another way is to use nuclear
reaction codes (Fig. 1). The principle is to constrain and
tune the "free" nuclear model parameters with the
measured (n,xng) cross sections and then produce a
validated total (n,xn) cross section with the nuclear
reaction code.
For both methods and in the context of accuracy issues,
some key questions arise. First of all, experimentalists have
to produce accurate (n,xng) cross sections meaning that all
the uncertainty sources have to be identified, controlled
and minimized. Covariance and correlation information
have also to be produced to give relevant data to
theoreticians and evaluators. The good knowledge of
nuclear structure can be questioned too, since this is an
essential component of the two manners for (n,xn) cross
section calculation. Finally, in the second method, as the
parameters of nuclear models are tuned to the experimental
(n,xng) cross sections, the theoretical calculated (n,xn)
cross section could be produced with uncertainties but it is
rarely the case.
The pillar of this method is thus the measurement of the
(n,xng) cross section with a good accuracy. A short
description of the experimental setup and the analysis
procedure is then given in the following section before the
focus on the uncertainties management in the next section.
2.2 Experimental setup for (n,xng) measurement
There are two HPGe setups for (n,xng) measurements at
GELINA, called GRAPhEME and GAINS, respectively
used for measurements on actinides and on stable nuclei.
More details can be found in references [5–7] and references
therein. In this section, we use as an example of
GRAPhEME setup (GeRmanium array for Actinides
PrEcise MEasurements), which is installed at neutron
flight path 16 of the GELINA facility, 30 m distance from
the neutron source. It is composed of six HPGe planar
detectors placed at 110°and 150°with respect to the
neutron beam direction, which are nodes of the fourth
Legendre polynomial. This configuration allows the use of
the Gaussian quadrature to perform exact integration of
the g-ray angular distribution for g-transitions with
multipolarity up to three. Due to the very good energy
resolution of the germanium detectors, selective identifica-
tion of the detected g-ray allows the reduction of the
ambiguity to the underlying nuclear process. The incoming
neutron flux is measured using a
235
U ionization chamber
and time-of-flight measurements allow the determination
of the incident neutron energy distribution. The partial
cross section at angle ucan be thus addressed, for each
g-transition of interest, with the following formula:
ds
dVui;En
ðÞ¼
1
4p
NGE ui;En
ðÞ
NFC En
ðÞ
eFC
eGE
&FC
&sple
sFEn
ðÞ;ð1Þ
Fig. 1. Schematic view of the two ways to deduce total (n,xn)
cross section from measured (n,xng) ones.
2 M. Kerveno et al.: EPJ Nuclear Sci. Technol. 4, 23 (2018)

where N
GE
and N
FC
represent the dead time corrected
numbers of counts, respectively, for a given g-ray in the
HPGe energy spectrum and for the fission chamber counts
above the discrimination threshold. e
GE
and e
FC
are the
Germanium detector’s and the fission chamber’sefficien-
cies. s
F
is the
235
Ufission cross section and &
FC
and &
sple
are
the areal densities (atoms/cm
2
)of
235
U in the fission
chamber and nuclei of interest in the sample. Gamma
energy distributions are produced for time-of-flight gates.
The widths of the time gates are adjusted to cover several
time bins (10 ns) to improve statistics (at the expense of
neutron energy resolution). The neutron energy resolution,
at 30 m from the neutron source, is 0.17% at 30 keV, worsen
as energy increases and reaches almost 5% at high neutron
energy. To produce as accurate as possible (n,xng) cross
sections, the first step is to precisely quantified and
minimize the uncertainties of all parameters involved in
equation (1). The following section describes the work
performed on this subject and the results obtained for the
uncertainty of each ingredient of the cross section formula.
3 Accurate determination of (n,xng) cross
sections
3.1 Experimental uncertainties
To reach the requested statistical target uncertainty, long
measurement periods are usually necessary. This is due to
the generally low magnitude cross sections, the low
detection efficiency of HPGe detectors, and the limited
size of the samples used. It is especially the case for
actinides, for which the g-energy distribution is often
complex with a mix of g-rays from background (radioac-
tivity) or de-excitation of fission products. Very good
statistics is mandatory to perform efficient peak identifi-
cation and integration. Typically, measurements take from
a few hundred up to a couple of thousand hours of beam
time. These long measurements can be sensitive to the
stability of the data acquisition system and therefore a
careful runs screening is necessary to obtain, for each
detector, optimal raw data sets.
In neutron-induced experiments, the absolute normali-
zation of the data is a key point of the analysis and it
implies a significant uncertainty contribution due to the
use of a secondary reaction for the neutron flux
determination. In our case, we have chosen the fission
reaction on
235
U, which is an IAEA standard and is well-
known in the 0.1–20 MeV neutron energy range. The
uncertainty on the
235
U(n,f) cross section ranges from 0.6%
to 1.4% between 0.1 and 20 MeV. The ionization chamber
efficiency has been well characterized by the combination
of measurements, simulation and calibration as explained
in reference [6]. Finally, the neutron flux can be determined
with an average uncertainty around 2.5%.
For the HPGe g-efficiency determination, we have
developed a procedure based on source measurements and
MCNP simulations [8]. The neutron beam impinging on the
sample has a diameter is 5.5 cm. Thus two
152
Eu sources, a
point one and an extended one, are used for calibration
runs. These runs then serve to adjust the geometry (size of
the active part, shape of the dead layers or position) of the
Ge crystal in a MCNPX-2.6 simulation. This adjustment is
performed very carefully to obtain a simulated over
experimental efficiency ratio (C/E ratio) roughly constant
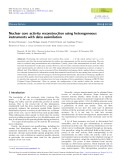
over the whole g-energy range. This ratio obtained for four
planar detectors of GRAPhEME is shown in Figure 2
together with the resulting geometry of the simulated
crystal. The dispersion of the C/E ratio is then used to
assess the g-efficiency uncertainty resulting in a typical
value of 2%. One can remark that this uncertainty is
dominated by the uncertainty coming from the initial
activity of the
152
Eu sources which is 1.4%.
Once the g-efficiency is well characterized, the last
parameter to determine is the number of atoms in the
sample. To do this, we use as prior estimation, the
information provided by the EC-JRC-Geel target prepa-
ration laboratory that weighted and measured the size of
the sample. As a typical example, for a
nat
U, the mass, the
diameter and the thickness are given respectively with a
relative uncertainty of 10
3
%, 4.10
2
% and 3.3%. The use
of active samples allows to determine directly the number
of atoms of interest in the sample. Indeed we determine the
number of atoms from the number of counts in g-peaks
from radioactivity (corrected by the g-efficiency) regis-
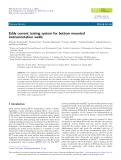
tered during off-beam runs. This supplies a mass
measurement for each g-peak as shown in Figure 3 in
agreement (0.4%) with the weighted mass. Finally, the
average number of
238
U nuclei is known with an
uncertainty of 3%.
All these uncertainties lead to a total uncertainty for
the (n,xng) cross sections ranging from ∼4% to 20% or
more when the statistics is very low due to, for example,
measurement time or available neutron flux. If one wants to
decrease the final uncertainty, it is necessary to have more
precisely calibrated sources and improve the method for
the determination of the number of atoms in the sample.
During the development of GRAPhEME, the analysis
Fig. 2. On the top is represented the adjusted geometry of a
HPGe planar crystal obtained during the C/E optimization
(bottom) procedure for g-efficiency calibration.
M. Kerveno et al.: EPJ Nuclear Sci. Technol. 4, 23 (2018) 3

procedure and the uncertainties treatment was originally
performed with deterministic method. A new MC approach
has been recently developed as described in the next
section.
3.2 Deterministic versus Monte Carlo method for
uncertainty treatment
To enrich the analysis procedure related to the GRAPh-
EME setup and to deeper understand and manage the
uncertainty issues in our work, we have recently developed
a new analysis program based on the Monte Carlo method
for the (n,xng) cross section determination. In this
program, all the parameters involved in the (n,xng) cross
sections are varied randomly within probability distribu-
tions. For the fission chamber and g-efficiencies, a Gaussian
distribution is considered with a standard deviation of 2.1%
and 2% respectively. The pile-up correction factor for
fission chamber and HPGe detectors is also varied in a
Gaussian distribution within a few percent. The number of
atoms is varied in a Gaussian distribution with standard
deviation of 2%. The Monte Carlo analysis gives also the
possibility to take into account the source of the
uncertainty related to the time determination which is
less direct in the deterministic ones. This effect is simulated
with flat distributions by ±5 ns for the fission chamber
events and ±10 ns (sampling period) for the HPGe events.
The cross section is calculated for each set of parameters
and a number of about 25 iterations is needed to reach
convergence. The result for a g-transition (111 keV in
184
W) is shown in Figure 4. Due to the discrete time
distribution of gamma events (in 10 ns wide bins), some
combinations of parameters can lead to quantified
increases in the calculated cross section, in particular on
the edges, as one can see at high neutron energy in Figure 4.
Best uncertainty assessment requires the comparison
between two standard analysis procedures that are the
deterministic and the Monte Carlo. In our case, the two
methods have been developped independantly by different
person and then, we analyzed the uncertainty behavior and
magnitudes in each method for the 122 keV g-transition in
186
W. For the deterministic method, the cross section
uncertainty is calculated taking into account classical error
propagation through equation (1). The statistical uncer-
tainty (related to the number of counts) and the systematic
uncertainties (coming from detector efficiencies, number of
atoms in the target and (n,f) cross section) are estimated
separately. The statistical uncertainty takes into account
the pile-up correction uncertainty which can reach 2%. In
the Monte Carlo method, the statistical uncertainty is
related to the error on gand neutron counts. The
systematic one is associated to the dispersion of the cross
section results obtained after MC calculations. Figure 5
shows the relative uncertainties (total, statistical and
systematic) obtained by the two methods. The overall
behavior (high uncertainties at low and high neutron
energy and plateau up to 5 MeV) of the total uncertainty is
in agreement between the two methods. One can notice also
that for the MC treatment, the statistical error magnitude
is slightly lower than for the one estimated by deterministic
approach where the pile-up uncertainty is included in the
statistical uncertainty. A significant difference is observed
between systematic errors which are almost constant in the
deterministic method and dependent of the neutron energy
in MC ones. This dependency can be mainly attributed to
the dispersion on the time determination which is taken
into account in the MC method and not in the deterministic
one.
In conclusion, the two methods give similar results in
magnitude but, as all uncertainties are not treated in the
same way, some differences arise.
3.3 Covariance and correlation matrices with Monte
Carlo method
In such experiment the source of correlations are numerous
and arise from different effects as common parameters (the
sample mass, the g-efficiency which is determined with the
same calibrated sources or the neutron flux) are using for
each angular differential cross section determination. This
contributes to strong correlation when the total (n,xng)
cross section is calculated via the Gauss quadrature. A first
investigation of covariance and correlation determination
has been performed for the GAINS setup in the case of
56
Fe
(n,n0g) reaction as explained in reference [9]. For the
GRAPhEME setup, it was not yet done but the
development of the new MC analysis program described
in the previous section, gives us the opportunity to start
this study. Indeed an asset of the Monte Carlo method is
the possibility to produce almost directly the covariance
and correlation matrices associated with the cross section
determination. After Monte Carlo processing, each
individually calculated cross section is stored and then
processed with the NumPy python package [10]toproduce
covariance and correlation matrices. Figure 6 displays the
correlation matrix for the 111 keV g-transition cross
section in
184
W which is representative of posterior
matrices. As expected, the cross sections are fully
correlated, positively or negatively, between low and high
neutron energies. This correlation is due to time
determination uncertainty simulated by time variation
(i.e. limits of the time windows) considering the number of
observed g’s as obviously constant. More investigations
and tests are planned for deeper understanding of these
phenomena.
Fig. 3. Calculated
238
U mass as a function of the analysed
g-peaks from radioactivity of the sample.
4 M. Kerveno et al.: EPJ Nuclear Sci. Technol. 4, 23 (2018)

4 From (n,xng) to (n,xn) cross sections
4.1 Nuclear structure sensitivity studies
As mentioned in Section 2, well-known nuclear structure
data are key ingredient for the (n,xng) technique since the
level scheme of the nucleus and other related nuclear
parameters are necessary to deduce the (n,xn) cross section
for any chosen way (directly from (n,xng) cross sections or
using nuclear reaction codes, see Fig. 1). When the
(n,xn) cross section s
nxn
is deduced from the measured
(n,xng), the (n,xn) cross section is the sum of the individual
level L
i
cross section snxn;LiðEÞas described in the following
formula:
snxn EðÞ¼ X
ExLi
ðÞE
i¼1
snxn;LiEðÞ ð2Þ
where E
x
is the excitation energy of the level L
i
and Eis the
incident neutron energy in the center of mass system. As
the level production cross section can also be expressed as a
function of measured (n,xng) cross section s
nxn,g
(E,
L
i
!L
j
), s
nxn
can be written as:
snxn EðÞ¼ X
ExLi
ðÞEin
i¼1
snxn;gE;Li!Lj
pL
i!g:s:ðÞ
pgLi!Lj
ð3Þ
where pand p
g
are respectively the total (gand internal
conversion) and g-ray emission probabilities for the
transition L
i
to L
j
. g.s. is the ground state. Thus this
method can be applied if at least one g-ray per excited level
is observed but with the condition that level scheme and
g-transition probabilities are well-known. In the case of
Fig. 5. Comparison of the relative uncertainties total,
statistical and systematic of (n,xng) cross sections obtained
using the deterministic method (line) and the Monte Carlo
method (dashed line) for 122 keV g-transition in
186
W.
Fig. 6. Correlation matrix obtained for the (n,xng) cross section
of the 111 keV g-transition in
184
W.
Fig. 4. (n,xng) cross sections of the 111 keV g-transition in
184
W obtained with the Monte Carlo procedure. The thick black line is the
final cross section associated with its standard deviation.
M. Kerveno et al.: EPJ Nuclear Sci. Technol. 4, 23 (2018) 5


![Tập bài giảng Thiết bị điện lạnh [mới nhất]](https://cdn.tailieu.vn/images/document/thumbnail/2026/20260224/diegomaradona04/135x160/27591772015351.jpg)


