Critical Care December 2002 Vol 6 No 6 Dubin et al.
Open Access
Research Intramucosal–arterial PCO2 gap fails to reflect intestinal dysoxia in hypoxic hypoxia Arnaldo Dubin1, Gastón Murias2, Elisa Estenssoro3, Héctor Canales4, Julio Badie5, Mario Pozo2, Juan P Sottile4, Marcelo Barán6, Fernando Pálizas7 and Mercedes Laporte8
1Principal Investigator, Cátedra de Farmacologia, Facultad de Ciencias Médicas, Universidad Nacional de La Plata, Argentina 2Research Fellow, Cátedra de Farmacología, Facultad de Ciencias Médicas, Universidad Nacional de La Plata, Argentina 3Medical Director, Servicio de Terapia Intensiva, Hospital San Martín de La Plata, Argentina 4Staff physician, Servicio de Terapia Intensiva, Hospital San Martín de La Plata, Argentina 5Research Fellow, Cátedra de Farmacología, Facultad de Ciencias Médicas, Universidad Nacional de La Plata, Argentina 6Medical Director, Unidad de Transplante Renal, CRAI Sur, CUCAIBA, Argentina 7Medical Director, Servicio de Terapia Intensiva, Clínica Bazterrica de Buenos Aires, Argentina 8Director, Servicio de Laboratorio, Hospital San Martín de La Plata, Argentina
Correspondence: Arnaldo Dubin, adee@infovia.com.ar
Received: 1 May 2002 Critical Care 2002, 6:514-520 (DOI 10.1186/cc1813) This article is online at http://ccforum.com/content/6/6/514 Revisions requested: 4 July 2002
Revisions received: 5 August 2002
Accepted: 6 August 2002
Published: 28 August 2002 © 2002 Dubin et al., licensee BioMed Central Ltd (Print ISSN 1364-8535; Online ISSN 1466-609X). This article is published in Open Access: verbatim copying and redistribution of this article are permitted in all media for any non-commercial purpose, provided this notice is preserved along with the article's original URL.
Abstract Introduction An elevation in intramucosal–arterial PCO2 gradient (∆PCO2) could be determined either by tissue hypoxia or by reduced blood flow. Our hypothesis was that in hypoxic hypoxia with preserved blood flow, ∆PCO2 should not be altered. Methods In 17 anesthetized and mechanically ventilated sheep, oxygen delivery was reduced by decreasing flow (ischemic hypoxia, IH) or arterial oxygen saturation (hypoxic hypoxia, HH), or no intervention was made (sham). In the IH group (n = 6), blood flow was lowered by stepwise hemorrhage; in the HH group (n = 6), hydrochloric acid was instilled intratracheally. We measured cardiac output, superior mesenteric blood flow, gases, hemoglobin, and oxygen saturations in arterial blood, mixed venous blood, and mesenteric venous blood, and ileal intramucosal PCO2 by tonometry. Systemic and intestinal oxygen transport and consumption were calculated, as was ∆PCO2. After basal measurements, measurements were repeated at 30, 60, and 90 minutes. Results Both progressive bleeding and hydrochloric acid aspiration provoked critical reductions in systemic and intestinal oxygen delivery and consumption. No changes occurred in the sham group. ∆PCO2 increased in the IH group (12 ± 10 [mean ± SD] versus 40 ± 13 mmHg; P < 0.001), but remained unchanged in HH and in the sham group (13 ± 6 versus 10 ± 13 mmHg and 8 ± 5 versus 9 ± 6 mmHg; not significant). Discussion In this experimental model of hypoxic hypoxia with preserved blood flow, ∆PCO2 was not modified during dependence of oxygen uptake on oxygen transport. These results suggest that ∆PCO2 might be determined primarily by blood flow.
Keywords blood flow, carbon dioxide, hypoxia, oxygen consumption, tonometry
Introduction
Tonometry is one of the few clinical tools available for the monitoring of tissue oxygenation [1]. Decreases in gastro-
intestinal intramucosal pH (pHi) have usually been considered as indicators of dysoxia [2–5]; that is, as heralds of insufficient O2 to meet tissue demands. Recently, the intramucosal–
514 ANOVA = analysis of variance; CO = cardiac output; DO2 = oxygen transport; ∆PCO2 = intramucosal–arterial PCO2 gradient; FiO2 = fraction of inspired oxygen; HH = hypoxic hypoxia; IH = ischemic hypoxia; pHi = intramucosal pH; VO2 = oxygen uptake.
Arterial mixed venous and mesenteric venous PO2, PCO2, and pH, and haemoglobin concentrations and saturations were measured with a blood gas analyzer and a co-oximeter, respectively (ABL 30 and OSM 3; Radiometer, Copenhagen, Denmark). Systemic and intestinal oxygen transport and uptake (DO2, VO2, intestinal DO2, and intestinal VO2 respec- tively) were calculated with standard formulae.
arterial PCO2 gradient (∆PCO2) has been claimed to be a better marker of gastrointestinal mucosal state of oxygenation [6]. PCO2 can increase in intestinal lumen by two mechanisms [7]. One is by bicarbonate buffering of protons from the breakdown of high-energy phosphates and metabolic acids generated anaerobically, such as lactate, in which case increased PCO2 would represent tissue dysoxia. Alternatively, in an aerobic state, it might be the result of hypoperfusion and decreased washout. In this latter case, oxygen metabo- lism could be preserved if the flow were adequate.
Intramucosal PCO2 was measured by saline tonometry (TRIP Sigmoid Catheter; Tonometrics, Inc., Worcester, Massachu- setts, USA) [8]. After an equilibration period of 30 minutes, 1.0 ml was discarded. PCO2 was measured in the remnant (ABL 30; Radiometer). pHi and ∆PCO2 were calculated with a correction factor for the equilibration time. Kolkman et al. [9] showed that the variability of intramucosal PCO2 measure- ments is independent of dwell time. Assessments at short dwell times should therefore be reliable.
Grum et al. [2] found that pHi and intestinal oxygen uptake (VO2) were correlated in ischemia, in hypoxemia, and in a combination of both. However, in hypoxemic experiments, neither VO2 nor pHi fell. Hence, the value of tonometry in hypoxemia remains uncertain. If a rise in ∆PCO2 reflected only a decrease in blood flow, this gradient might not be altered in hypoxemia, in which cardiac output (CO) is usually main- tained and even increased. Our hypothesis was that ∆PCO2 would not be modified in hypoxic hypoxia (HH) with pre- served blood flow.
We calculated venoarterial and intramucosal–arterial CO2 content differences to evaluate the changes in the CO2 dis- sociation curve [10]. To compute intramucosal CO2 content, intramucosal PCO2, pH, and mesenteric venous oxygen satu- ration were considered as representative of mucosal blood.
Available online http://ccforum.com/content/6/6/514
Experimental procedure
After a stabilization period of at least 30 minutes, we per- formed basal measurements (0 minutes). Sheep were then assigned to ischemic hypoxia (IH [n = 6]), HH (n = 6), or sham (n = 5) groups. In the IH group, bleeding was per- formed in three steps of 10 ml/kg at intervals of 30 minutes. In the HH group, 2 ml/kg 0.1 M hydrochloric acid was instilled into the trachea, and FiO2 was raised to 0.50. Saline solution was infused to keep intestinal blood flow constant. Measurements were repeated at 30, 60, and 90 minutes. Body temperature was maintained stable with a heating lamp.
Finally, animals were killed with supplemental pentobarbital and a KCl bolus. Indian ink was infused through the superior mesenteric artery, and dyed intestinal segments were dis- sected and weighed.
Methods Surgical preparation This study was approved by the local Animal Care Committee. Care of studied animals was in accordance with National Insti- tutes of Health guidelines. Seventeen adult sheep (26.0 ± 9.1 kg [mean ± SD]) were anesthetized with 30 mg/kg sodium pentobarbital, tracheostomized and then ventilated (Harvard Pump Ventilator; Harvard Apparatus, South Natick, Massachusetts, USA) with a tidal volume of 15 ml/kg, a respi- ratory rate of 12 per minute, and a positive end-expiratory pressure of 5 cmH2O throughout the experiment. The starting fraction of inspired oxygen (FiO2) was 0.21. Additional pento- barbital was administered if necessary. Neuromuscular block- ade was provided with a single dose of pancuronium (0.06 mg/kg). Catheters were placed into the femoral artery and vein and into the pulmonary artery (flow-directed thermod- ilution fiberoptic pulmonary artery catheter; Abbott Critical Care Systems, Mountain View, California, USA).
Statistical analysis
After performing a midline laparotomy, we performed splenectomy and a gastrostomy with drainage of gastric con- tents. We placed an electromagnetic blood flow transducer around the superior mesenteric artery. A catheter was advanced into the superior mesenteric vein, and a tonometer was inserted into the ileum.
Measurements and derived calculations
Data are expressed as means ± SD except where noted oth- erwise. Analysis within groups was performed with a repeated-measures analysis of variance (ANOVA) and a paired t-test with Bonferroni correction. One-way ANOVA and unpaired t-test with Bonferroni correction were used for one-time comparisons. In both cases, t-tests were used when ANOVA results were significant; P < 0.05 was considered significant.
Results Hemoglobin concentration, and arterial, mixed venous, and mesenteric venous blood gases and oxygen saturations in basal conditions, and during IH and HH and in the sham group are shown in Table 1.
CO was measured in triplicate by the thermodilution technique, with 5 ml of iced saline (HP OmniCare Model 24 A 10; Hewlett Packard, Andover, Massachusetts, USA), and was referred to body weight. Superior mesenteric artery blood flow (intestinal blood flow) was measured by the electromagnetic method (Spectramed Blood Flowmeter model SP 2202 B; Spectramed Inc., Oxnard, California, USA) and indexed to intestinal weight.
515
Critical Care December 2002 Vol 6 No 6 Dubin et al.
Table 1
Hemoglobin concentration and arterial, mixed venous, and mesenteric venous blood gases and oxygen saturations in basal conditions and during ischemic hypoxia (HI) and hypoxic hypoxia (HH), and in the sham group
Parameter Group Basal 30 minutes 60 minutes 90 minutes
Hemoglobin (g%) IH 9.1 ± 0.6 8.6 ± 0.6 7.9 ± 1.1* 7.4 ± 1.3* HH 10.2 ± 1.2 10.7 ± 1.0‡‡ 11.2 ± 1.1‡‡ 11.4 ± 1.2*‡‡ SHAM 10.7 ± 1.6 11.0 ± 1.4‡‡ 11.4 ± 1.3‡‡ 11.2 ± 1.1‡‡ Arterial pH IH 7.36 ± 0.10 7.35 ± 0.07 7.31 ± 0.10 7.25 ± 0.11* HH 7.41 ± 0.07 7.26 ± 0.10** 7.21 ± 0.12** 7.15 ± 0.13** SHAM 7.37 ± 0.09 7.39 ± 0.10 7.38 ± 0.10 7.36 ± 0.13 IH 33 ± 3 31 ± 4 28 ± 3**† 24 ± 4**†† Arterial PCO2 (mmHg) HH 29 ± 3 40 ± 8* 45 ± 11* 49 ± 13** SHAM 30 ± 4 28 ± 3† 28 ± 3† 28 ± 6† IH 79 ± 10 81 ± 12 82 ± 12† 91 ± 7†† Arterial PO2 (mmHg) HH 91 ± 16 59 ± 23** 50 ± 13** 44 ± 7** SHAM 88 ± 12 86 ± 20 85 ± 20† 80 ± 17†† IH 91.2 ± 2.9 90.7 ± 3.4 90.1 ± 3.0† 91.8 ± 2.8†† Arterial O2 saturation HH 96.3 ± 3.0 69.9 ± 21.9* 60.0 ± 22.0* 52.3 ± 15.8** SHAM 96.1 ± 3.6 95.7 ± 3.2 94.9 ± 4.6† 93.0 ± 7.5†† Mixed venous pH IH 7.31 ± 0.06 7.28 ± 0.08 7.19 ± 0.11* 7.09 ± 0.11** HH 7.36 ± 0.08 7.23 ± 0.10** 7.17 ± 0.13** 7.10 ± 0.13** SHAM 7.33 ± 0.09 7.33 ± 0.10 7.33 ± 0.10 7.34 ± 0.12§ IH 41 ± 3 46 ± 4 49 ± 5* 43 ± 4 Mixed venous PCO2 (mmHg) HH 36 ± 5 52 ± 12* 59 ± 15* 47 ± 9* SHAM 36 ± 5 33 ± 4§§ 32 ± 6§§ 35 ± 6 IH 34 ± 4 20 ± 5** 18 ± 4** 27 ± 6** Mixed venous PO2 (mmHg) HH 38 ± 7 28 ± 10** 24 ± 8** 30 ± 11 SHAM 40 ± 6 42 ± 9§ 43 ± 9§§ 36 ± 8 IH 44.6 ± 11.0 28.4 ± 14.3* 16.4 ± 10.1** 11.2 ± 3.3** Mixed venous O2 saturation HH 52.9 ± 11.8 33.4 ± 21.5* 26.6 ± 18.6* 19.0 ± 12.0** SHAM 55.2 ± 12.1 53.3 ± 10.9‡ 48.5 ± 16.5§§ 48.8 ± 18.5§§ Mesenteric venous pH IH 7.30 ± 0.09 7.28 ± 0.10 7.21 ± 0.12* 7.15 ± 0.14* HH 7.35 ± 0.10 7.21 ± 0.13** 7.16 ± 0.15** 7.10 ± 0.16** SHAM 7.35 ± 0.09 7.35 ± 0.09 7.33 ± 0.10 7.34 ± 0.10§ IH 42 ± 4 44 ± 4 44 ± 5 43 ± 4 Mesenteric venous PCO2 (mmHg) HH 39 ± 9 54 ± 18 60 ± 21 49 ± 14 SHAM 36 ± 4 33 ± 4§ 32 ± 6§ 33 ± 4§ IH 38 ± 8 25 ± 4* 25 ± 4* 32 ± 6* Mesenteric venous PO2 (mmHg) HH 38 ± 6 29 ± 10* 26 ± 9* 33 ± 10 SHAM 43 ± 7 42 ± 9‡ 43 ± 9§ 42 ± 10 IH 52.3 ± 16.8 41.6 ± 13.3** 30.2 ± 11.5** 20.3 ± 4.9** Mesenteric venous O2 saturation HH 57.5 ± 15.0 36.2 ± 23.1* 29.1 ± 23.2* 23.9 ± 17.5** SHAM 67.5 ± 10.5 63.3 ± 14.6 63.3 ± 14.6‡‡† 65.1 ± 16.4§§
artery
blood
(0.104 ± 0.024
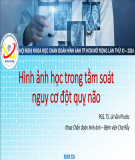
Systemic and intestinal supply dependence was induced in both the IH and HH groups. There were no significant changes in systemic and intestinal DO2 and VO2 in the sham group (Figure 1). In the IH group, supply dependence appeared with critical decreases in CO and superior mesen-
teric versus flow 0.048 ± 0.006 l/min per kg, and 0.664 ± 0.227 versus 0.258 ± 0.082 l/min per kg, respectively; P < 0.0001). In the HH group it was due to a progressive decrease in arterial oxygenation. CO and intestinal blood flow were maintained
* P < 0.05 versus basal; ** P < 0.01 versus basal; † P < 0.05 versus hypoxic hypoxia; †† P < 0.01 versus hypoxic hypoxia; ‡ P < 0.05 versus ischemic hypoxia; ‡‡ P < 0.01 versus ischemic hypoxia; § P < 0.05 versus ischemic and hypoxic hypoxia; §§ P < 0.01 versus ischemic and hypoxic hypoxia (paired or unpaired t-tests with Bonferroni correction, after analysis of variance < 0.05).
516
Available online http://ccforum.com/content/6/6/514
8.0
40.0
(b)
(a)
7.0
35.0
ISCHEMIC HYPOXIA HYPOXIC HYPOXIA SHAM
ISCHEMIC HYPOXIA HYPOXIC HYPOXIA SHAM
6.0
30.0
5.0
25.0
i
i
) g k r e p n m
) g k r e p n m
*
/ l
/ l
m
m
(
(
i
4.0
20.0
*
§ *
§ *
* * § §
n o i t p m u s n o c n e g y x o l a n i t s e t n I
n o i t p m u s n o c n e g y x o c m e t s y S
* §
3.0
15.0
2.0
10.0
2.0
4.0
6.0
8.0
10.0 12.0 14.0 16.0 18.0
20.0
40.0
60.0
80.0
100.0
120.0
Systemic oxygen transport (ml/min per kg)
Intestinal oxygen transport (ml/min per kg)
Figure 1
Systemic and intestinal oxygen supply dependence. (a) Relationship between systemic oxygen transport and consumption during ischemic and hypoxic hypoxia, and in the sham group. (b) Relationship between intestinal oxygen transport and consumption during ischemic and hypoxic hypoxia, and in the sham group. Data are expressed as means ± SEM. * P < 0.05 versus basal oxygen consumption. § P < 0.05 versus sham group.
60
ISCHEMIC HYPOXIA
HYPOXIC HYPOXIA
50
SHAM
§ *
) g H m m
(
2
40
§ *
O C P
30
§
l
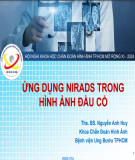
(0.446 ± 0.085 versus 0.431 ± 0.140 ml/min per kg, respec- tively; not significant), owing to the administration of normal saline (median 630 ml; range 20–1310 ml). Arterial and intra- mucosal pH fell significantly in the IH and HH groups. In the HH group it was primarily related to systemic respiratory and metabolic acidosis (Tables 1 and 2), because ∆PCO2 did not increase. In addition, systemic and intestinal venoarterial PCO2 gradients were not modified. CO2 content differences also did not change (Table 2 and Figure 2). In contrast, in the IH group, ∆PCO2, systemic and intestinal venoarterial PCO2, and CO2 content gradients increased significantly (Table 2 and Figure 2). In the sham group, CO2 gradients and pHi remained unchanged.
20
l a i r e t r a – a s o c u m a r t n I
10
0
0
20
40
60
80
100
120
Intestinal O2 transport (ml/min per kg)
Figure 2
Relationship between intestinal oxygen transport and intramucosal–arterial PCO2 difference during ischemic and hypoxic hypoxia, and in the sham group. Data are expressed as means ± SEM. * P < 0.05 versus basal intramucosal–arterial PCO2 difference. § P < 0.05 versus hypoxic hypoxia and sham group.
Discussion Increased mucosal intestinal PCO2 is used as a tool to detect tissue dysoxia, the condition in which O2 delivery can no longer sustain O2 uptake [11]. A great body of literature sup- ports the role of intestinal PCO2 as an early marker of dysoxia and regional hypoperfusion. Early studies considered pHi as the reference parameter. Recently, some investigators have claimed that intramucosal PCO2, the variable actually mea- sured by the tonometer, and ∆PCO2 could more adequately reflect mucosal oxygenation [6,12]. pHi is a calculated vari- able, from the Henderson–Hasselbach equation, with the assumption that arterial bicarbonate is representative of intra- mucosal bicarbonate. In a steady state, both values might be similar. However, in rapidly changing physiological situations, differences between arterial and mucosal CO2 might arise owing to slow CO2 equilibrium kinetics [13]. Therefore, pHi values calculated from tonometry might differ from those
directly measured with tissue electrodes [14]. Moreover, in the absence of acid–base states could influence pHi altered mucosal oxygenation. As a result, the acid–base
517
Critical Care December 2002 Vol 6 No 6 Dubin et al.
Table 2
CO2 gradients and intramucosal pH during ischemic hypoxia (IH) and hypoxic hypoxia (HH), and in the sham group
Parameter Group Basal 30 minutes 60 minutes 90 minutes
IH 19 ± 5**†† 25 ± 4**†† 8 ± 2 12 ± 3*† Mixed venous–arterial PCO2 (mmHg) HH 7 ± 2 7 ± 3 8 ± 3 9 ± 3 SHAM 5 ± 2 7 ± 3† 6 ± 3‡‡ 5 ± 3‡‡ IH 10.9 ± 2.5*†† 14.3 ± 3.6*†† 4.3 ± 1.6 7.2 ± 4.8 Mixed venous–arterial CO2 content (vol%) HH 4.6 ± 1.7 3.5 ± 1.4 3.4 ± 2.0 3.2 ± 1.0 SHAM 4.0 ± 4.8 5.7 ± 3.1 6.9 ± 2.1 2.7 ± 1.8‡‡ IH 9 ± 4 12 ± 3*†† 16 ± 4** 19 ± 5††‡ Mesenteric venous–arterial PCO2 (mm Hg) HH 9 ± 5 5 ± 3 20 ± 10 6 ± 2 SHAM 6 ± 3 5 ± 2‡‡ 6 ± 1‡‡ 5 ± 2‡‡ IH 4.7 ± 1.2 7.2 ± 3.2 8.2 ± 2.4*†† 9.8 ± 2.2*†† Mesenteric venous–arterial CO2 content (vol%) HH 6.6 ± 5.7 3.8 ± 2.6 3.4 ± 2.4 3.4 ± 2.3 SHAM 3.0 ± 1.9 3.3 ± 1.1 5.4 ± 2.4 2.6 ± 1.8‡‡ IH 12 ± 10 19 ± 12*† 32 ± 17**†† 40 ± 13**††¶ Intramucosal–arterial PCO2 (mmHg) HH 13 ± 6 8 ± 8 13 ± 11 10 ± 13 SHAM 8 ± 5 11 ± 3‡ 10 ± 4‡‡ 9 ± 6‡‡ IH 2.0 ± 0.4 2.4 ± 0.6†† 2.8 ± 0.8*†† 3.3 ± 0.8**†† Intramucosal–arterial CO2 content (vol%) HH 2.0 ± 0.5 0.7 ± 0.8 0.9 ± 0.9 0.3 ± 1.2 SHAM 1.7 ± 0.4 1.9 ± 0.7 2.1 ± 0.9 1.7 ± 0.5‡ IH Intramucosal pH 7.24 ± 0.14 7.16 ± 0.16** 7.01 ± 0.22** 6.84 ± 0.21** HH 7.26 ± 0.14 7.19 ± 0.13** 7.10 ± 0.16** 7.07 ± 0.18** SHAM 7.28 ± 0.06 7.26 ± 0.09 7.17 ± 0.08 7.25 ± 0.10§§
status of arterial blood will be reflected in both mucosal pHi and PCO2 [6,14]. In our experiments, pHi fell progressively during hydrochloric acid-induced lung injury and decreased DO2, reflecting ongoing systemic respiratory and metabolic acidosis. However, ∆PCO2 remained unchanged.
Dill is lower than the measured %HbO2,v, anaerobic %HbO2,v production of CO2 might be assumed. Similar values would represent aerobic CO2 generation. Notwithstanding the origi- nal contribution of Schlichtig and Bowles [7] to the analysis of these topics, the use of low flow to produce critical oxygen delivery and falling VO2 has been signaled as a potential con- founding factor [18].
the measured
We studied these issues in a model of HH with preserved flow, because it allows a clear discrimination between hypoxia and hypoperfusion. There have been attempts to analyze pHi behavior in HH, but critical intestinal DO2 was not attained, and intestinal VO2 and pHi remained unchanged [2]. Our model consisted of an acute lung injury produced by endotracheal instillation of hydrochloric acid that rapidly gen- erated severe hypoxemia, shown by the decrease in arterial PO2 and pH. The acid also enhanced microvascular perme- ability [19–21], demonstrated by increased requirements of saline solution to maintain intestinal blood flow and by the increase in hemoglobin levels. However, other mechanisms could be acting to preserve blood flow, such as tachycardia and enhanced left ventricular contractility [22]. Deep arterial hypoxemia caused significant reductions in systemic and intestinal DO2, but systemic and intestinal blood flow were preserved and hemoglobin concentration increased. Despite
* P < 0.05 versus basal; ** P < 0.01 versus basal; † P < 0.05 versus hypoxic hypoxia; †† P < 0.01 versus hypoxic hypoxia; ‡ P < 0.05 versus ischemic hypoxia; ‡‡ P < 0.01 versus ischemic hypoxia; § P < 0.05 versus ischemic and hypoxic hypoxia; §§ P < 0.01 versus ischemic and hypoxic hypoxia (paired or unpaired t-tests with Bonferroni correction, after analysis of variance < 0.05).
Another issue that has been discussed extensively is the rela- tive impact on mucosal PCO2 of anaerobic production of CO2 in comparison with decreased washout of aerobically gener- ated CO2 during low flow states. Many investigators [15–17] have ascribed increased PCO2 found in shock states to con- tinuing aerobic CO2 production with decreased elimination; that is, to ‘respiratory acidosis’. However, Schlichtig and Bowles [7] showed evidence supporting the role of intramu- cosal PCO2 as a marker of dysoxia in extreme hypoperfusion, when VO2 falls. In a dog model of cardiac tamponade, they demonstrated that mucosal PCO2 could rise because of anaerobic CO2 production below the critical DO2. These con- clusions were drawn by using the Dill nomogram, which can theoretically detect anaerobic CO2 production from a com- (%HbO2,v) and calculated parison of Dill) venous oxyhemoglobin, within a given venous (%HbO2,v PCO2 value. Because venous PCO2 is considered to be repre- sentative of tissue PCO2, Schlichtig and Bowles made the cal- culation with its intestinal equivalent, intramucosal PCO2. If
518
Key messages
(cid:127)
The intramucosal–arterial PCO2 gradient fails to reflect intestinal oxygen supply dependence during hypoxic hypoxia
(cid:127) Blood flow seems to be the main determinant of
venoarterial and intramucosal–arterial PCO2 gradients
the increase in systemic and intestinal oxygen extraction, sys- temic and intestinal VO2 values decreased, and dependence of O2 uptake on transport ensued. Dependence of oxygen consumption on transport during HH has been described by Cain et al. in a classical study [23], and it has been consid- ered an indicator of anaerobic metabolism. Additional evi- dence of tissue dysoxia was the appearance of metabolic acidosis. Cain [24] also showed that there is a correlation between pH and lactate/pyruvate relationship in HH.
(cid:127)
Tonometry seems to be a useful method for monitoring perfusion, with limited value in detecting anaerobic metabolism when flow is preserved
only global microvascular blood flow changes can be assessed by laser Doppler flowmetry. Nevertheless, both studies show that ∆PCO2 could fail to reflect tissue dysoxia at some time during HH. In results similar to ours, Vallet et al. [28] showed that perfusion is a major determinant of venoar- terial PCO2 difference during critical IH or HH in isolated hindlimb. This gradient increases in ischemia and is pre- served in hypoxia.
Another potential confounding factor that could affect arterial and intestinal PCO2 and their differences is the shift of the CO2 dissociation curve. As Jakob et al. [25] have shown, there can be a lack of correlation of CO2 contents and PCO2, and, consequently, of their differences. Many determinants of the shifts of the CO2 dissociation curve, such as changes in pH, in hemoglobin concentrations, and especially in oxygen saturations (the Haldane effect), were present. To discard a possible increase in venoarterial and intramucosal–arterial CO2 contents without changes in PCO2 differences in the HH group, we calculated CO2 content differences. There were no increases in venoarterial and intramucosal–arterial CO2 content differences during the period of supply dependence, as there were no changes in both PCO2 differences. Shifts of the CO2 dissociation curve therefore do not seem to influ- ence our results.
Our model of HH is useful for discriminating the effects of hypoxia and low blood flow, because this last factor was kept constant throughout the experiment. ∆PCO2 remained stable, although there were signs of anaerobic metabolism. Systemic and venoarterial PCO2 differences also remained unchanged. Conversely, during supply dependence of VO2 induced by hemorrhage, ∆PCO2 and systemic and intestinal venoarterial PCO2 differences widened, as well as the respective ∆PCO2 content differences. Moreover, these parameters increased before any change in VO2, as we have described previously [26]. These results suggest that, at least in our experiments, tissue perfusion is a key determinant of increased ∆PCO2.
Venoarterial and intramucosal–arterial PCO2 gradients are the result of interactions of changes in aerobic and anaerobic CO2 production, the CO2 dissociation curve, and blood flow to tissues. During oxygen supply dependence induced by hemorrhage, opposite changes in aerobic and anaerobic CO2 production are present: aerobic CO2 production decreases as a consequence of depressed aerobic metabo- lism, but anaerobic CO2 production starts because of bicar- bonate buffering of protons from fixed acids. Total CO2 production might not increase, but O2 consumption falls, so there is an increase in respiratory quotient [29,30]. This increase in VCO2 relative to VO2 might generate tissue and venous hypercarbia only in low flow states, in which there is diminished CO2 removal. Other situations in which intramu- cosal acidosis could arise with preserved tissue perfusion are reperfusion injury [31] and cytopathic hypoxia generated by endotoxemia [32], with cellular damage and metabolic abnor- malities as underlying mechanisms. However, impaired villous microcirculation has been advocated as the causal phenome- non in the latter [33].
Available online http://ccforum.com/content/6/6/514
Conclusions To our knowledge, this is the first study showing that ∆PCO2 fails to mirror intestinal tissue dysoxia. Our findings also suggest that blood flow might be the main determinant of ∆PCO2. Tonometry seems to be a useful method for monitor- ing perfusion, with rather limited value in detecting anaerobic metabolism when blood flow is preserved. Additional studies in other models of hypoxic and anemic hypoxia are needed to confirm our findings and to resolve discrepancies between studies.
Competing interests None declared.
Nevière et al. [27] tested a similar hypothesis in pigs. They compared the effects of diminished blood flow with dimin- ished inspired fraction of oxygen. In IH, ∆PCO2 increased to 60 mmHg. In HH, ∆PCO2 increased to 30 mmHg only in the last step of hypoxemia, although mucosal blood flow mea- sured by laser Doppler flowmetry was preserved. The authors concluded that elevated intramucosal PCO2 indicated local CO2 generation. However, in the two previous stages of reduced FiO2 there was supply dependence, and ∆PCO2 remained unchanged. In our HH model, ∆PCO2 was also stable. The differences between our data and those of Nevière et al. [27] could be ascribed to distinct microvascular features of the experimental subjects (pigs and sheep) or to different degrees of hypoxemia. In addition, as Nevière et al. pointed out, some degree of decrease in gut mucosal blood flow and heterogeneity might have been present, because
519
Critical Care December 2002 Vol 6 No 6 Dubin et al.
References 1.
25. Jakob SM, Kosonen P, Ruokonen E, Parviainen I, Takala J: The Haldane effect – an alternative explanation for increasing gastric mucosal PCO2 gradients? Br J Anaesth 1999, 83:740- 746.
Third European Consensus Conference in Intensive Care Medi- cine: Tissue hypoxia: how to detect, how to correct, how to prevent? Am J Respir Crit Care Med 1996, 154:1573-1578. 2. Grum CM, Fiddian-Green RG, Pittenger GL, Grant BJ, Rothman ED, Dantzker DR: Adequacy of tissue oxygenation in intact dog intestine. J Appl Physiol 1984, 56:1065-1069. 26. Dubin A, Estensoro E, Murias G, Canales H, Sottile P, Badie J, Barán M, Pálizas F, Laporte M, Rivas Díaz M: Effects of hemor- rhage on gastrointestinal oxygenation. Intensive Care Med 2001, 27:1931-1936.
3. Doglio GR, Pusajo JF, Egurrola MA, Bonfigli GC, Parra C, Vetere L, Hernandez MS, Fernandez S, Palizas F, Gutierrez G: Gastric mucosal pH as a prognostic index of mortality in critically ill patients. Crit Care Med 1991, 19:1037-1040. 27. Nevière R, Chagnon J-L, Teboul J-L, Vallet B, Wattel FB: Small intestine intramucosal PCO2 and microvascular blood flow during hypoxic and ischemic hypoxia. Crit Care Med 2002, 30: 379-384.
4. Marik PE: Gastric intramucosal pH. A better predictor of multi- organ dysfunction and death than oxygen-derived variables in patients with sepsis. Chest 1993, 104:225-229. 28. Vallet B, Teboul JL, Cain S, Curtis S: Venoarterial CO2 differ- ence during regional ischemic or hypoxic hypoxia. J Appl Physiol 2000, 89:1317-1321.
29. Cohen IL, Sheik FM, Perkins RJ, Feustel PJ, Foster ED: Effects of hemorrhagic shock and reperfusion on the respiratory quo- tient in swine. Crit Care Med 1995, 23:545-552. 5. Maynard N, Bihari D, Beale R, Smithies M, Baldock G, Mason R, McColl I: Assessment of splanchnic oxygenation by gastric tonometry in patients with acute circulatory failure. JAMA 1993, 270:1203-1210.
30. Dubin A, Murias G, Estenssoro E, Canales H, Sottile P, Badie J, Barán M, Rossi S, Laporte M, Pálizas F, Giampieri J, Mediavilla D, Vacca E, Botta D: End-tidal CO2 pressure determinants during hemorrhagic shock. Intensive Care Med 2000, 26:1619-1623.
8. 31. Nielsen VG, Tan S, Baird MS, McCammon AT, Parks DA: Gastric impact of intramucosal pH and multiple organ failure: ischemia-reperfusion and xanthine-oxidase. Crit Care Med 1996, 24:1339-1344. 9.
32. VanderMeer TJ, Wang H, Fink MP: Endotoxemia causes ileal mucosal acidosis in the absence of mucosal hypoxia in a nor- modynamic porcine model of septic shock. Crit Care Med 1995, 23:1217-1226.
6. Schlichtig R, Metha N, Gayowski TJP: Tissue-arterial PCO2 dif- ference is a better marker of ischemia than intramural pH (pHi) or arterial pH-pHi difference. J Crit Care 1996, 11:51-56. 7. Schlichtig R, Bowles SA: Distinguishing between aerobic and anaerobic appearance of dissolved CO2 in intestine during low flow. J Appl Physiol 1994, 76:2443-2451. Taylor DE, Gutierrez G: Tonometry. A review of clinical studies. Crit Care Clin 1996, 12:1007-1018. Kolkman JJ, Steverink PJGM, Groeneveld ABJ, Meuwissen SGM: Characteristics of time-dependent PCO2 tonometry in the normal human stomach. Br J Anaesth 1998, 81:669-675. 10. Giovannini I, Chiarla C, Boldrini G, Castagneto M: Calculation of venoarterial CO2 concentration difference. J Appl Physiol 1993, 74:959-964.
33. Tugtekin IF, Radermacher P, Theisen M, Matejovic M, Stehr A, Ploner F, Matura K, Ince C, Georgieff M, Trager K: Increased ileal–mucosal–arterial PCO2 gap is associated with impaired villus microcirculation in endotoxic pigs. Intensive Care Med 2001, 27:757-766. 11. Connett RJ, Honig CR, Gayeski TE, Brooks GA: Defining hypoxia: a systems view of VO2, glycolysis, energetics and intracellular PO2. J Appl Physiol 1990, 68:833-842.
12. Vincent JL, Creteur J: Gastric mucosal pH is definitely obsolete – please tell us more about gastric mucosal PCO2. Crit Care Med 1998, 26:1479-1481.
13. Fiddian-Green RG: Gastric intramucosal pH, tissue oxygena- tion and acid–base status. Br J Anaesth 1995, 74:591-606. 14. Puyana JC, Soller BR, Parikh B, Heard SO: Directly measured tissue pH is an earlier indicator of splanchnic acidosis than tonometric parameters during hemorrhagic shock in swine. Crit Care Med 2000, 28:2557-2562.
15. Adrogue HJ, Rashad MN, Gorin AB, Yacoub J, Madias NE: Assessing acid-base status in circulatory failure. Differences between arterial and central venous blood. N Engl J Med 1989, 320:1312-1316.
16. Grundler W, Weil MH, Rackow EC: Arteriovenous carbon dioxide and pH gradients during cardiac arrest. Circulation 1986, 74:1071-1074.
17. Dubin A, Silva C, Calvo G, Valli J, Fariña O, Estenssoro E, Mordu- jovich P: End-tidal CO2 pressure in the monitoring of cardiac output during canine hemorrhagic shock. J Crit Care 1990, 5: 42-46.
18. Vallet B, Tavernier V, Lund N: Assessment of tissue oxygena- tion in the critically ill. In Yearbook of intensive care and emer- gency medicine. Edited by Vincent JL. Berlin: Springer-Verlag; 2000:715-725.
19. Manny J, Manny N, Lelcuk S, Alexander F, Feingold H, Kobzik L, Valeri CR, Shepro D, Hechtman HB: Pulmonary and systemic consequences of localized acid aspiration. Surg Gynecol Obstet 1986, 162:259-267.
20. St John RC, Mizer LA, Kindt GC, Weisbrode SE, Moore SA, Dorinsky PM: Acid aspiration-induced acute lung injury causes leukocyte-dependent systemic organ injury. J Appl Physiol 1993, 74:1994-2003.
21. Crouser ED, Julian MW, Weisbrode SE, Dorinsky PM: Acid aspi- ration results in ileal injury without altering ileal VO2/DO2 rela- tionships. Am J Respir Crit Care Med 1996, 153:1965-1971. 22. Schertel ER, Pratt JW, Schaeffer SL, Valentine AK, McCreary MR, Myerowitz PD: Effects of acid-induced lung injury on left ven- tricular function. Surgery 1996, 119:81-88. 23. Cain SM: Oxygen delivery and uptake in dogs during anemic and hypoxic hypoxia. J Appl Physiol 1977, 42:228-234.
520 24. Cain SM: pH effects on lactate and excess lactate in relation to O2 deficit in hypoxic dogs. J Appl Physiol 1977, 42:44-49.