
Genome Biology 2005, 6:R49
comment reviews reports deposited research refereed research interactions information
Open Access
2005Blanket al.Volume 6, Issue 6, Article R49
Research
Large-scale 13C-flux analysis reveals mechanistic principles of
metabolic network robustness to null mutations in yeast
Lars M Blank, Lars Kuepfer and Uwe Sauer
Address: Institute of Biotechnology, ETH Zürich, 8093 Zürich, Switzerland.
Correspondence: Uwe Sauer. E-mail: sauer@biotech.biol.ethz.ch
© 2005 Blank et al.; licensee BioMed Central Ltd.
This is an Open Access article distributed under the terms of the Creative Commons Attribution License (http://creativecommons.org/licenses/by/2.0),
which permits unrestricted use, distribution, and reproduction in any medium, provided the original work is properly cited.
Large-scale 13C-flux analysis in yeast<p>Genome-scale 13<sup>C</sup>-flux analysis in Saccharomyces cerevisiae revealed that the apparent dispensability of knockout mutants with metabolic function can be explained by gene inactivity under a particular condition, by network redundancy through dupli-cated genes or by alternative pathways.</p>
Abstract
Background: Quantification of intracellular metabolite fluxes by 13C-tracer experiments is
maturing into a routine higher-throughput analysis. The question now arises as to which mutants
should be analyzed. Here we identify key experiments in a systems biology approach with a
genome-scale model of Saccharomyces cerevisiae metabolism, thereby reducing the workload for
experimental network analyses and functional genomics.
Results: Genome-scale 13C flux analysis revealed that about half of the 745 biochemical reactions
were active during growth on glucose, but that alternative pathways exist for only 51 gene-encoded
reactions with significant flux. These flexible reactions identified in silico are key targets for
experimental flux analysis, and we present the first large-scale metabolic flux data for yeast,
covering half of these mutants during growth on glucose. The metabolic lesions were often
counteracted by flux rerouting, but knockout of cofactor-dependent reactions, as in the adh1, ald6,
cox5A, fum1, mdh1, pda1, and zwf1 mutations, caused flux responses in more distant parts of the
network. By integrating computational analyses, flux data, and physiological phenotypes of all
mutants in active reactions, we quantified the relative importance of 'genetic buffering' through
alternative pathways and network redundancy through duplicate genes for genetic robustness of
the network.
Conclusions: The apparent dispensability of knockout mutants with metabolic function is
explained by gene inactivity under a particular condition in about half of the cases. For the remaining
207 viable mutants of active reactions, network redundancy through duplicate genes was the major
(75%) and alternative pathways the minor (25%) molecular mechanism of genetic network
robustness in S. cerevisiae.
Background
The availability of annotated genomes and accumulated bio-
chemical evidence for individual enzymes triggered the
reconstruction of stoichiometric reaction models for net-
work-based pathway analysis [1,2]. For many microbes, such
network models are available at the genome scale, providing
a largely comprehensive metabolic skeleton by interconnect-
ing all known reactions in a given organism [3,4]. Thus, net-
work properties such as optimal performance, flexibility to
cope with ever-changing environmental conditions, and
Published: 17 May 2005
Genome Biology 2005, 6:R49 (doi:10.1186/gb-2005-6-6-r49)
Received: 1 February 2005
Revised: 8 March 2005
Accepted: 6 April 2005
The electronic version of this article is the complete one and can be
found online at http://genomebiology.com/2005/6/6/R49

R49.2 Genome Biology 2005, Volume 6, Issue 6, Article R49 Blank et al. http://genomebiology.com/2005/6/6/R49
Genome Biology 2005, 6:R49
enzyme dispensability (also referred to as robustness or
genetic robustness [5,6]) become mathematically tractable.
These computational advances are matched with post-
genomic advances in experimental methods that assess the
cell's molecular make-up at the level of mRNA, protein, or
metabolite concentrations. As the functional complement to
these compositional data, quantification of intracellular in
vivo reaction rates or molecular fluxes has been a focal point
of method development in the realm of metabolism [7-9].
Recent progress in increasing the throughput of stable-iso-
tope-based flux analyses [8,10,11] has allowed the quantifica-
tion of flux responses to more than just a few intuitively
chosen genetic or environmental perturbations [12-14]. Now
that flux quantification in hundreds of null mutants under a
particular condition is feasible in principle, the question
arises of which mutants should be analyzed.
As perhaps the most widely used model eukaryote, the yeast
Saccharomyces cerevisiae features a metabolic network of
about 1,200 reactions that represent about 750 biochemically
distinct reactions [3,15]. Is it necessary to quantify flux
responses to null mutations in all reactions for a comprehen-
sive view of the metabolic capabilities under a given condi-
tion? To address this question, we used a recently modified
version (iLL672; L Kuepfer, U Sauer and LM Blank, unpub-
lished work) of the original iFF708 genome-scale model pub-
lished by Förster et al. [3]. On the basis of this model, we
estimated the genome-scale flux distribution in wild-type S.
cerevisiae from 13C-tracer experiments, to identify the 339
biochemical reactions that were active during growth on glu-
cose. Yeast metabolism has the potential flexibility to use
alternative pathways for 105 of these active reactions. For a
major fraction of the potentially flexible reactions that cata-
lyze significant flux, we then constructed prototrophic knock-
out mutants to elucidate whether or not the alternative
pathway was used upon experimental knockout; that is,
whether it contributes to the genetic robustness of the net-
work [5,6]. For the purpose of this work, robustness is defined
as the ability to proliferate on glucose as the sole carbon
source upon knockout of a single gene with metabolic
function.
Results
Identification of flexible reactions in yeast metabolism
To identify all potentially flexible reactions in yeast glucose
metabolism that were active under a given condition, we used
the recently reconciled metabolic network model iLL672 with
1,038 reactions (encoded by 672 genes) that represent 745
biochemically distinct reactions (L Kuepfer, U Sauer and LM
Blank, unpublished work), which was based on the genome-
scale S. cerevisiae model iFF708 [3]. The main modifications
to the original model include elimination of dead-end reac-
tions and a new formulation of cell growth. It should be noted
that none of the results below critically depended on the net-
work model, but the reconciliation of iLL672 enabled a more
accurate discrimination between lethal and viable reactions
than iFF708, as was validated by large-scale growth experi-
ments (L Kuepfer, U Sauer and LM Blank, unpublished
work).
First, we identified all reactions active in wild-type glucose
metabolism by genome-scale flux analysis. For this purpose,
we determined the wild-type flux distribution in central
metabolism from a stable isotope batch experiment with 20%
[U-13C] and 80% unlabeled glucose. This flux solution was
then mapped to the genome scale by using minimization of
the Euclidean norm of fluxes as the objective function. In
total, 339 of the 745 biochemical reactions were active during
growth on glucose alone (Figure 1 and Additional data file 1),
which agrees qualitatively with the estimate of Papp et al.
[16]. Most active reactions (234) were essential: 155 are
encoded by singleton genes, 64 by two or more duplicate
genes and 15 by yet unknown genes (Figure 1; Additional data
file 1). In the entire network, only the remaining 105 reactions
(30 encoded by yet unknown genes) were active and poten-
tially flexible in the sense that they may be bypassed via alter-
native pathways (Figure 1). As fluxes in the peripheral
reactions were typically below 0.1% of the glucose uptake rate
(see Additional data file 1), we focused on the 51 gene-
encoded flexible reactions that catalyzed a flux of at least
0.1%. These 51 reactions were encoded by 75 genes (43 dupli-
cates, 23 singletons and 9 multiprotein complexes).
Physiological fitness of mutants deleted in flexible
reactions
In 38 of these genes, which encoded 28 of the 51 potentially
flexible and highly active reactions, we constructed pro-
totrophic deletion mutants by homologous recombination
[17] in the physiological model strain CEN.PK [18] (Figure 2).
The prototrophic background was chosen to minimize poten-
tial problems of amino-acid supplementation for quantitative
analysis [19]. These 38 experimental knockouts were in the
Genome-wide proportion of active, essential and flexible metabolic reactions during growth of S. cerevisiae (iLL672) on glucoseFigure 1
Genome-wide proportion of active, essential and flexible metabolic
reactions during growth of S. cerevisiae (iLL672) on glucose. Flexible
reactions are defined as having a non-zero flux but are not essential for
growth. The number of genes that encode biochemical reactions is given in
parentheses.
Total reactions of iLL672: 745
Active reactions: 339
234 essential reactions encoded by:
- singleton genes: 155(124)
- duplicate genes: 64(150)
- unknown: 15
105 non-essential
reactions
Non-essential reactions: 105
flexible reactions encoded by:
-singleton genes: 52(47)
-duplicate genes: 23(46)
-unknown: 30

http://genomebiology.com/2005/6/6/R49 Genome Biology 2005, Volume 6, Issue 6, Article R49 Blank et al. R49.3
comment reviews reports refereed researchdeposited research interactions information
Genome Biology 2005, 6:R49
pentose phosphate (PP) pathway, tricarboxylic acid (TCA)
cycle, glyoxylate cycle, polysaccharide synthesis, mitochon-
drial transporters, and by-product formation (Figure 2, Table
1). Genetically, the knockouts encompass 14 singleton and 24
duplicate genes, including six gene families of which all mem-
bers were deleted.
With the exception of gnd1, all 38 mutants grew with glucose
as the sole carbon source. The lethal phenotype of the gnd1
mutant is consistent with a previous report [20] and is similar
to the gndA mutant in Bacillus subtilis [21]. As in B. subtilis,
we could select gnd1 suppressor mutants on glucose (data not
shown). To assess the quantitative contribution of each gene
to the organism's fitness, we determined maximum specific
growth rates in minimal and complex medium using a well-
aerated microtiter plate system [22]. Mutant fitness was then
expressed as the normalized growth rate, relative to the
growth rate of the reference strain (Table 1). In contrast to the
previously reported competitive fitness [20,23,24], the fit-
ness determined here is a quantitative physiological value.
In complex YPD medium, physiological fitness in the 38 via-
ble haploid mutants was generally in qualitative agreement
with the competitive fitness [20]. Quantitatively, however,
our data seem to allow a better discrimination (Table 1), and
significant differences between physiological and competitive
fitness were seen in the adh1, fum1, and gpd1 mutants. Only
threemutants - adh1, fum1, and gly1 - exhibited a fitness
defect of 20% or greater (Table 2). gly1 lacks threonine
aldolase, which catalyzes cleavage of threonine to glycine
[25], hence its phenotype remains unexplained because gly-
cine was present in the YPD medium.
Table 1
Fitness of mutants with deletions in flexible central metabolic reactions
Physiological fitness* Competitive fitness†Physiological fitness Competitive fitness
Mutants MM YPD YPD Mutants MM YPD YPD
Reference strain 1 1 1
adh1/YOL086C 0.47 0.57 0.79 mdh2/YOL126C 0.89 0.98 1.01
adh3/YMR083W 0.92 0.87 0.98 mdh3/YDL078C 1.00 0.96 1.01
ald5/YER073W 1.02 0.94 1 mls1/YNL117W 1 0.98 1
ald6/YPL061W 0.34 0.87 0.9 oac1/YKL120W 0.71 0.94 1.01
cox5A/YNL052W 0.63 0.91 1 pck1/YKR097W 1 0.96 1
ctp1/YBR291C 0.91 1 0.97 pda1/YER178W 0.41 0.98 1
dal7/YIR031C 0.94 0.85 1 pgm1/YKL127W 0.82 0.94 1
fum1/YPL262W 0.52 0.62 0.93 pgm2/YMR105C 0.90 1 1
gnd1/YHR183W 0 0.87 1.01 rpe1/YJL121C 0.33 0.94 0.88
gnd2/YGR256W 0.83 0.98 1 sdh1/YKL148C 0.72 0.94 1
gcv2/YMR189W 0.92 0.94 1 ser33/YIL074C 0.92 0.94 1.01
gly1/YEL046C 0.79 0.74 0.87 sfc1/YJR095W 0.84 0.96 1.01
gpd1/YDL022W 1 0.98 0.84 sol1/YNR034W 0.91 1 1.02
icl1/YER065C 1 1 1 sol2/YCRX13W 0.99 0.98 1
idp1/YDL066W 0.92 0.94 1.03 sol3/ YHR163W 0.71 0.94 1
idp2/YLR174W 0.86 0.96 0.95 sol4/ YGR248W 0.95 0.91 1.01
lsc1/YOR142W 1.05 0.93 1 tal1/ YLR354C 0.89 0.94 1
mae1/YKL029C 1.01 0.96 1 YGR043C 0.92 0.87 1.02
mdh1/YKL085W 0.72 0.91 1 zwf1/YNL241C 0.38 0.96 ND
*Physiological fitness is defined as the maximal specific growth rate of a mutant normalized to the reference strain CEN.PK 113-7D ho::kanMX4. The
average from triplicate experiments is shown. The standard deviation was generally below 0.05. †From Steinmetz et al. [20]. ND, not detected.
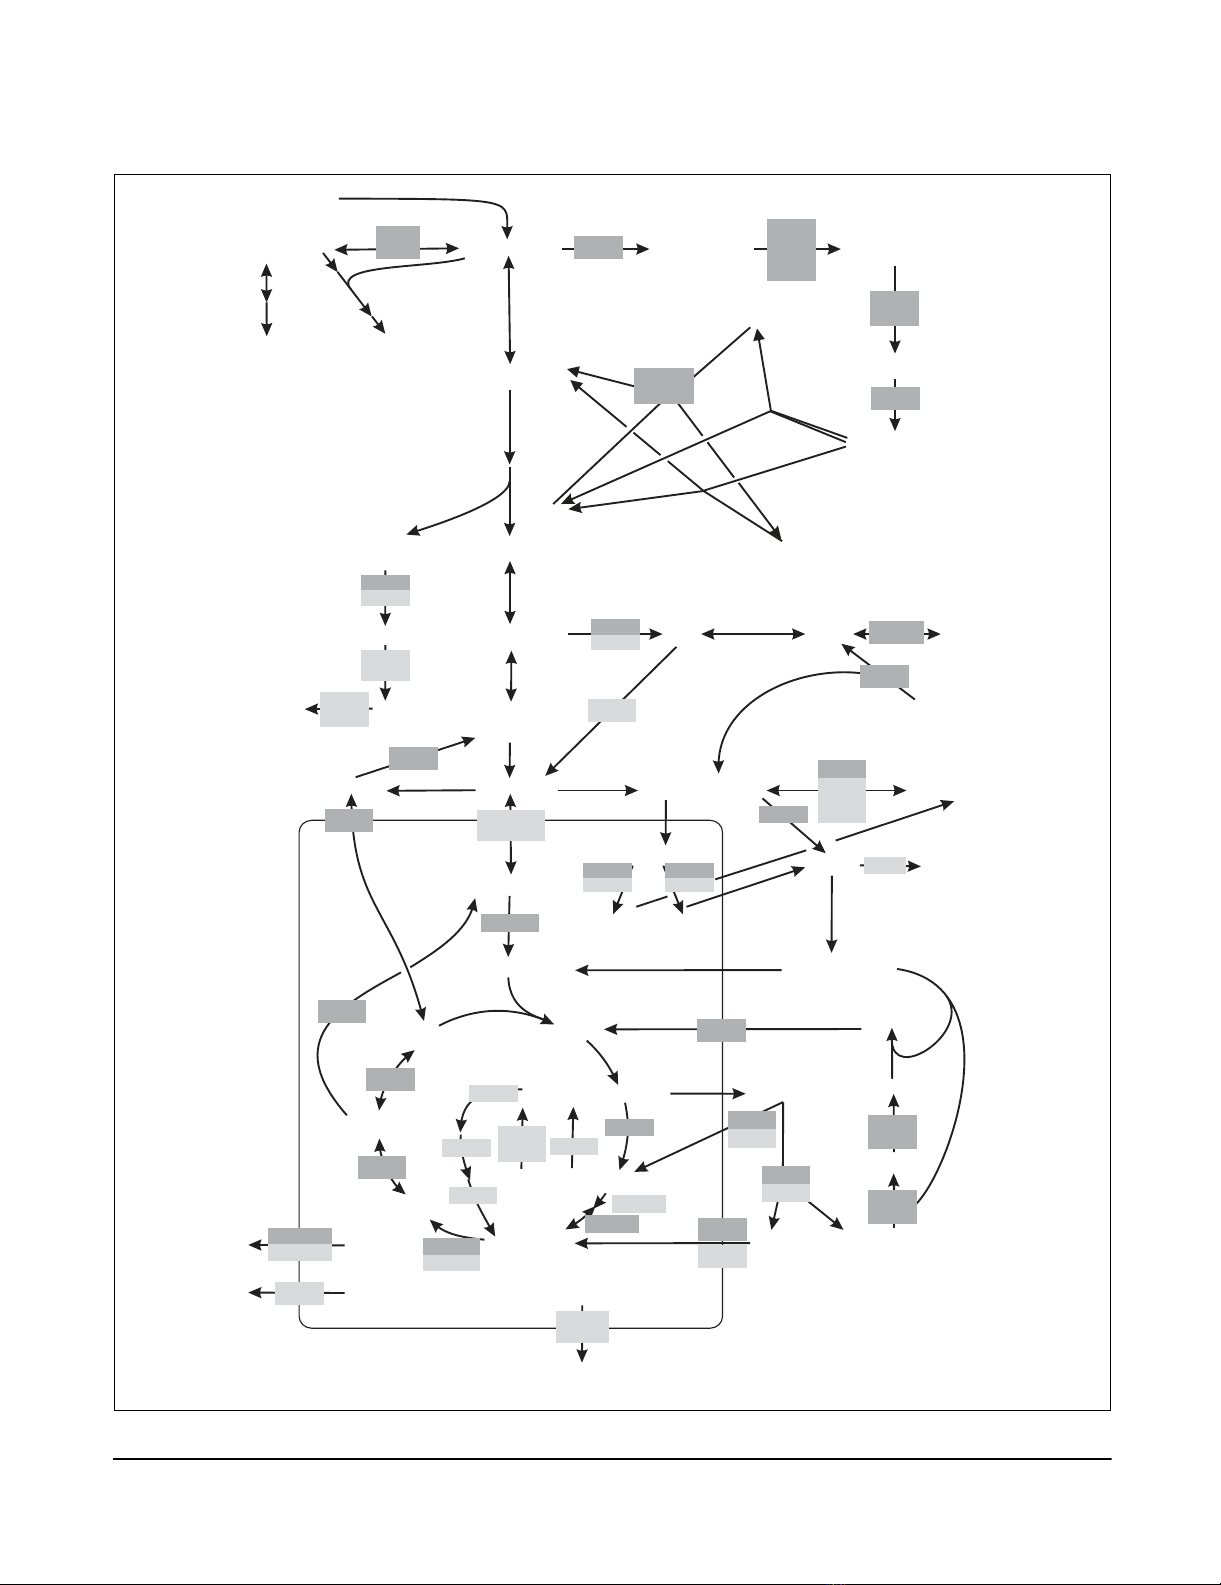
Central carbon metabolism of S. cerevisiae during aerobic growth on glucoseFigure 2 (see following page)
Central carbon metabolism of S. cerevisiae during aerobic growth on glucose. Gene names in boxes are given for reactions that were identified as flexible
by flux balance analysis. Dark gray boxes indicate mutants, for which the carbon flux distribution was determined by 13C-tracer experiments. Dots indicate
that the gene is part of a protein complex. Arrowheads indicate reaction reversibility. Extracellular substrates and products are capitalized. C1, one-
carbon unit from C1 metabolism.
R49.4 Genome Biology 2005, Volume 6, Issue 6, Article R49 Blank et al. http://genomebiology.com/2005/6/6/R49
Genome Biology 2005, 6:R49
Figure 2 (see legend on previous page)
GLUCOSE
glucose-6-P
fructose-6-P
triose-3-P
acetaldehyde
acetate
succinate
α-ketoglutarate
isocitrate isocitrate
fumarate
pyruvate ETHANOL
acetyl-CoA
malate
oxaloacetate
MITOCHONDRION
P-enol-
pyruvate
pyruvate
ACETATE
acetyl-CoA
oxaloacetate
3-P-glycerate
erythrose-4-P
sedoheptulose-7-P
ribulose-5-P
glyoxylate
malate
oxaloacetate
citrate
citrate
MAE1
6-P-glucono
-1,5-lactone 6-P-gluconate
acetate
acetaldehyde
ethanol
MDH1
FUM 1
MDH2
MDH3
GLY1
ZWF1
glucose-1-P
PGM 1
PGM 2
Thr
glycogen trehalose
CTP1
SFC1
OAC1
PDA1\...
ALD5
...
LSC1\...
IDP2
IDP3
IDP1
ALD6
ADH1
ADH2
ADH5
SFA1
TAL1
YGR043c
GND1
GND2
SDH1\...
SDH1b
SOL1
SOL2
SOL3
SOL4
ALD5
ALD4
ADH3
ADH4
GlySer C1
GCV2\...
SER33
SER3
GLYCEROL
GPD1
GPD2
glycerol-3-P
HOR2
RHR2
DIC1
YEL006W
YIL006W
COX5A\...
COX5B\...
H
+
ODC1
ODC2
Glu Glu
AGC1
α-ketoglutarate
2-oxoadipate
α-ketoglutarate
2-oxoadipate
xylulose-5-P
RPE1
CHA1
Glu
GDH1
GDH3
GAD1
UGA1
UGA2
GLT1
succinate
DAL7
MLS1
PCK1
ZWF1ZWF1ZWF1ZWF1ZWF1
KGD1\2
ICL1
ICL2
BPH1
glycerol
GUP1
GUP2
http://genomebiology.com/2005/6/6/R49 Genome Biology 2005, Volume 6, Issue 6, Article R49 Blank et al. R49.5
comment reviews reports refereed researchdeposited research interactions information
Genome Biology 2005, 6:R49
In general, growth on the single substrate reduced the meta-
bolic flexibility, as a much greater proportion of mutants
exhibited significant fitness defects (Table 2). Major fitness
defects were prominent in mutants of the PP pathway (gnd1,
rpe1, sol3, and zwf1), which indicates an increased demand of
NADPH for biosynthesis. Fitness of the fum1 mutant was
clearly lower than that of other TCA-cycle mutants, for which
duplicate genes exist. The strong phenotype of the fum1
mutant was somewhat unexpected because the flux through
the TCA cycle is generally low or absent in glucose batch cul-
tures of S. cerevisiae [13,14,26,27].
Intracellular carbon flux redistribution in response to
gene deletions
While physiological data quantify the fitness defect, they can-
not differentiate between intracellular mechanisms that bring
about robustness to the deletion. To identify how carbon flux
was redistributed around a metabolic lesion, we used meta-
bolic flux analysis based on 13C-glucose experiments [8,9]. In
contrast to in vitro enzyme activities and expression data,
13C-flux analysis provides direct evidence for such in vivo flux
rerouting or its absence. The flux protocol consists of two dis-
tinct steps: first, analytical identification of seven independ-
ent metabolic flux ratios with probabilistic equations from the
13C distribution in proteinogenic amino acids [12,28,29]; and
second, estimation of absolute fluxes (in vivo reaction rates)
from physiological data and the flux ratios as constraints
[10,30]. The relative distribution of intracellular fluxes was
rather invariant in the 37 mutants, with the fraction of mito-
chondrial oxaloacetate derived through the TCA cycle flux
and the fraction of mitochondrial pyruvate originating from
malate as prominent exceptions (Figure 3).
Table 2
Overview of mutants with a fitness defect of at least 20% or altered flux distribution
Mutants Fitness defect in YPD Fitness defect in MM Altered intracellular flux distribution*
Total number of mutants 3 of 38 12 (+1)† of 38 11 of 38
Singleton genes fum1 gly1 fum1 pda1 fum1 pda1
gly1 rpe1 lsc1 rpe1
oac1 zwf1 mae1 zwf1
oac1
Duplicate genes adh1 adh1 sdh1 adh1 cox5A
ald6 sol3 ald6 mdh1
cox5A (gnd1)
mdh1
*See Figures 5 and 6. †Lethal mutations are given in parentheses.
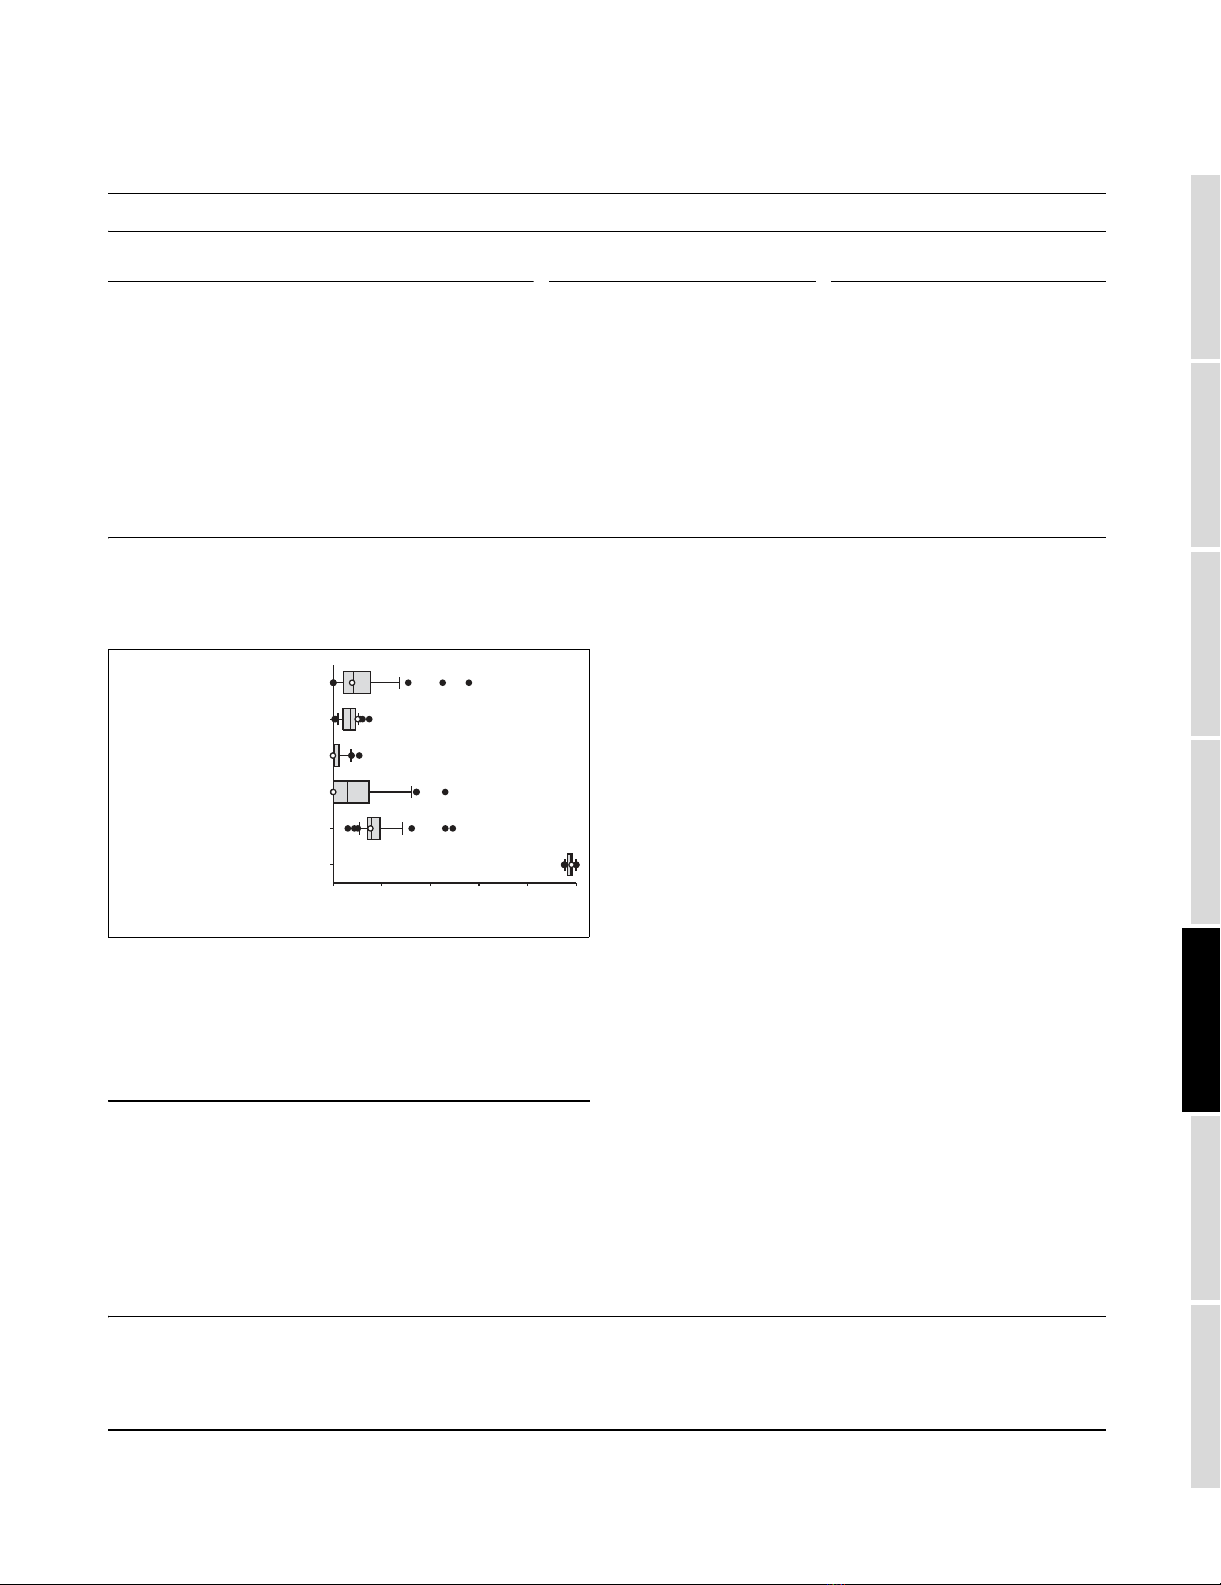
The distribution of six independently determined metabolic flux ratios in 37 deletion mutants during growth on glucoseFigure 3
The distribution of six independently determined metabolic flux ratios in
37 deletion mutants during growth on glucose. In each case, the median of
the distribution is indicated by a vertical line, the 25th percentile by the
grey box and the 90th percentile by the horizontal line. Data points
outside the 90th percentile are indicated by dots. The reference strain is
indicated by the open circle.
Relative activity (%)
(1) Oxaloacetate
mit
through TCA cycle
(3) PEP from oxaloacetate
cyt
(2) Serine through PP pathway
(4) Pyruvate
mit
from malate
(5) Serine from glycine
(6) Glycine from serine
zwf1rpe1
zwf1
pda1 fum1
fum1
0 20 40 60 80 100
Absolute metabolic fluxes in the 37 flexible mutants as a function of glucose uptake rate or selected intracellular fluxesFigure 4 (see following page)
Absolute metabolic fluxes in the 37 flexible mutants as a function of glucose uptake rate or selected intracellular fluxes. (a-f) Glucose uptake rate; (g,h)
selected intracellular fluxes. The linear regression of the distribution and the 99% prediction interval are indicated by the solid and dashed lines,
respectively. Mutants with significant changes in the carbon-flux distribution are indicated. The reference strain is indicated by an open circle. Extreme flux
patterns were verified in 30-ml shake flask cultures (data not shown).