EURASIP Journal on Applied Signal Processing 2005:14, 2241–2249 c(cid:1) 2005 Hindawi Publishing Corporation
A Novel Prostate Cancer Classification Technique Using Intermediate Memory Tabu Search
Muhammad Atif Tahir School of Computer Science, Queen’s University of Belfast, Belfast BT7 1NN, Northern Ireland, UK Email: a.tahir@qub.ac.uk
Ahmed Bouridane School of Computer Science, Queen’s University of Belfast, Belfast BT7 1NN, Northern Ireland, UK Email: a.bouridane@qub.ac.uk
Fatih Kurugollu School of Computer Science, Queen’s University of Belfast, Belfast BT7 1NN, Northern Ireland, UK Email: f.kurugollu@qub.ac.uk
Abbes Amira School of Computer Science, Queen’s University of Belfast, Belfast BT7 1NN, Northern Ireland, UK Email: a.amira@qub.ac.uk
Received 31 December 2003; Revised 2 November 2004
The introduction of multispectral imaging in pathology problems such as the identification of prostatic cancer is recent. Unlike conventional RGB color space, it allows the acquisition of a large number of spectral bands within the visible spectrum. This results in a feature vector of size greater than 100. For such a high dimensionality, pattern recognition techniques suffer from the well- known curse of dimensionality problem. The two well-known techniques to solve this problem are feature extraction and feature selection. In this paper, a novel feature selection technique using tabu search with an intermediate-term memory is proposed. The cost of a feature subset is measured by leave-one-out correct-classification rate of a nearest-neighbor (1-NN) classifier. The experiments have been carried out on the prostate cancer textured multispectral images and the results have been compared with a reported classical feature extraction technique. The results have indicated a significant boost in the performance both in terms of minimizing features and maximizing classification accuracy.
Keywords and phrases: feature selection, dimensionality reduction, tabu search, 1-NN classifier, prostate cancer classification.
1.
INTRODUCTION
based classification. The following four classes have been dis- criminated.
(i) Stroma: STR (muscular normal tissue). (ii) Benign prostatic hyperplasia: BPH (a benign condi-
tion).
(iii) Prostatic intraepithelial neoplasia: PIN (a precursor
state for cancer).
(iv) Prostatic carcinoma: PCa (abnormal tissue develop-
ment corresponding to cancer).
Prostate cancer has become the second most commonly di- agnosed cancer in the male population after lung cancer, with approximately 22 800 new cases diagnosed every year in the UK alone. Currently, prostate needle biopsy remains the only conclusive way to make an accurate diagnosis of prostate cancer [1]. Recently Roula et al. have described a novel approach in which additional spectral data is used for the classification of prostate needle biopsies [2, 3]. The aim of this novel approach is to help pathologists reduce the di- agnosis error rate. Instead of analyzing conventional grey scale or RGB color images, spectral bands have been used in the analysis. Results have shown that the multispectral image classification outperforms both RGB and grey-level-
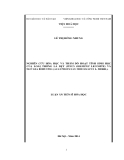
Figure 1 shows samples of the four classes. In their research [2, 3], the total number of features used is greater than 100. For such a high-dimensionality prob- lem, pattern recognition techniques suffer from the well- known curse-of-dimensionality problem [4] as the number
2242
EURASIP Journal on Applied Signal Processing
(a) (b) (c) (d)
Figure 1: Images showing representative samples of the four classes: (a) stroma, (b) BPH, (c) PIN, and (d) cancer.
search (SBFS) are efficient and usually find fairly good solu- tions for small- and medium-scale problems [9]. But they suffer from the problem of trapping into local optimal solu- tions for large-scale problems when n > 100 [6, 10]. Modern iterative heuristics such as tabu search and genetic algorithms have been found effective in tackling this category of prob- lems which have an exponential and noisy search space with numerous local optima [10, 11, 16].
of training samples that are used to design the classifier is small relative to the number of features. One way to over- come the curse-of-dimensionality problem is to reduce the dimensionality of the feature space. Principal component analysis (a well-known feature extraction method) has been used by Roula et al. on the large resulting feature vectors to reduce its dimensionality to a manageable size. The classifica- tion tests have been carried out using supervised classical dis- crimination method [5]. Although Roula et al. have achieved a classification accuracy of over 94% in their experiments, this is still unacceptable in medical applications. This work attempts to further improve this classification accuracy.
Recently Zhang et al. have used tabu search with short- term memory to solve the optimal feature selection problem. The experimental results on synthetic data have shown that the tabu search not only has a high possibility to obtain the optimal or near-optimal solution, but also requires less com- putational time than the other suboptimal and genetic algo- rithm methods [10].
The other way to reduce the dimensionality of the feature space is by using feature selection methods. The term feature selection refers to algorithms that select the best subset of the input feature set. These algorithms used in the design of pat- tern classifiers have three goals: (1) to reduce the cost of ex- tracting features, (2) to improve the classification accuracy, and (3) to improve the reliability of the estimation of perfor- mance [4, 6]. Feature selection leads to savings in the measur- ing features (since some of the features are discarded) and the selected features retain their original physical interpretation [4]. This feature selection problem can be viewed as a multi- objective optimization problem since it involves minimizing feature subset and maximizing classification accuracy.
Mathematically, the feature selection problem can be for- mulated as follows. Suppose X is an original feature vector with the cardinality of n and X is the new feature vector with the cardinality of n, X ⊆ X, J(X) is the selection criterion function for the new feature vector X. The goal is to optimize J().
The aim of this paper is to improve the classification error rate of prostate needle biopsies for the four groups mentioned above while removing as many features as pos- sible from the original feature vector. Tabu search method is used to find a feature subset. A novel approach based on intermediate-term memory has been developed to improve the search through tabu search. Due to multiobjective na- ture of the problem and the various cost parameters, that is, minimizing the number of features, maximizing the classifi- cation accuracy, and so forth, it is not clear what constitutes the best solution. Therefore, the objective function is mea- sured by using the fuzzy formula, since fuzzy logic provides a suitable mathematical framework to address such problem. Classification accuracy is measured by leave-one-out correct- classification rate of a nearest neighbor (1-NN). Neighbors are calculated using the Euclidean distance. The 1-NN classi- fier is simple and it always provides a reasonable classification performance in most applications. The most straightforward 1-NN rule can be conveniently used as a benchmark for all other classifiers. Further, as the 1-NN classifier does not re- quire any user-specified parameters, its classification results are implementation independent [4].
This feature selection problem is NP-hard problem. Therefore, the optimal solution cannot be guaranteed to be acquired except when performing an exhaustive search in the solution space [7]. However, exhaustive search is feasi- ble only for small n. Different algorithms have been pro- posed for feature selection to obtain near-optimal solutions [4, 6, 8, 9, 10, 11]. The choice of an algorithm for select- ing the features from an initial set depends on n. The fea- ture selection problem is of small scale, medium scale, or large scale if n belongs to [0, 19], [20, 49], or [50, ∞], respec- tively [6, 10]. Sequential algorithms such as sequential for- ward floating search (SFFS) and sequential backward floating
The rest of the paper is organized as follows. Section 2 gives an overview of tabu search and fuzzy logic followed by proposed tabu search design using intermediate-term mem- ory for feature selection problem. The experiments and the comparison with other reported classifiers are presented in Section 4. Section 5 concludes the paper.
Prostate Cancer Classification Using Intensified Tabu Search
2243
1
Begin Start with an initial feasible solution S ∈ Ω. Initialize tabu list and aspiration level. For fixed number of iterations, do
0.8
Generate neighbor solutions V ∗ ⊂ N(S). Find best S∗ ∈ V ∗. If move S to S∗ is not in T, then
µ 0.6
Accept move and update best solution. Update tabu list and aspiration level. Increment iteration number.
0.4
Else
If Cost(S∗) < AL, then
0.2 1
Accept move and update best solution. Update tabu list and aspiration level. Increment iteration number.
0 xmin xmax x
End if
End if
End for
End
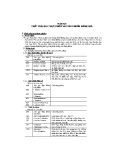
Figure 2: Membership function for fuzzy subset X, where X is the number of features F, the number of incorrect predictions P, or the classification error rate E in this application.
Algorithm 1: Algorithmic description of a short-term tabu search (TS) [16].
2. OVERVIEW OF TABU SEARCH AND FUZZY LOGIC
2.1. Tabu search
approaches usually deal with such difficulty by computing a single utility function as a weighted sum of the individual ob- jectives, where more important objectives are assigned higher weights. Balancing different objectives by weight functions is at best controversial. Fuzzy logic is a convenient vehicle for trading off different objectives. It allows to map values of dif- ferent criteria into linguistic values, which characterize the level of satisfaction of the designer with the numerical value of objectives, and to operate over the interval [0, 1] defined by the membership functions for each objective.
3. PROPOSED FEATURE SELECTION METHOD USING
TABU SEARCH WITH INTENSIFICATION
3.1. Fuzzy objective function
Tabu search (TS) was introduced by Glover [17, 18] as a gen- eral iterative metaheuristic for solving combinatorial opti- mization problems. Tabu search is conceptually simple and elegant. It is a form of local neighborhood search. Each so- lution S ∈ Ω has an associated set of neighbors N(S) ⊆ Ω, where Ω is the set of feasible solutions. A solution S(cid:6) ∈ N(S) can be reached from S by an operation called a move to S(cid:6). TS moves from a solution to its best admissible neighbor, even if this causes the objective function to deteriorate. To avoid cy- cling, solutions that have been recently explored are declared forbidden or tabu for a number of iterations. The tabu status of a solution is overridden when certain criteria (aspiration criteria) are satisfied. Sometimes, intensification and diversi- fication strategies are used to improve the search. In the first case, the search is accentuated in the promising regions of the feasible domain. In the second case, an attempt is made to consider solutions in a broad area of the search space. The tabu search algorithm is given in Algorithm 1, where
(i) Ω is the set of feasible solutions, (ii) S is the current solution, (iii) S∗ is the best admissible solution, (iv) Cost is the objective function, (v) N(S) is the neighborhood of solution S, (vi) V ∗ is the sample of neighborhood solutions, (vii) T is the tabu list, (viii) AL is the aspiration level.
2.2. Fuzzy logic
Fuzzy set theory has been recently applied in many areas of science and engineering [20]. In the most practical situa- tions, one is faced with several concurrent objectives. Classic
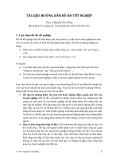
In this paper, we present a tabu search algorithm, where the quality of a solution is characterized by a fuzzy logic rule ex- pressed in linguistic variables of the problem domain. Three linguistic variables are defined to correspond to the three component objective functions: number of features f1, num- ber of incorrect predictions f2, and average classification er- ror rate f3. One linguistic value is defined for each compo- nent of the objective function. These linguistic values char- acterize the degree of satisfaction of the designer with the values of objectives fi(x), i = {1, 2, 3}. These degrees of satis- faction are described by the membership functions µi(x) on fuzzy sets of the linguistic values. The membership functions for the minimum number of features, the minimum num- ber of incorrect predictions, and the low classification error rate are easy to build. They are assumed to be nonincreasing functions because the smaller the number of features f1(x), the number of incorrect predictions f2(x), and the classifi- cation error rate f3(x), the higher the degree of satisfaction µ1(x), µ2(x), and µ3(x) of the expert system (see Figure 2). The fuzzy subset of a good solution is defined by the follow- ing fuzzy logic rule:
2244
EURASIP Journal on Applied Signal Processing
3.4. Tabu moves
“if a solution has small number of features and small number of incorrect predictions and low classification er- ror rate, then it is a good solution.”
A tabu list is maintained to avoid returning to previously visited solutions. With this approach, if a feature (move) is added or deleted at iteration i, then adding or deleting the same feature (move) for T iterations (tabu list size) is tabu.
According to the and-like/or-like ordered weighted averaging logic [21, 22], the above rule evaluates to the following:
3(cid:3)
(cid:2)
3.5. Aspiration criterion
µ(x) = γ × min
(cid:1) µi(x)
µi(x),
(1)
+ (1 − γ) × 1 3
i=1
Aspiration criterion is a mechanism used to override the tabu status of moves. It temporarily overrides the tabu status if the move is sufficiently good. In our approach, if a feature is added or deleted at iteration i and this move results in a best cost for all previous iterations, then this feature is allowed to add or delete even if it is in the tabu list.
3.6. Termination rule
where γ is a constant in the range [0, 1]. The shape of the membership function µ(x) is shown in Figure 2. Member- ship of data in a fuzzy set is defined using values in the range [0, 1]. The membership values for the number of features F, the number of incorrect predictions P, and the classification error rate E are computed by using (2), (3), and (4), respec- tively:
The most commonly used stopping criteria in TS are
1
if F ≤ F Min,
(2)
µ1(x) =
(i) after a fixed number of iterations, (ii) after some number of iterations without an improve-
ment in the objective function value,
F Max −F F Max −F Min 0
if F Min ≤ F ≤ F Max, if F Max ≤ F,
(iii) when the objective reaches a prespecified objective
value.
1
if P ≤ P Min,
In our algorithm, termination condition is a predefined
(3)
µ2(x) =
number of iterations.
P Max −P P Max −P Min 0
if P Min ≤ P ≤ P Max, if P Max ≤ P,
3.7.
Intensification of the search
1
if E ≤ E Min,
(4)
µ3(x) =
E Max −E E Max −E Min 0
if E Min ≤ E ≤ E Max, if E Max ≤ E.
For intensification, the search is accentuated in the promis- ing regions of the feasible domain. Intensification is based on some intermediate-term memory. Since, the solution space is extremely large (initial feature vector n > 100), it is im- portant to intensify the search in the promising regions by removing poor features from the search space. The following steps are proposed to intensify the search.
Step 1. Store M best solutions in intermediate memory for T1 number of iterations.
Step 2. Remove features that are not included in the best M solutions for N times.
The maximum number of features (F Max) is the size of the feature vector and the minimum number of features (F Min) is 1. The maximum number of incorrect predictions (P Max) and the maximum classification error rate (E Max) are determined by applying 1-NN classifier in the initial solu- tion. The minimum number of incorrect predictions (P Min) is 0 while the minimum classification error rate (E Min) is 0%.
Initial solution
Step 3. Rerun the tabu search with the reduced set of features for another T2 iterations.
Step 4. Repeat Steps 1, 2, and 3 until the optimal or near- optimal solution is achieved.
3.2. Feature selection vector is represented by a 0/1-bit string where 0 shows the feature is not included in the solution while 1 shows the feature is included. All features are in- cluded in the initial solution.
3.3. Neighborhood solutions Neighbors are generated by randomly adding or deleting a feature from the feature vector of size n. For example, if 11 001 is the current feature vector, then the possible neigh- bors with a candidate list size of 3 can be 10 001, 11 101, and 01 001. Among the neighbors, the one with the best cost (i.e., the solution which results in the minimum value of (1)) is se- lected and considered as a new current solution for the next iteration.
The values of M and N can be determined empirically through experiments. As an example, assume that the fol- lowing four best solutions as shown in Figure 3 are found by tabu search during T1 iterations. Features f1 and f3 are always used while feature f5 is never used for good solutions. For N = 2, the reduced feature set consists of only f1, f2, f3, and f6. Thus, tabu search will search for the near-optimal solu- tions in reduced search space to avoid visiting nonpromising regions.
Prostate Cancer Classification Using Intensified Tabu Search
2245
Table 1: Classification error reported in [2].
f1 f2 f3 f4 f5 f6 f7
Classified as
BPH
PCa
PIN
STR
0 1 1 0 1 0 0
0 1 1 0 1 1 0
BPH PCa PIN STR Overall
3 174 4 1 —
2 1 133 1 —
1 1 6 152 —
100 1 1 11 —
Error 5.66% 1.69% 7.63% 7.87% 5.57%
1 0 1 1 1 0 0
0 1 1 1 1 0 0
Table 2: Classification error by using feature selection through tabu search.
(cid:8)
Classified as
BPH
PCa
PIN
STR
4 2 4 3 1 1 0
Figure 3: An example showing intensification steps for tabu search. (cid:8) is the number of occurrences of each feature in the best solutions.
BPH PCa PIN STR Overall
1 174 2 2 —
0 2 141 0 —
4 0 2 161 —
101 1 0 2 —
Error 4.71% 1.69% 2.77% 2.42% 2.90%
4. EXPERIMENTS AND DISCUSSION
12
10
8 6
4
r o r r e n o i t a c fi i s s a l C
2
The tabu search in combination with 1-NN classifier is tested on two data sets reported in [2, 3]. In order to offset any bias due to the different range of values for the original features, the input feature values are normalized over the range [1, 11] by using (5) [23]. Normalizing the data is important to en- sure that the distance measure allocates equal weight to each variable. Without normalization, the variable with the largest scale will dominate the measure:
(cid:9)
(cid:10)
∗ 10
0 10 11 12 13 14 15 16 17 18 19 20 Number of features
+ 1,
(5)
x(cid:6) i, j =
xi, j − mink=1,...,n x(k, j) maxk=1,...,n x(k, j) − mink=1,...,n x(k, j)
Tabu & 1-NN classifier PCA & LDA classifier
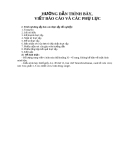
Figure 4: Features versus classification error for data set 1.
where xi, j is the jth feature of the ith pattern, x(cid:6) i, j is the cor- responding normalized feature, and n is the total number of patterns.
linear discrimination method. Table 2 shows the minimum classification error obtained by using fuzzy tabu search and classification results using leave-one-out 1-NN classifier. The classification accuracy has been increased for all cases. The overall classification error has been reduced to 2.90% as com- pared to 5.57% reported in [2]. Furthermore, the number of features used is only 16 out of the available 128 as compared to 20 obtained using principal component analysis in [2].
The first data set consists of textured multispectral im- ages taken at 16 spectral channels (from 500 nm to 650 nm) [2, 24]. 592 different samples (multispectral images) of size 128 ∗ 128 have been used to carry out the analysis. The samples are routinely viewed at prostatic section seen at low power (x 40 objective magnification) by two highly ex- perimented independent pathologists and labelled into four classes: 165 cases of stroma, 106 cases of BPH, 144 cases of PIN, and 177 cases of PCa. The size of the feature vector is 128 (16 bands ∗ 8 features(2 structural + 6 Haralick)).
Figure 4 shows features vector size versus classification error rate. Our proposed algorithm is capable to obtain su- perior classification accuracy for various feature sizes when compared with technique used in [2]. Even the classification accuracy for the feature vector size of 10 is better than re- ported.
The second data set is derived from prostatic nuclei ex- tracted from prostate tissue [3]. Nuclei are imaged under high power (x 100 objective magnification). These prostatic nuclei are taken at 33 spectral channels (from 400 nm to 720 nm). 230 different images of size 256 ∗ 256 have been used to carry out the analysis. The samples are labelled into 3 classes: 63 cases of BPH, 79 cases of PIN, and 88 cases of PCa. The size of feature vector is 266 (33 bands ∗ 8 features(3 statistical+5 Haralick)+2 morphology features). Table 1 shows the classification error for the first data set which is reported in [2] with data reduction by using prin- cipal component analysis and classification using classical
Table 3 shows the classification error for the second data set which is reported in [3] with data reduction by using principal component analysis and classification using classi- cal quadratic discrimination method. Table 4 shows the min- imum classification error obtained by using fuzzy tabu search and classification results using leave-one-out 1-NN classifier. The classification accuracy has been increased for all cases.
2246
EURASIP Journal on Applied Signal Processing
Table 3: Classification error reported in [3].
Table 5: Classification error (%) for different runs using tabu search.
Classified as
BPH
PCa
PIN
Data sets
Data set 1 Data set 2
1 2.90 0.91
2 2.91 0.91
3 2.90 1.13
4 2.90 0.91
5 2.93 0.91
Average 2.91 0.95
60 3 1 —
2 82 2 —
1 3 76 —
Error 4.76% 6.82% 3.79% 5.10%
BPH PCa PIN Overall
Table 4: Classification error by using feature selection through tabu search.
Classified as
BPH
PCa
PIN
62 1 0 —
1 87 0 —
0 0 79 —
Error 1.58% 1.14% 0% 0.91%
BPH PCa PIN Overall
rapidly converged to the feasible/infeasible region border in all these objectives. Figure 7 depicts different objective func- tions versus the number of iterations after reducing the size of feature set by using intensification technique as mentioned in Section 2. From these curves, it can be seen that the search- ing for the best solutions is now limited to only good solution space, that is, fuzzy membership is in the range between 0.15 and 0.25 for most of the time while the same fuzzy member- ship was in the range between 0.2 and 0.4 before intensifica- tion.
24
4.2. Runtime parameters for tabu search
20
16
r o r r e n o i t a c fi i s s a l C
12 8
4
0 10 11 12 13 14 15 16 17 18 19 20 Number of features
Table 6 shows the tabu runtime parameters chosen after ex- perimentation with different values. The values of M and N as mentioned in Section 3.1 are 50 and 10, respectively. Table 7 shows the results of the test for different values of M and N. A large value of M and a small value of N cause tabu search to converge slowly and search for the near-optimal so- lutions in almost the same search space as without intensifi- cation. On the contrary, a small value of M and a large value of N make the search less intensive. In practice, medium val- ues of M and N are more appropriate for intensification.
Tabu & 1-NN classifier PCA & QDA classifier
4.3. A discussion on computation time
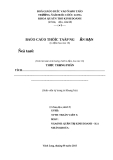
Figure 5: Features versus classification error for data set 2.
The overall classification error has been reduced to 0.91% as compared to 5.1% reported in [3]. The number of features used is only 13 out of the available 266 as compared to 25 obtained using principal component analysis in [3].
The execution time to reduce the dimensionality of feature vector using tabu search and 1-NN classifier is much higher than reducing the dimensionality using PCA and LDA (10– 12 hours as compared to few seconds). This can be explained by the fact that the former belongs to the class of iterative heuristics where for each iteration, different solutions are ex- plored while the latter is based on only single solution.
Figure 5 shows features vector size versus classification error rate. Our proposed algorithm is capable to obtain su- perior classification accuracy for various feature sizes when compared with technique used in [3]. Even the classification accuracy for feature vector size of 10 is better than reported.
4.1. Quality of solutions by tabu search
However, the feature selection using TS/1-NN is an of- fline procedure which is used to find the best subset of fea- tures while keeping the classification error rate low. Once the feature selection procedure finds the best subset of features, 1-NN classifier is used to determine the class of the new sam- ple (a multispectral image) which provides an online diag- nosis decision for the pathologist. Thus, the main advantage is that the feature selection leads to savings in measuring features as most of the features are discarded. The selected features have retained their original physical meanings while for feature extraction the transformed features have no clear physical meaning [4].
Since the features are randomly added or deleted during tabu search, it is imperative that tabu search algorithm has the ability to find optimal or near-optimal solutions during dif- ferent runs. Table 5 shows different solutions obtained by tabu search for different runs. If tabu search is executed with the same input and settings, it is highly likely that an accept- ably accurate solution will be reached as shown in Table 5.
Table 8 shows the computation time comparison when determining the class of new sample. The execution time us- ing feature extraction is much higher for both data sets when compared with feature selection. As clear from the table, by using feature selection, the cost of classification is reduced by limiting the number of features which must be measured for feature extraction.
Figure 6 shows the fuzzy membership function, the num- ber of incorrect predictions, the number of features, and clas- sification error versus the number of iterations during the solution search space using tabu search. The figure clearly shows how well focused is tabu search on the good solution space. From the curve, it can be clearly seen that tabu search
Prostate Cancer Classification Using Intensified Tabu Search
2247
s n o i t c i d e r p t c e r r o c n
i
1.2
n o i t c n u f p i h s r e b m e m y z z u 0F
1 0.8 0.6 0.4 0.2
f o r e b m u N
80 70 60 50 40 30 20 10 0 1 82 163 244 325 406 487 568 649 730 811 892 973 1 80 159 238 317 396 475 554 633 712 791 870 949 Iterations Iterations
(a) (b)
s e r u t a e f
14 12 140 120
r o r r e n o i t a c fi i s s a l C
f o r e b m u N
100 80 60 10 8 6 4 40 20 2 0 0 1 80 159 238 317 396 475 554 633 712 791 870 949 1 82 163 244 325 406 487 568 649 730 811 892 973 Iterations Iterations (d) (c)
Figure 6: Objective functions versus number of iterations for data set 1 before intensification.
s n o i t c i d e r p t c e r r o c n
i
f o r e b m u N
0.35 n o i 0.3 t c n u 0.25 f p i 0.2 h s r e 0.15 b m 0.1 e m 0.05 y z z u 0F 35 30 25 20 15 10 5 0 1 65 129 193 257 321 385 449 1 63 125 187 311 373 435 497 Iterations 249 Iterations
(a) (b)
s e r u t a e f
r o r r e n o i t a c fi i s s a l C
f o r e b m u N
6 5 4 3 2 1 0 40 35 30 25 20 15 10 5 0 301 1 61 121 181 361 421 481 1 63 125 187 311 373 435 497 241 Iterations 249 Iterations (d) (c)