194
JOURNAL OF SCIENCE AND TECHNOLOGY DONG NAI TECHNOLOGY UNIVERSITY
Special Issue
OPTIMIZING BOTANICAL FARM CROP VARIETY SELECTION: INTEGRATION OF MACHINE LEARNING MECHANISMS FOR GREEN TECHNOLOGY AND SUSTAINABLE SOLUTIONS
Ngo Ho Anh Khoi1*, Vo Khuong Duy3, Nguyen Anh Duy3, Ngo Ho Anh-Khoa2
1Nam Can Tho University 2Adhightech Ltd 3Quantmetry *Corresponding author: NGO-HO Anh-Khoi*, nhakhoi@nctu.edu.vn
GENERAL INFORMATION
ABSTRACT
Received date: 01/04/2024
Revised date: 21/05/2024
Accepted date: 11/07/2024
learning, a
KEYWORD
AI;
green technology;
Machine Learning;
plant species;
sustainable solutions.
Currently, the field of science and technology, particularly Artificial Intelligence (AI), is undergoing significant progress. AI involves the computer-based simulation of human cognitive functions. Within the realm of AI, specialized branch, utilizes machine to enhance computational mathematical algorithms capabilities. The incorporation of AI in agriculture offers opportunities to optimize the selection of viable plant species, leading to improved agricultural productivity, higher incomes for farmers, and overall economic development. By applying machine learning techniques to the "Agricultural Crop Dataset" the study has developed an effective system for predicting the most suitable plant species for farmers. This endeavor promotes the practical utilization of AI in agriculture, paving the way for sustainable economic growth.
1. INTRODUCTION
integrating AI into agriculture is being carried out by analyzing land, climate, and water data to make optimal crop choices for each region. However, the application of AI in agriculture still faces many challenges due to various complex and diverse factors (L.Son, 2023). This research focuses on applying and comparing the performance of six algorithms adapting for evolving learning, including AdaBoost, Bagging, BernoulliNB, DecisionTree, ExtraTree, and GaussianNB,
The application of artificial intelligence in recommending suitable crops is a hot topic globally, aiming to significantly improve agricultural productivity and product quality. This issue is important as it relates to improving agricultural productivity and product quality, minimizing the impact of weather factors and diseases, and enhancing farmers' income (V.Toan, 2023). In Vietnam,
195
Special Issue
JOURNAL OF SCIENCE AND TECHNOLOGY DONG NAI TECHNOLOGY UNIVERSITY
Idea
Dataset from Agricultural Innovations and College of Agriculture and Forestry (A.I.A., 2020), Crop Yield Prediction Dataset by Rishi Patel (R.Patel, 2023), and Crop Production Statistics – India by Nikhil Mahajan (N.Mahajan, 2023).
collaborated
collected aggregated
experiment and
implementation
with the applied sliding windows approach, and Klinkenberg’s method, called Evolving with Klinkenberg’s (EKI): EKI- AdaBoost, EKI-Bagging, EKI-BernoulliNB, EKI-DecisionTree, EKI-ExtraTree, and EKI- GaussianNB, ultimately selecting the best algorithm to solve the problem (Ngo et al, 2024). The study includes learning about the history and theoretical basis of crop recommendation methods and analyzing relevant data. The next step will be to implement various algorithms with various models regarding to compare, parameter evaluate, and select the most suitable model. The project also aims to deploy a trial website where users can directly experience and plan farming based on system recommendations.
collected 345,000
The "Agricultural Crop Dataset" is a by Agricultural dataset Innovations and College of Agriculture and Forestry, consisting of 8 fields and 1697 by and rows, Agricultural Innovations and College of Agriculture and Forestry. This dataset is licensed under the CC0 1.0 Universal (CC0 1.0) Public Domain Dedication and was posted on February 15, 2023. The "Crop Yield Prediction Dataset" by Rishi Patel consists of 7 fields and about 4349 rows, collected and aggregated by Rishi Patel. This dataset is also licensed under the World Bank Dataset Terms of Use and was posted a year ago. The "Crop Production Statistics - India" by Nikhil Mahajan consists of 8 fields and and rows, about aggregated by Nikhil Mahajan. This dataset is licensed under the CC0 1.0 Universal (CC0 1.0) Public Domain Dedication and was posted about some month ago.
two lack sufficient data With a completely new topic and the application of a new algorithm, this research promises to solve the problem of agricultural harvest losses. Using an exploited dataset, this research seeks an optimal method to develop a classification system, providing decision-support tools to ensure success and profits for Vietnamese and global farmers. The ultimate goal is to create an advanced AI system that conveniently predicts crop needs, increase thereby helping their farmers income and contributing to sustainable agricultural development.
2. METHODOLOGY
Although there are three datasets with the most complete and usable parameters, only one dataset is suitable for use because the other for classification or have outdated data from 2-3 years ago. Therefore, this topic has chosen the by "Agricultural Crop Dataset" Agricultural Innovations and College of Agriculture and Forestry, updated most recently on February 15, 2023, for its system.
During the data search for the topic, many datasets were found (about 175 related to agricultural crops). However, three datasets the most complete and usable with include: Agricultural Crop parameters
196
JOURNAL OF SCIENCE AND TECHNOLOGY DONG NAI TECHNOLOGY UNIVERSITY
Special Issue
Table 1. Features and descriptions of the dataset
Description
Feature
N (Nitrogen)
One of the basic and essential nutrients for the metabolic and growth processes of plants. Nitrogen plays a crucial role in building proteins, an important part of cell structure, and generating energy for crops.
P (Phosphorus)
Phosphorus is an important component of DNA, the "memory unit" of all organisms. It is also a component of RNA, a compound that reads DNA genetic codes to build proteins and other compounds necessary for plant structure, seed productivity, and gene transfer. The structure of both DNA and RNA is linked together by phosphorus bonds.
K (Potassium)
Potassium enhances the plant's resistance to adverse external factors, promotes branching and the growth of multiple leaves. Potassium makes plants stronger and more resistant to lodging, improves their ability to withstand waterlogging, drought, and cold.
pH
Indicates the pH concentration in the soil. Soil pH, also known as soil reaction, is evaluated by the concentration of H+ and OH- ions in the soil. The pH index evaluates the acidity or alkalinity of soil. pH = 7 is neutral soil, pH < 7 is acidic soil, and pH > 7 is alkaline soil.
Rainfall
Information on the amount of rain recorded at the cultivation location. This is an important factor affecting the growing environment of crops. Rainfall directly affects the water supply for plants, impacting nutrient absorption and transport in the soil, and deciding on the need for supplementary irrigation. Soil moisture also depends on rainfall, affecting the water absorption and growth process of crops.
Temperature
Information on the temperature level of the environment at the planting location. Environmental temperature greatly affects the growth and development of crops. Each plant type has an optimal temperature range for best growth; exceeding or falling below this range can lead to plant stress and impact yield.
Humidity
Information on the amount of water vapor in the air at the planting location. Air humidity also plays an important role in plant gas and water exchange processes. Low humidity can lead to water deficiency for plants, while high humidity can create favorable conditions for the development of fungi and diseases.
Currently, datasets face issues when centralized data does not change over time because the data is trained based on classical algorithms (executed once and must be relearned from scratch when new data arrives, e.g., data 1 is trained into a model, and when data 2 arrives, data 1 must be relearned from scratch along with data 2 to create a new model). In contrast, in modern practice, the data environment changes over time, and training must be continuous in real-time, updating prediction models. Therefore, data learning must be conducted in a continuously changing data environment, meaning the experimental method will be continuous learning in non-stable environments (Ho, 2015). Some methods have been applied to classical algorithms to transform them into continuous learning methods using the sliding window approach, converting classical machine learning methods into advanced involves methods. principle This
197
Special Issue
JOURNAL OF SCIENCE AND TECHNOLOGY DONG NAI TECHNOLOGY UNIVERSITY
learning data within
results from
EKI-BernoulliNB,
sizes, and the best-performing size is selected (e.g., size No1 represents the most recent batch, size No2 includes the last two batches, size No3 the last three batches, and so forth). In this article, we will examine the evolving approaches based on Klinkenberg's concept (Klinkenberg, 2004) within various classical algorithms. The basic idea is simple: we can manage information loss by adjusting the "density" of the optimally selected window size. By applying Klinkenberg's methods, and using a single parameter n to define the batch sizes, we can control the loss of critical information that the generalization often techniques used in different evolving methodologies. So we will implement the new algorithms, called Evolving with Klinkenberg’s Idea (EKI): EKI-AdaBoost, EKI-Bagging, EKI- DecisionTree, EKI-ExtraTree, and EKI- GaussianNB.
continuously updating the model at each time step 't' using the latest available training data, which is determined by a sliding window of a predefined size (based on either time or the number of data points). This method can include batch retraining with the data inside the sliding window or updating the model if an online learning approach is feasible. The window size is predetermined by the user, with each window overlapping the previous one by sharing a subset of data. At each iteration, a new model is trained, representing an updated set of classes (Anh-Khoi et al, 2024). A key aspect of these methods is selecting the most appropriate window size. While many techniques use a fixed window size tailored to each specific problem, some methods focus on automatically determining the optimal window size. In (Klinkenberg, 2004), the author proposes incrementally the window sizes. At each increasing increment, the performance, measured by the error rate, is evaluated for various window
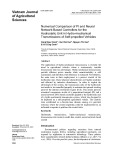
Figure 1. Performance progress chart of EKI’s algorithms (balanced-accuracy)
198
JOURNAL OF SCIENCE AND TECHNOLOGY DONG NAI TECHNOLOGY UNIVERSITY
Special Issue
descriptions: N (Nitrogen),
For the reasons mentioned in the previous section, the Agricultural Crop Dataset is the authors Agricultural provided by Innovations and the College of Agriculture and Forestry, members of the Kaggle website. The dataset includes the following features and P (Phosphorus), K (Potassium), pH, rainfall, temperature, humidity (view Table 1.).
rates,
the true negative cell of
The dataset used in this experiment consists of two parts: training data and testing data. The training data includes 1188 entries, while the testing data has 509 entries. The positions of the data in this dataset are not fixed in each experiment but are randomly shuffled after training a model.
in
the area under receiver operating the characteristic (ROC) curve (AUC) and Balanced Accuracy (BA) are often preferred. Metrics such as precision, recall, and specificity are less suitable for imbalanced class data. If the goal is to find consensus, metrics based on true positive/false positive rates, like precision, recall, and F-Score, are used. On the other hand, if the goal is to detect non-consensus, metrics based on true negative/false negative such as specificity, are relevant, though these cases are rarer in real-life scenarios. Recall, Precision, and F-Score are criticized for the ignoring confusion matrix and being susceptible to prediction bias (Powers, 2011). In contrast, true Balanced Accuracy considers both positive and true negative rates, offering a more balanced evaluation for detecting both consensus (true positive) and non-consensus (true negative). Thus, for addressing both consensus and imbalanced data conditions, Balanced Accuracy is the most suitable metric (Ho et al., 2015). Balanced Accuracy (BA) is a crucial and straightforward metric for evaluating binary classifiers the presence of class imbalance, where one class is much more common than the other. The formula for balanced accuracy, which provides a realistic and optimal assessment percentage, is: Balanced Accuracy (BA) = ½ (Specificity + Sensitivity).
3. FINDINGS AND DISCUSSION
By artificial applying
intelligence, specifically six algorithms including EKI- AdaBoost, EKI-Bagging, EKI-BernoulliNB, EKI-DecisionTree, EKI-ExtraTree, and EKI- GaussianNB, which is the new algorithms by the sliding window combining between The experiment will be conducted using an online batch learning model (Batch Learning, batch size = 1188), meaning the system will perform 1188 steps (Batch 1188). With each step, all returned results will have an accuracy measurement. Accuracy typically calculates the percentage of a data group based on the total available data, initially functioning very reliably. However, if severe imbalanced dataset issues occur, such as a 90:10 ratio or a specific example where 100 people are examined, 99 of whom are ill and 1 is healthy, this often leads to a misconception about the model's quality. In such cases, the accuracy metric can be very high without the need for a model. All results are based on the use of Balanced Accuracy (BA). The choice of different metrics depends on the specific objectives of the problem and In cases of the dataset's composition. significant data imbalance, where one class may have only one data point while another has 999, traditional accuracy calculations become unreliable. Therefore, metrics like
199
Special Issue
JOURNAL OF SCIENCE AND TECHNOLOGY DONG NAI TECHNOLOGY UNIVERSITY
results from different algorithms. The average experimental results of the algorithms are represented in the chart below (Figure 1).
the other
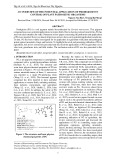
approache with Klinkenberg’s method. Using charts to compare the average results of these nine algorithms, this method ensures the most fairness in data accuracy when comparing the Examining Figure 2, using the method of comparing the average results and the final step results of the six algorithms, we observe a significant difference among the algorithms. Specifically, looking at the results of the EKI- BernoulliNB algorithm, this algorithm shows a very low result compared to the other five algorithms, reaching only 9.19% in average result and 8.86% in final step result. This indicates that it is not an optimal algorithm for this problem.
is difference. The EKI-Decision Tree algorithm also shows promising results, being only 4.58% lower than the highest algorithm, EKI- GaussianNB. However, two algorithms yield relatively low results, with EKI-ExtraTree achieving only 77.82%, which is 17.78% lower, and EKI-AdaBoost at just 63.48%, which is 32.12% lower than EKI-GaussianNB. After comparing the average results, we see that EKI-GaussianNB is the algorithm with the best results among the eight other algorithms, indicating that EKI-GaussianNB suitable the most algorithm to apply to this problem.
Other algorithms, however, yield quite high results, with three algorithms achieving above 90%, including EKI-AdaBoost, EKI- Bagging, and EKI-GaussianNB. Another
algorithm that performed quite well is ExtraTree, with 77.82% in average result and 81.60% in the final step result. The remaining algorithm, EKI-AdaBoost, performed worse, in achieving only 63.48% and 64.50% average and final step results, respectively.
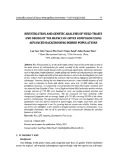
Figure 3. Average and last batch balanced-
accuracy of the EKI-Algorithms
the show not do When comparing the two algorithms with the highest average results, EKI-GaussianNB and EKI-Bagging, we see that the difference is not significant, with only a 1.16% Figure 2. Average balanced-accuracy of the 5 best performance of EKI- Algorithms In another aspect, when considering the final step ratio, EKI-GaussianNB still stands out, reaching 98.01%, higher than the next two algorithms, EKI-Bagging at 96.44% and Decision Tree at 93.93%. The measured differences compared to EKI-Bagging and EKI-Decision Tree are 1.58% and 4.09%, remaining respectively. Meanwhile, algorithms significant breakthroughs, with only a small difference
200
JOURNAL OF SCIENCE AND TECHNOLOGY DONG NAI TECHNOLOGY UNIVERSITY
Special Issue
the results of
the Besides averaging algorithms, another approach such as comparing the experimental model results gives us a more comprehensive and detailed view, helping us to visually evaluate and reach the most accurate conclusion. The experimental model results are represented in the chart below (Figure 3).
between the average results and the final step results. The most noticeable difference is 3.78% in the EKI-ExtraTree algorithm, which has an average ratio of 77.82% and a final step ratio of 81.60%. Other algorithms show differences of only 1-2%. In both the final step and average results, EKI-GaussianNB remains the superior algorithm compared to others, making it a good choice for this problem.
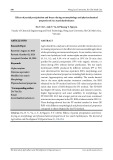
Figure 4. User Interface of system.
throughout
the
Based on the chart, we can easily see that EKI-BernoulliNB is the algorithm with the lowest values, ranging from a minimum of 6.13% to a maximum of only 15.48%. Besides comparing the achieved values, stability is also a criterion to determine whether an algorithm is good or not. Looking at the chart, we can clearly see that EKI- AdaBoost is the least stable algorithm, with the highest fluctuation from step 465 to step is 477 being 12.33%. This instability consistent EKI-AdaBoost’s performance on the chart. Although EKI- ExtraTree achieves a rate above 80%, specifically 84.27%, overall on the chart, three better when compared with algorithms, EKI-Bagging, EKI-GaussianNB, and EKI-Decision Tree, EKI-ExtraTree performs worse, and thus, it is not a priority algorithm for this problem. The three best- performing algorithms are separated into the chart below (Figure 5).
201
Special Issue
JOURNAL OF SCIENCE AND TECHNOLOGY DONG NAI TECHNOLOGY UNIVERSITY
diagnostician (user), as Use-case diagram below (Figure 4).
to the other
Figure 5. Use-case diagram.
For the chart comparing the three best- performing algorithms, the EKI-Decision Tree algorithm exhibits more instability compared two algorithms. Specifically, at step 920, it has a value of 92.7%, drops to 89.66% at step 922, and then returns to 91.47% at step 934. This fluctuation repeats throughout the chart. EKI- Bagging also performs well, showing stability and relatively high values. However, compared to EKI-GaussianNB, EKI-Bagging is not the optimal algorithm. At the highest disparity at step 775, the maximum difference between the two algorithms is 3.23%, with EKI-GaussianNB at 98.89% and Bagging at 95.66%. Download demonstrates EKI-GaussianNB
its superiority over the other algorithms by maintaining the highest stability. The peak data difference is 1.24%, between 97.19% at step 130 and 96% at step 138 (Figure 3). Combining the comparison of the final step and the average ratio of the nine algorithms, we can conclude that EKI-GaussianNB is the most deserving and suitable algorithm to apply to the problem.
4. SYSTEM IMPLEMENTATION
account in
the file "setup.zip", after extracting it will contain the following central files and directories: SETUP, DB, APP, RunServer.bat, INSTALL.bat, requirements.txt. Proceed the install to Python program by running the file 'python- 3.9.9-amd64.exe' in the SETUP folder. Install the related libraries to run the program by running the file CaiThuVien.bat. Running the Remove.bat file will delete all program data. The database file is located in the 'DB' folder named Data.db, which can be opened with the tool 'DB Browser for SQLite.exe' located in 'DB\DB Browser for SQLite'. Change the administrator '\APP\static\ dataUser.csv'.
Open the program by running the file
'RunServer.bat' or open the command line and
run the command 'manage.py runserver'. The
default port of the server is 8000 and can be
changed by
'manage.py
the command
runserver
202
JOURNAL OF SCIENCE AND TECHNOLOGY DONG NAI TECHNOLOGY UNIVERSITY
Special Issue
http://127.0.0.1:8000/', access the page 'http://127.0.0.1:8000/' which is the main page of the application. View Figure 5.
With the emergence of the application, this will bring many benefits, significantly contributing to improving the economic situation of Vietnam. 4. CONCLUSION
REFERENCES
clear results, with
EKI-BernoulliNB, V. Toan (2023). Application of Artificial Intelligence: The Key to Developing Modern and Sustainable Agriculture. Nhân Dân Online Newspaper. Source: https://nhandan.vn/ung-dung-tri-tue- nhan-tao-chia-khoa-phat-trien-nen- nong-nghiep-hien-dai-va-ben-vung- post744680.html.
L. Son (2023). Application of Artificial Intelligence Technology to Enhance Agricultural Productivity. Economic News Source: Newspaper. https://baotintuc.vn/kinh-te/ung-dung- cong-nghe-tri-tue-nhan-tao-de-nang- cao-nang-suat-nong-nghiep- 20230323075602822.htm. After completing the research and report writing process, it is possible to provide a relatively comprehensive evaluation of the content, obtained explaining data, charts, and algorithms specifically. In terms of the system, the program has successfully applied new EKI’s algorithms such as EKI-AdaBoost, EKI- Bagging, EKI- and EKI- DecisionTree, EKI-xtraTree, GaussianNB to the topic. The process of training models and predictions, while addressing the issue of handling variable data and in a dynamic environment, something that other algorithms have not been able to do. The topic will be further developed in the through including updating data future, survey methods, agricultural knowledge to obtain the most optimal and realistic dataset.
A.I.A. (2023). Agricultural crop dataset. Source:
Kaggle. https://www.kaggle.com/datasets/agrii nnovate/agricultural-crop-dataset
Patel, R. (2023). Crop yield prediction Source: Kaggle. dataset. https://www.kaggle.com/datasets/patelr is/crop-yield-prediction-dataset
(2023). Crop production India. Kaggle. Source:
Mahajan, N. statistics https://www.kaggle.com/datasets/nikhi lmahajan29/crop-production-statistics- india
With the emergence of the application, this will bring many benefits, contributing significantly to the spiritual life of the Vietnamese people. The system can support proposing the most suitable crop type for conditions at the local level and detailed information about that crop. The system can be installed quickly without requiring the server to have too high configuration to be able to run diagnostics, installation steps are quick, and support customization. Users can easily and flexibly use it to obtain information on humidity and temperature of specific locations, helping users easily input data. API support allows developers to deploy models on mobile, Java software, and iOS easily. Powers, D. M. (2020). Evaluation: from precision, recall and F-measure to ROC,
203
Special Issue
JOURNAL OF SCIENCE AND TECHNOLOGY DONG NAI TECHNOLOGY UNIVERSITY
markedness Intelligence Applied
and preprint Tourism
informedness, correlation. arXiv arXiv:2010.16061.
dynamiques
application à to Artificial Challenges: Address Predicting Hotel Room Cancellations. In 11th International Conference on Emerging Challenges: Smart Business and Digital Economy 2023 (ICECH 2023) (pp. 434-445). Atlantis Press.
(2015). Méthodes de Ho, A. K. N. et classifications incrémentales: la numérisation cognitive d'images de dissertation, documents (Doctoral Tours).
selection
and Klinkenberg, R. (2004). Learning drifting concepts: Example vs. example weighting. In Intelligent data analysis, 8(3), pp. 281-300.
Anh-Khôi, N. H., Hà-Duy-Nguyên, L., & (2024, February). Vĩnh-Khang, T. Ngo, H. A. K., Pham, V. T., & Tran, V. T. (2024). Evolving with Klinkenberg’s Idea (EKI) Algorithms for Automatic Identification of Sa Huynh Antique Glass Artifacts. In 13th Conference on Information Technology Its Applications 2024 (CITA 2024) (pp.81- 92). Information And Communications Publishing House.


![Giáo trình Đất trồng phân bón (Nghề Bảo vệ thực vật CĐ/TC) - Trường Cao đẳng Gia Lai [Mới Nhất]](https://cdn.tailieu.vn/images/document/thumbnail/2026/20260224/hoacattuong2026/135x160/9591771994804.jpg)
![Giáo trình Kỹ thuật canh tác cây lương thực (Nghề Bảo vệ thực vật - CĐ/TC) - Trường Cao đẳng Gia Lai [Mới nhất]](https://cdn.tailieu.vn/images/document/thumbnail/2026/20260224/hoacattuong2026/135x160/12471771994805.jpg)


![Giáo trình Công nghệ sau thu hoạch (Nghề Bảo vệ thực vật - CĐ) - Trường Cao đẳng Đà Lạt [Mới nhất]](https://cdn.tailieu.vn/images/document/thumbnail/2026/20260224/hoacattuong2026/135x160/32161772096417.jpg)
