
154
HNUE JOURNAL OF SCIENCE
Natural Sciences 2024, Volume 69, Issue 3, pp. 154-162
This paper is available online at http://hnuejs.edu.vn/ns
DOI: 10.18173/2354-1059.2024-0045
APPLICATION OF SPECTROSCOPIC METHODS
FOR THE AUTHENTICATION OF AGRICULTURAL PRODUCTS
OF VIETNAM: A STUDY OF ST25 RICE
Nguyen Quynh Hoa1, Bui Thu Thuy2 and To Thi Mai Huong3
1Department of General Education, University of Science and Technology of Hanoi,
Vietnam Academy of Science and Technology, Hanoi city, Vietnam
2Department of Chemistry, College of Natural Sciences, Hanyang University,
Seoul city, South Korea
3Department of Life Sciences, University of Science and Technology of Hanoi,
Vietnam Academy of Science and Technology, Hanoi city, Vietnam
*Corresponding author: Nguyen Quynh Hoa, e-mail: nguyen-quynh.hoa@usth.edu.vn
Received August 13, 2024. Revised October 4, 2024. Accepted October 31, 2024.
Abstract. Food fraud, particularly in staple commodities like rice, poses significant
risks to trademark protection as well as economic challenges. In this study, we
explored the efficacy of Raman spectroscopy in differentiating authentic ST25
rice—a premium variety of Vietnam from other rice types, amidst concerns of
adulteration. By utilizing both backscattering and transmission Raman spectroscopy,
a total of 125 rice samples consisting of both commercial rice and Vietnamese
landrace rice varieties were analyzed. All samples were categorized into two main
groups namely ST25 and Non-ST25 for the construction of the classification model.
Through principal component analysis (PCA) and k-nearest neighbors (kNN)
classification method, we achieved classification accuracies of 81.58% for
backscattering data and up to 97.37% for transmission data at elevated temperatures.
Our findings highlight the efficacy of Raman spectroscopy for rice authenticity
verification, nevertheless, modification in spectral measurement schemes is
necessary to obtain better method reproducibility as well as to maintain high
discriminatory accuracy of the classification model.
Keywords: ST25 rice, Raman transmission, Raman backscattering, principal
component analysis, k-nearest neighbors.

Application of spectroscopic methods for the authentication of agricultural products…
155
1. Introduction
Food fraud has been a pressing global issue. The term food fraud or food crime refers to
the intentional deception of food for profit [1]. Food fraud occurs frequently in commodities
consumed in large quantities [2], in which rice is a vulnerable item for adulteration since it is
a staple food for over half of the world's population [3]. Common forms of rice fraud include
mislabelling using cheaper, lower-quality products instead of the high-quality products as
indicated on the label [4], adding artificial flavors to mask the use of tasteless rice, and mixing
high quality rice with low quality or genetically modified rice products [5]. These fraudulent
practices can threaten public health and negatively impact the nation’s economy of food [6].
Therefore, the use of rapid and reliable analytical methods for the verification of product
quality and the assessment of food safety is essential [7]. The authentication of rice and rice
products has long been conducted using modern analytical techniques combined with
multivariate analysis. Besides popular methods such as isotope ratio mass spectrometry,
inductively coupled plasma mass spectrometry, DNA analysis, and omics analysis [8]-[9],
spectroscopic methods are also widely used for food authenticity owing to various advantages
such as non-destructive analysis, rapid and reliable results with high reproducibility, cost, and
labor efficiency [10].
Among spectroscopic techniques commonly used for rice authentication such as near-
infrared spectroscopy, laser-induced breakdown spectroscopy, and nuclear magnetic
resonance, Raman spectroscopy has been developed as a rapid measurement method for food
quality assurance and safety monitoring [11]-[13]. Rice is a product with a complex sample
matrix, primarily consisting of a mixture of components such as carbohydrates, lipids,
proteins, and other biological components. Raman spectra are capable of simultaneous
identification of numerous molecules with fingerprint recognition [14], enabling quick
component analysis or online monitoring [15]-[16]. Meanwhile, the rapid development of
Raman reading devices and smart data processing algorithms has propelled the widespread
application of Raman spectroscopy in food monitoring. Factors such as post-harvest
processing conditions, geographical origin, or variety may considerably affect the chemical
compositions of food, and in turn, this is reflected in different levels of radiation absorption
at specific wavelengths. Such information in combination with data analysis allows the
differentiation of various food types, thereby expanding the scope of applications and the
number of publications in this field. By combining data processing and chemical analysis,
Raman spectroscopy provides rapid identification of rice species, varieties, production regions,
and market monitoring [17]-[18].
ST25 rice is a premium agricultural product of Vietnam that was developed by Mr. Ho
Quang Cua for high yields and resilience against various climatic conditions. This rice variety
has won the “World’s Best Rice” awards twice in 2019 and 2023, making it a valuable
fraudulent target for unscrupulous vendors for economic benefits. Therefore, in this study,
we aimed to investigate the potential of Raman spectroscopy in distinguishing authentic ST25
Nguyen QH, Bui TT & To TMH
156
rice from other rice types. This can serve as preliminary research toward developing rapid
detection methods for the authenticity of commonly traded rice varieties in the market.
2. Content
2.1. Methods
2.1.1. Sample collection
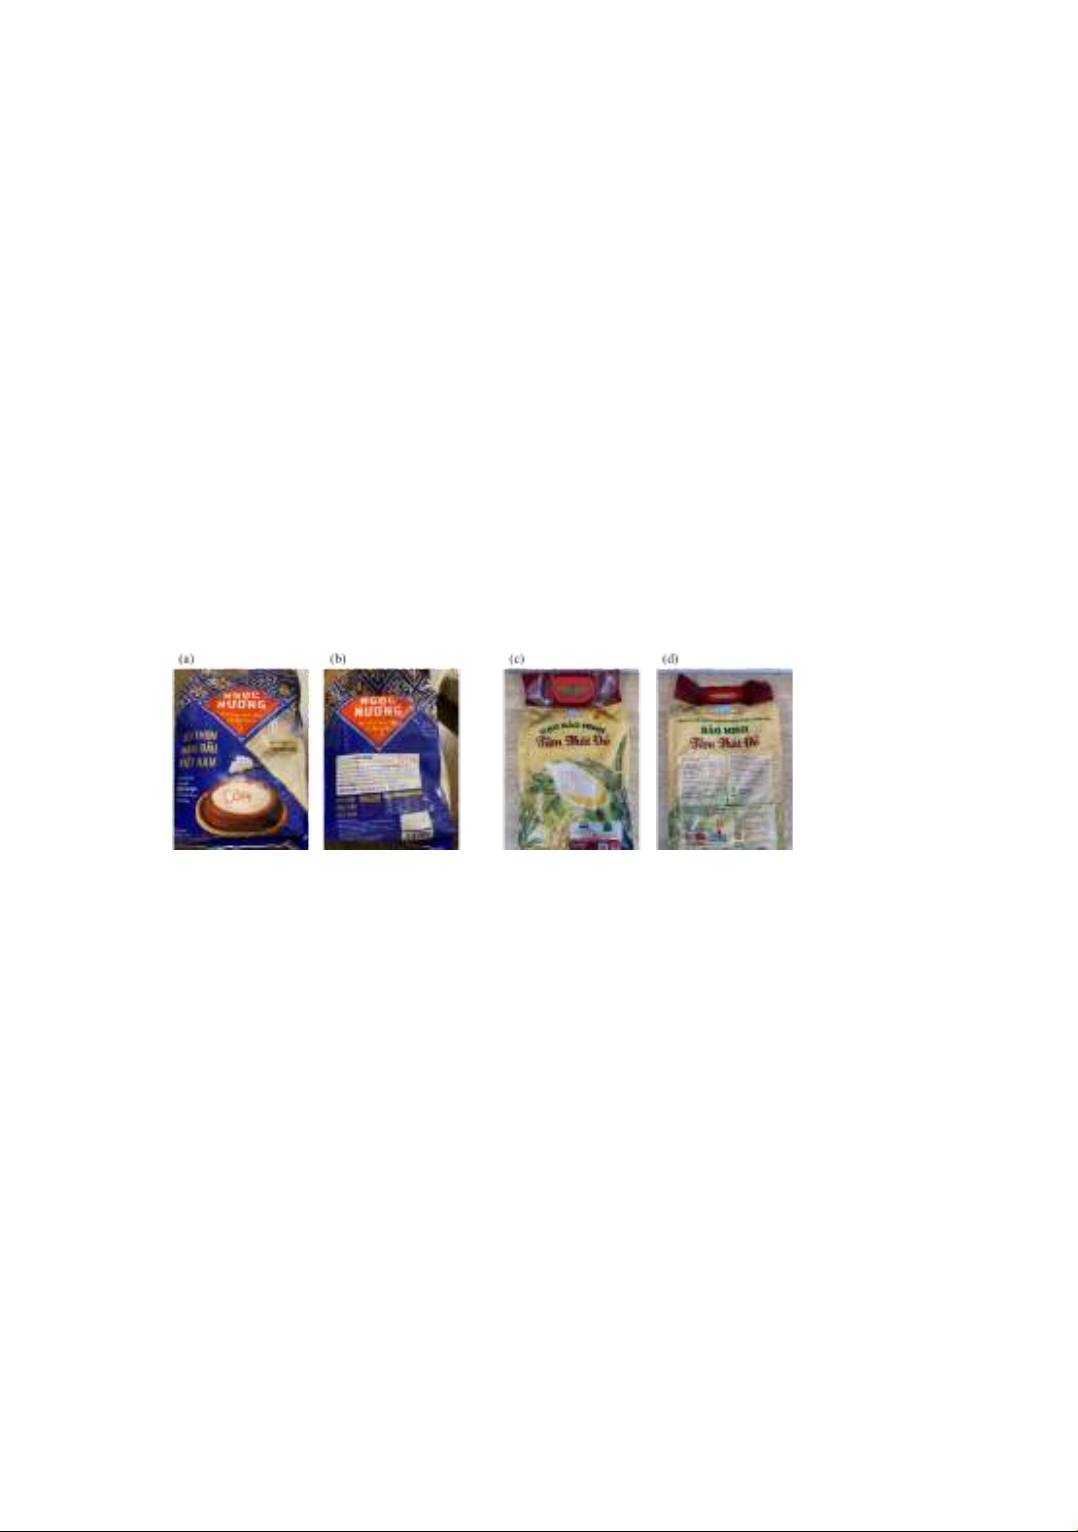
A total of 125 samples were used in this analysis including 46 commercial ST25 rice
samples, 33 commercial non-ST25 rice samples, and 46 rice samples from the
Vietnamese rice collection. Commercial ST25 rice samples were purchased in 2022 from
different brands with proper labels providing adequate product information such as origin,
production date, and expiration date. Non-ST25 commercial rice samples were acquired
similarly. Examples of commercial ST25 and non-ST25 rice samples are shown in Figure 1.
Samples from the Vietnamese landrace rice varieties were provided by the Plant
Resources Center in An Khanh, Hanoi, and were cultivated at the Biological and
Experimental Station of the Vietnam Academy of Science and Technology in 2023. The
commercial ST25 rice samples were categorized into the ST25 group, while the other rice
samples were categorized into the Non-ST25 group for the classification model.
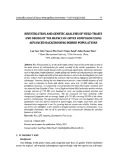
Figure 1. Examples of a commercial ST25 rice sample (a: front view and b: back view
of a package) and a commercial non-ST25 rice sample (c: front view and d: back view
of a package)
2.1.2. Raman measurement
Raman spectral signals were collected using two different methods: transmission and
backscattering. For transmission Raman measurement, a laser source (785 nm, Invictus,
Kaiser Optical Inc., USA) with a laser illumination diameter of 1 mm was irradiated on
the side of the vial (9.8 mm diameter x 20 mm depth) containing rice grains, and sample-
interacting photons were collected at the opposite side using a PhAT probe connected to
a Raman spectrometer (RamanRxn1 unit, Kaiser Optical Inc.). Meanwhile, for
backscattering Raman measurement, each sample of rice grains was placed in a rotating
holder with dimensions of 35mm in diameter and 10 mm in depth, and the laser with a 6-
mm laser illumination diameter was used to irradiate the sample. The scattered radiation
was collected by a detector placed on the same side as the laser source [19]. The
backscattering Raman signal was measured at 20 °C, while the transmission Raman signal

Application of spectroscopic methods for the authentication of agricultural products…
157
was conducted at four different temperatures: 20, 30, 40, and 50 °C to assess the
feasibility of different measurement methods. Triplicate Raman spectra of each sample
were collected and the average spectrum of these triplicate measurements was employed
for subsequent analysis.
2.1.3. Data processing
The baseline of each raw spectrum was corrected by asymmetric least squares
smoothing (AsLS), and then the AsLS-processed spectrum was normalized by dividing
the intensities of each peak by the peak area calculated over the 1700-800 cm-1 range. For
125 rice samples belonging to two groups, ST25 and Non-ST25, principal component
analysis (PCA) was used to evaluate the overall separation between the groups.
Subsequently, the k-nearest neighbors (kNN) method was used to differentiate between
the two groups. Two-level cross-validation (CV) [18] was used to evaluate the
classification accuracy of the kNN model with three-fold cross-validation and 100
repetitions. Baseline correction, spectral normalization, PCA, kNN analyses, and
graphical representations were conducted using MATLAB R2020b.
2.2. Results and discussion
2.2.1. Raman spectra data
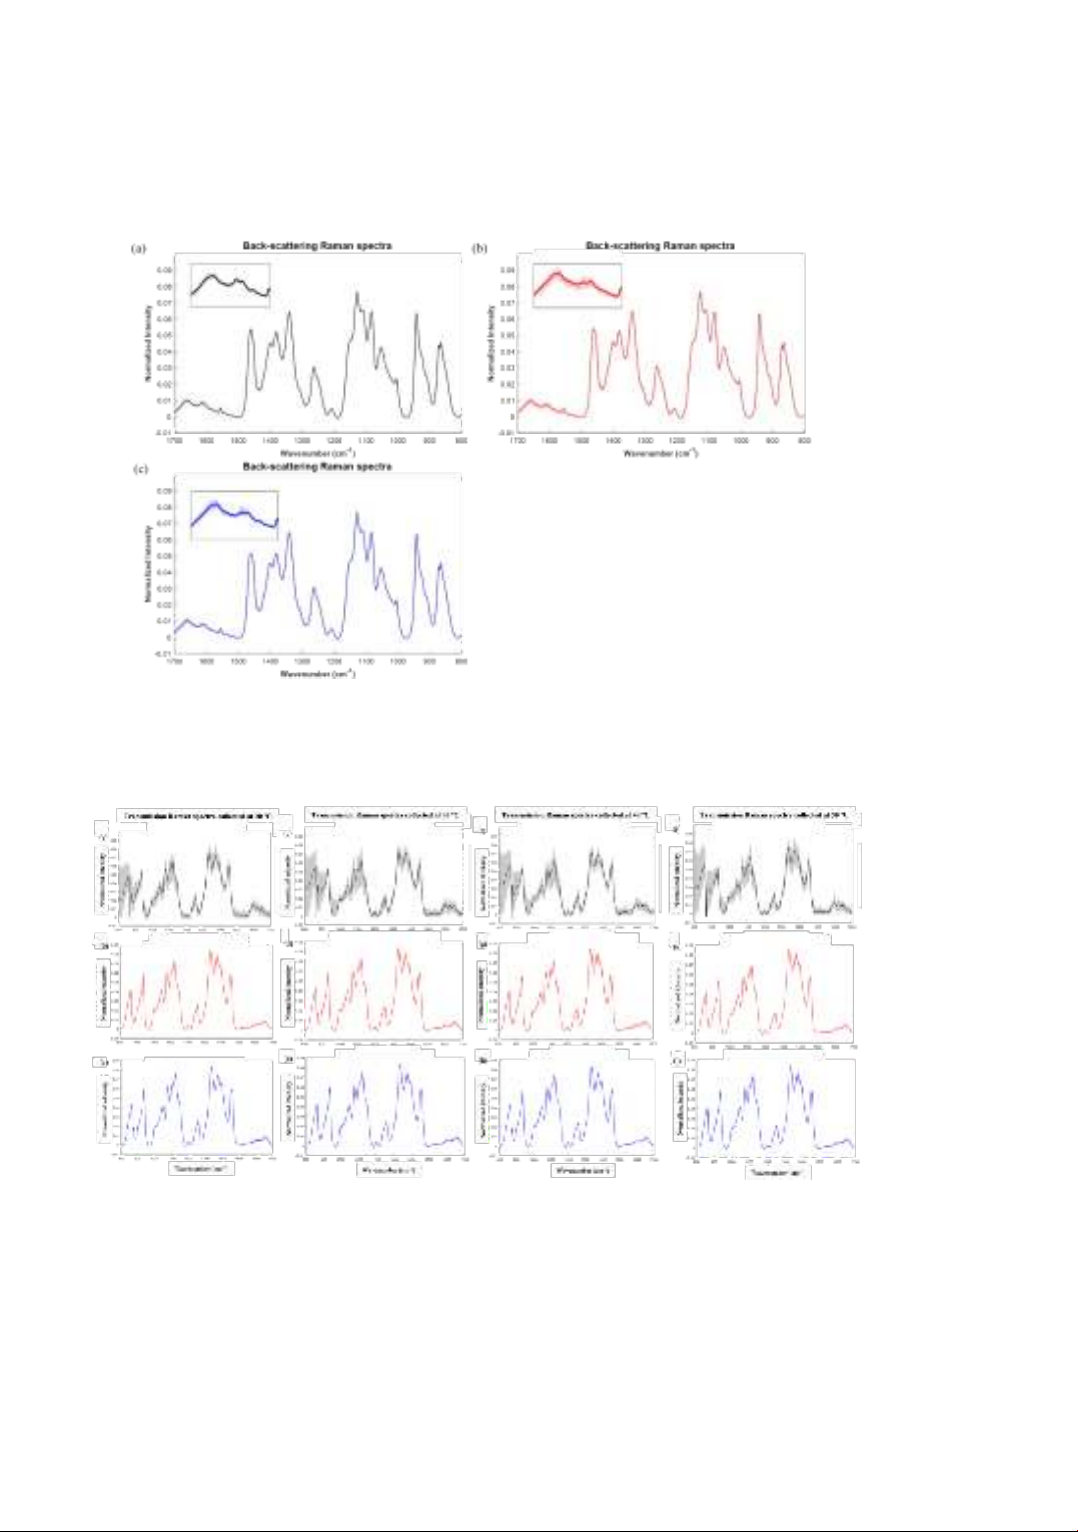
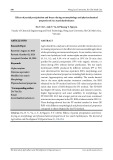
The backscattering Raman spectra of the rice samples displayed similar spectral
patterns (Figure 2). The main differences appeared in the wavelength ranging from 1550
to 1700 cm-1, which may be related to the protein content of the samples [20]. The
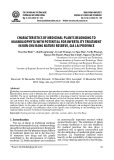
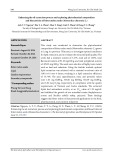
transmission Raman signal of Vietnamese rice collection samples at different
temperatures showed significant variation across the wavelength range, whereas the
transmission signal of the commercial rice samples was more stable (Figure 3). This could
be due to the heterogeneous inner structure of the rice grains [21]. The rice grains consist
of three main parts: the bran layer, the endosperm, and the embryo, each of which is
composed of different chemical components. Consequently, the Raman signal at each
position varies accordingly. The collection of transmission Raman data from the rice
samples was also affected by these components, where the outermost layer of samples
from the Vietnamese rice collection often still has bran because they have not been milled
thoroughly, while the outermost layer of other commercial rice samples has been milled.
In addition, the transmission Raman measurement scheme may provide less variation in
spectral intensities of the commercial rice samples [20]. However, examination of a small
amount of rice grains may induce spectral variation between the Vietnamese landrace rice
samples and the commercial samples. A larger sample coverage area or the increment in
measurement from different random positioning of samples may help reduce such among-
sample variation as well as increase the reproducibility of the measurement method [22].
In contrast, the backscattering Raman signal of the samples from the Vietnamese rice
collection was relatively stable and had a pattern similar to that of the commercial ST25
rice samples and the commercial non-ST25 rice samples. The signal intensities of the
commercial samples, regardless of ST25 or non-ST25 rice were relatively similar, with
Nguyen QH, Bui TT & To TMH
158
only a few different regions between the two groups, such as the wavelength range from
1480 to 1700 cm-1, corresponding to the protein content, or the wavelength range from 1300 to
1450 cm-1, corresponding to amylose/amylopectin content [20].
Figure 2. Backscattering Raman spectral data presented as mean (solid line) ±
standard deviation (shaded area) of (a) rice samples from the Vietnamese landrace
rice varieties, (b) commercial ST25 rice samples, and (c) commercial non-ST25 rice
samples. Magnified regions from 1550 to 1700 cm-1 are shown in the insets
Figure 3. Transmission Raman spectral data measured at 20 to 50 ºC of rice samples
from the Vietnamese rice collection (a, c, f, i), commercial ST25 rice samples (b, d, g,
k), and commercial non-ST25 rice samples (c, e, h, l)


![Giáo trình Công nghệ sản xuất bánh kẹo (Nghề Chế biến thực phẩm - Trình độ trung cấp) - Trường Cao đẳng Cơ điện Hà Nội [Mới nhất]](https://cdn.tailieu.vn/images/document/thumbnail/2026/20260323/lionelmessi01/135x160/52561774426348.jpg)


![Giáo trình Hoá sinh thực phẩm - Trường Cao đẳng Cơ điện Hà Nội [Mới nhất]](https://cdn.tailieu.vn/images/document/thumbnail/2026/20260323/lionelmessi01/135x160/29921774423858.jpg)


