
Original article
Evidence of osmoregulation in Larix decidua
at Alpine treeline and comparative responses to water
availability of two co-occurring evergreen species
Alessandro Badalottia,*, Tommaso Anfodilloband John Gracea
a University of Edinburgh, Institute of Ecology and Resource Management, Darwin Building, Mayfield Road,
Edinburgh EH9 3JU, Scotland, U.K.
b Dipartimento Territorio e Sistemi Agro Forestali, University of Padova, Agripolis, Via Romea, 16, 35020 Legnaro (PD), Italy
(Received 18 November 1999; accepted 12 May 2000)
Abstract – The water relations of three coniferous species (Larix decidua, Picea abies and Pinus cembra) growing at a treeline eco-
tone in the Southern Alps were investigated. Sap flux and xylem water potential were measured in two individuals of each of the
above-mentioned species during part of summer 1997. Throughout the growing period, L. decidua showed a gradual decrease in min-
imum water potential while for P. abies and P. cembra, variations were more correlated to actual weather conditions. Daily sap flux
was also higher in L. decidua than in the two other species. Pressure-volume curves derived for L. decidua during July 1997 demon-
strated that the species further diminished its minimum water potential through osmoregulation. During dry periods the other species
showed an evident reduction in sap flux suggesting a water saving behaviour. The three species seem therefore to have evolved dif-
ferent drought avoidance strategies.
osmotic adjustment / Pinus cembra / Picea abies / sap flow / pressure-volume curves
Résumé – Évidence d'un ajustement osmotique chez Larix decidua à la limite de l'étage forestier alpin et réponses comparées
à la disponibilité en eau de deux espèces de conifères co-existantes. On a étudié les stratégies hydriques de trois espèces de coni-
fères (Larix decidua, Picea abies et Pinus cembra) qui poussent dans un écotone à la limite supérieure de l'étage forestier dans le sud
des Alpes. On a mesuré le flux de sève et le potentiel hydrique du xylème pour deux individus des espèces citées précédemment pen-
dant une partie de l'été 1997. Durant la période de végétation, L. decidua a montré une diminution progressive du potentiel hydrique
minimum tandis que les variations de P. abies et de P. cembra étaient corrélées en grande partie aux conditions atmosphériques. Le
flux de sève journalier aussi était plus important chez L. decidua que dans les deux autres espèces. Les courbes pression-volume éta-
blies pour L. decidua au mois de juillet 1997 montrent que l'espèce est en mesure de diminuer ultérieurement son potentiel hydrique
minimum à travers un ajustement osmotique. Pendant les périodes de sècheresse, les autres espèces ont manifesté une réduction
visible du flux de sève suggérant ainsi un comportement adapté pour limiter la consommation d'eau. Les trois espèces semblent donc
avoir développé des stratégies différentes pour éviter la sécheresse.
ajustement osmotique / Pinus cembra / Picea abies / flux de sève / courbes pression-volume
Ann. For. Sci. 57 (2000) 623–633 623
© INRA, EDP Sciences
*Correspondence and reprints
Tel. 0131 650 5437; Fax. 0131 662 0478; e-mail: abadalotti@hotmail.com

A. Badalotti et al.
624
Abbreviations
Fd: Sap flux density (dm3dm-2 h-1)
PAR: Photosynthetic active radiation (µmol m-2 s-1)
R: Hydraulic resistance (MPa dm-1 h)
RTLP: Relative water content at turgor loss point
RWC: Relative water content
VPD: Vapour pressure deficit (hPa)
WPTLP: Water potential at turgor loss point (MPa)
εmax: Maximum elastic modulus
of the cell wall (MPa)
ψ: Xylem water potential (MPa)
ψm: Minimum xylem water potential (MPa)
ψpd: Predawn xylem water potential (MPa)
ψπ: Osmotic potential (MPa)
ψπ100: Osmotic potential at full turgor (MPa)
1. INTRODUCTION
In the last few years a renewed interest in the physiol-
ogy of plants growing at treeline has been sparked by the
realisation that global climate change could have a
marked effect on the treeline ecotone [3, 13]. Treelines
are controlled by a range of environmental factors in dif-
ferent parts of the world with temperature usually identi-
fied as the main one [15]. The treelines of the Alps
appear to be determined, at least in part, by winter and
spring desiccation of needles when the soil is frozen.
This has been attributed to an incomplete development
of the needle cuticle during the short growing period [30,
37], although this is not usually the case in more mar-
itime regions [10, 11].
Recent evidence suggests that climate changes can
affect the distribution of plant communities and shift the
range of various alpine species [19, 21] and climate
warming has been thought to be the cause of an altitudi-
nal shift upwards in alpine plants [9]. However, no evi-
dent effects of recent higher summer temperatures on alti-
tudinal range have been recorded in alpine Pinus
sylvestris and Pinus cembra [14]. A better understanding
of tree physiology at the treeline is needed in order to pre-
dict possible future scenarios brought about by climate
change. Indirect effects (such as the duration of snow
cover or the amount of water in the soil) appear to be
more important than direct temperature effects on life
processes [18]. Climate scenarios suggest lower rainfall
and more frequent droughts [36], which may influence
species distributions as a consequence of species variabil-
ity in water relations [7]. It follows that the seasonal mon-
itoring of water status in trees at treeline should increase
our understanding over how climate change can affect
their distribution. Recently, drought resistance mecha-
nisms of different species at treeline have been studied in
the Southern Alps [2]. Although trees growing at the
alpine treeline only rarely undergo severe water stress
because of high precipitation during the vegetative peri-
od, moderate water deficits may lead to a strong reduc-
tion of transpiration due to a high stomatal sensitivity to
drought. Tree species found at treeline show a well-devel-
oped water-saving behaviour, probably induced by the
low soil water content due to the shallow mountain soils.
Some species (such as Larix decidua) appear to cope with
these moderate water deficits better than others (Picea
abies and P. cembra). Studies carried out on a treeline
ecotone in the Italian Alps hypothesised the occurrence of
osmoregulation in L. decidua during periods of drought.
Osmoregulation can contribute to the maintenance of tur-
gor during periods of water stress and could therefore
increase the chances of this species to compete with the
other treeline species for the colonisation of the alpine
areas rendered suitable to seedling establishment in the
case of climate warming. In this article we will discuss
the importance of this phenomenon in relation to drought
response and competitive abilities of these three species.
2. MATERIALS AND METHODS
2.1. Study site
The experiments were conducted on a treeline ecotone
(sensu Crawford [5]) at 2080 m above sea level in the
Southern Alps (Italian Dolomites, Cortina d’Ampezzo).
The site has a Southern aspect and 30% slope, with shal-
low calcareous soil. The treeline is formed by mixed
stands of relatively young L. decidua, P. cembra and
P. abies which are invading edges of recently abandoned
pasture [8]. June-September mean precipitation is
450–500 mm.
Six trees (the same ones used in another study [2] dur-
ing 1996) were used for the experiment, two for each of
the above-mentioned species (table I).
2.2. Xylem water potential
Xylem water potential (Ψ) was measured for seven
days (from 1 July to 23 August 1997; days 182–235) on
1-year-old shoots. Two shoots were collected at a height
of 2 m on each tree from predawn (Ψpd) to dusk at inter-
vals of 2 hours and measurements were made directly at
the site with a pressure chamber within two minutes of
collection. Data were then averaged since no significant
(p = ns) statistical difference was recorded between indi-
viduals of the same species (table III).

Osmoregulation in L. decidua 625
2.3. Sap flux density
Xylem sap flux density (Fd, dm3dm-2 h-1) was mea-
sured in each tree using 2 cm continuously-heated sap
flowmeters [12]. Sensors were inserted into the xylem
(NW aspect) at 1.5–2 m. Measurements were taken
every minute, averaged and stored every 15 minutes
using a storage module connected to a datalogger (CR10,
Campbell Ltd, Lincoln, Nebraska). Protection from high
solar radiation was ensured, both by insulating shields
placed over the sensors in the case of L. decidua and by
the dense tree crowns reaching to the ground for P. abies
and P. cembra. Sap flux density was measured from 17
June to 13 October 1997 (days 168–286). Sapwood area
and total tree transpiration were not estimated because of
the uncertainty in defining the number of active tree
rings and the contribution of each of them to the total
water transport.
2.4. Hydraulic resistance
The sapwood-specific hydraulic resistance between
soil and needles was calculated from the relationship
between needle water potential and sap flux density:
Rsoil-needle =
(Ψneedle – Ψsoil)
Fd
Where Rsoil-needle is the sapwood-specific hydraulic resis-
tance between soil and needles (MPa dm-1 h), Ψsoil and
Ψneedle are the soil and needle water potential respective-
ly (MPa) and Fdthe sap flux density (dm3dm-2 h-1).
2.5. Pressure-volume curves
Ten pressure-volume curves were derived for
L. decidua at the site and two for P. cembra at irregular
intervals in the period between 29 June and 2 August
(days 180–214). Samples were always taken from the S
exposed canopy at a height of 1.5–2.5 m from the ground
in the evening hours of the day previous to the day of the
measurement, sealed in a polythene bag to reduce evapo-
rative loss of water and taken to the laboratory. Here cut
ends of the shoots were immersed in water and the
shoots were left rehydrating for 12–15 hours in the dark-
ness for the whole night [26, 34].
The pressure-volume curves were constituted as the
standard method described in the literature [33] suggests,
collecting data by using a pressure chamber [28]. A wet
piece of blotting paper was enclosed in the pressure
chamber in order to prevent evaporative loss during the
measurements [31, 34]. Pressure was increased slowly
(0.01 MPa s-1) during the measurements, until a droplet
of xylem sap appeared on the section of the shoot.
In some samples Ψremained almost constant with tis-
sue dehydration in the region of high turgor potential
[25]. This particular “plateau effect” is believed to be an
artefact caused by oversaturation of samples [20] even if
observed in naturally rehydrated plants [25].
In order to minimise the plateau effect, the raw data
were plotted and, after having excluded the points where
this effect was evident, the real saturated weight (Ψ=0)
of the shoots was extrapolated using a linear regression
of fresh weight against balance pressure as suggested in
the literature [22].
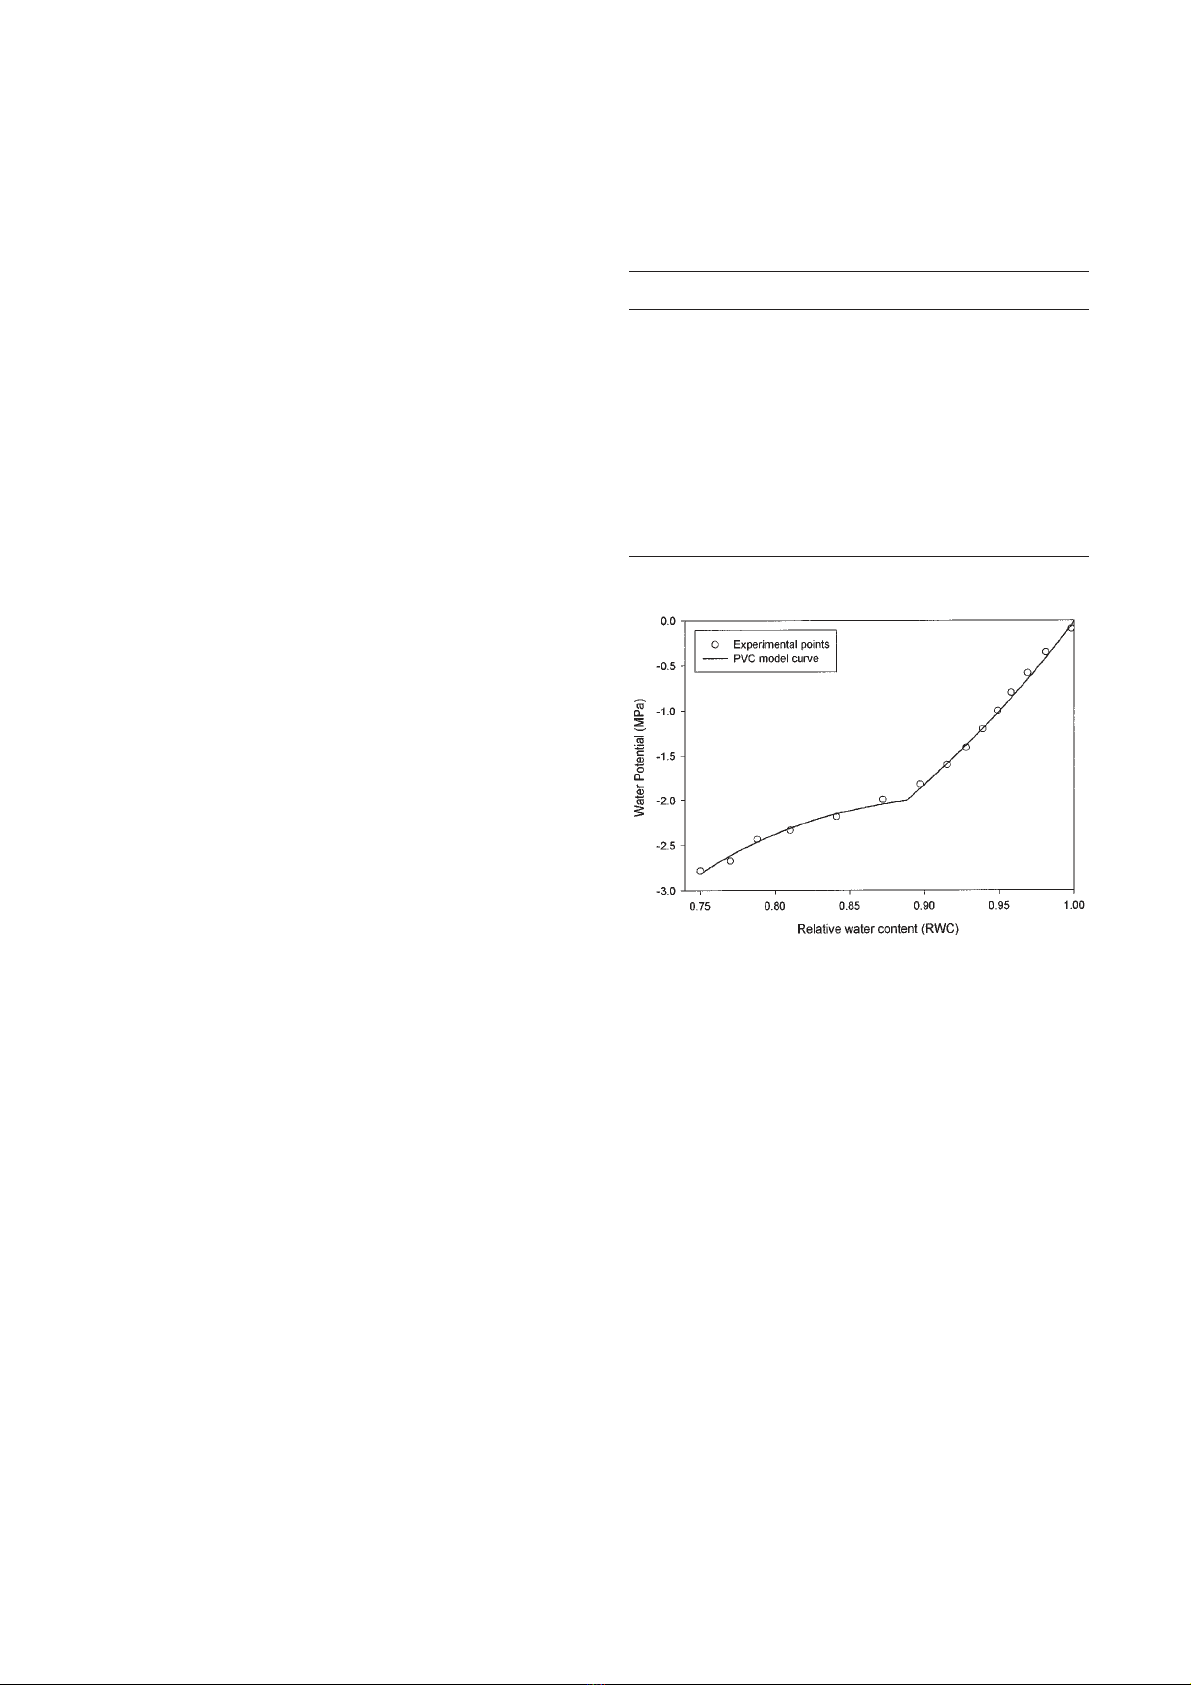
Curves were then analysed using a segmented non-
linear regression algorithm [26] fitted on a modified
exponential model described in the literature [29]. When
the plateau effect was minimum the model used fitted
the experimental data very well (figure 1). In other cases
a slight difference appeared in the region of high turgor
pressure. However, for all curves, the variance explained
from the model exceeded 0.972 (table II). All curves and
parametric values inferred from them were derived sepa-
rately and then averaged for display in the figures. This
was not possible for L. decidua for day 208 and 212, in
which only one curve was available.
2.6. Microclimate
Standard meteorological variables above the canopy
(global radiation, air temperature, relative humidity,
wind velocity and direction, rainfall and photosynthetic
active radiation) were monitored every minute, averaged
and stored every 15 minutes with a datalogger (Campbell
Table I. Main features of the sampled trees including their age
as calculated from sample cores the year before the study, their
diameter at breast height (1.3 m) and their height.
Tree Age Diameter Height
(years) at breast height (cm) (m)
L. decidua #1 38 24.2 10.2
L. decidua #2 59 25.1 9.6
P. abies #1 54 25.1 9.3
P. abies #2 53 30.9 11.1
P. cembra #1 36 27.3 7.2
P. cembra #2 47 33.4 7.9
A. Badalotti et al.
626
Ltd CR10) connected to two multiplexers (Campbell
AM32). A solar panel (Helios technology 50 W) and bat-
teries (140 Ah) provided power.
2.7. Soil water
Relative soil moisture content was measured with time
domain reflectometry (Campbell CS615) at 30 cm depth
with a water content reflectometer from 11 June (day
162) to 13 October (day 286). These measurements are
expressed as relative values in relation to the maximum
value recorded after high precipitation occurred (i.e. rela-
tive soil water content compared to soil holding capacity).
3. RESULTS
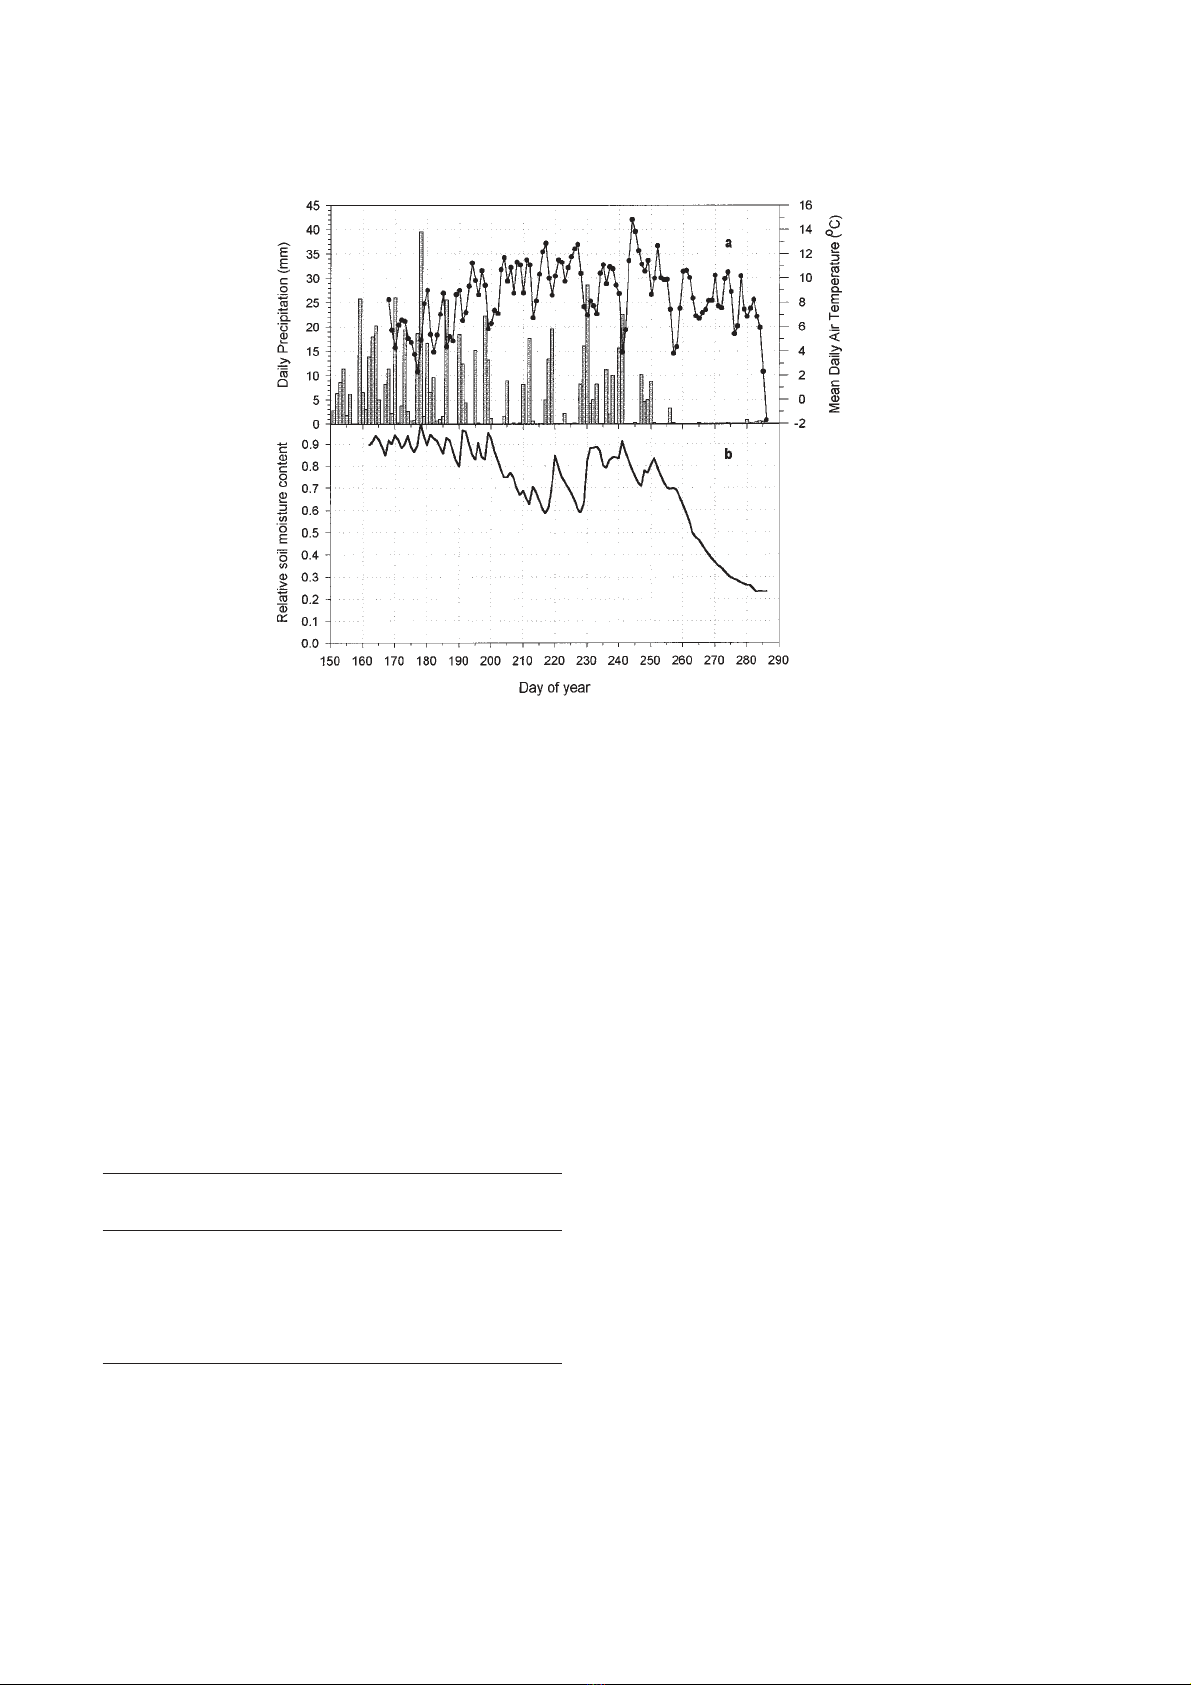
During summer 1997 (June–September) an above-
average rainfall of 652.6 mm was recorded (figure 2a).
However, an unusually dry period occurred from
9 September (day 252) to 13 October (day 286 and end
of the measurements) (figure 2b).
The maximum mean air temperature was reached at
the beginning of September (about 15 °C), just after a
cool spell at the end of August.
3.1. Shoot water potential
Figure 3 shows the seasonal course of predawn water
potential (Ψpd) and minimum water potential (Ψm) for
the selected trees. P. abies was the species with the high-
est values of Ψpd, dropping below – 0.4 MPa only during
August and maintaining a fairly constant value through-
out the study period. L. decidua and P. cembra showed
parallel variations for most of July (days 182–204).
While in P. cembra Ψpd became less negative at the end
of July, in L. decidua it continued to decrease to a mini-
mum (–1.07 MPa) at the end of August (day 235).
Minimum water potentials (Ψm) of P. abies and
P. cembra displayed parallel time courses during most of
July (days 190-211). However, while P. abies reached its
minimum (–1.48 MPa) at the end of August (day 235),
the minimum for P. cembra (–1.28 MPa) was reached at
the end of July (day 211). L. decidua Ψmcontinued to
decrease throughout the study period, with a different
pattern than in the other two species and reaching its
minimum (–2.23 MPa) at the end of August (day 235).
Different statistical tests showed that there was a
highly significant effect of species and, in some cases,
time of the season on the values of Ψpd and Ψm
(table III). However, differences between individuals
were not significant.
3.2. Daily and seasonal variations
in sap flux density
Daily fluctuations in water potential, in relation to
meteorological parameters and sap flux density, are
shown for two representative days in figure 4. Because
of the frequent and rapid variations in cloudiness at high
altitude, air temperature, vapour pressure deficit (VPD)
and solar radiation changed abruptly.
Sap flux of all species was visibly coupled with VPD.
In L. decidua Fdincreased sharply and reached the daily
maximum by mid morning. Ψdecreased rapidly and Ψm
was usually reached by 10 AM. Once the minimum was
Table II. Values of the variance explained (R2) of each of the
pressure-volume curves drawn. a= Larix decidua, b= Pinus
cembra.
Date Day of year R2
a
29-Jun 180 0.998
29-Jun 180 0.99
16-Jul 197 0.972
16-Jul 197 0.98
27-Jul 208 0.992
31-Jul 212 0.998
02-Aug 214 0.972
02-Aug 214 0.986
b
01-Aug 213 0.999
01-Aug 213 0.998
Figure 1. Example of accuracy of model (line) derived pres-
sure-volume curve and experimentally derived data (points) for
day 180 (29 June).
Osmoregulation in L. decidua 627
reached, Ψincreased slowly compared to the rapid fall in
the morning. Fdin P. abies and P. cembra increased later
and the maximum daily values were much lower than
those of L. decidua. It is interesting to notice that when
VPD was high at night (1–3 hPa) there was a detectable
sap flux occurring in L. decidua as shown in day 190 in
figure 4. The other two species however did not show
nocturnal transpiration.
3.3. Seasonal variation in hydraulic resistance
Sapwood-specific hydraulic conductance (1/Rsoil-needle)
and hydraulic resistance (Rsoil-needle) were calculated for
the three species during the study period (figure 5) and
showed different trends for each of the species studied.
In L. decidua, Rsoil-needle increased constantly throughout
the month of July, reaching its maximum (0.6 MPa
dm–1 h) at the end of July (day 211) and then decreasing
during August. In P. abies, after some initial fluctua-
tions, Rsoil-needle increased from July to August reaching
its maximum (0.45 MPa dm-1 h) at the end of August
(day 235). P. cembra showed a highly fluctuating trend
reaching its maximum (0.51 MPa dm-1 h) on day 211
only to decrease sharply in August. Regression lines for
Rsoil-needle were good for all cases of L. decidua and
P. abies but only for two of P. cembra.
3.4. Pressure-volume curves
Pressure-volume curves for L. decidua were derived
during five different days from the end of June to the
beginning of August and two curves for P. cembra were
derived at the beginning of August (day 213).
Figure 2. Comparison of seasonal trends in daily precipitation, mean daily air temperature (a) and relative soil moisture content at
30 cm depth (b).
Table III. Results of the statistical tests used to detect signifi-
cant differences between time of the season (results differ from
species to species), species and individuals regarding the data
for Ψpd and Ψm.
Predawn water Minimum water
potential (Ψpd) potential (Ψm)
Time of season*
L. decidua p < 0.001 p < 0.001
P. abies p = ns p < 0.01
P. cembra p = ns p = ns
Species* p< 0.0001 p< 0.0001
Individuals#p = ns p = ns
* Kruskal-Wallis test, #Wilcoxon test.


%20--%3e%3cdefs%3e%3cstyle%3e%20.st0%20{%20fill:%20%23fff;%20}%20.st1%20{%20fill:%20%237800fa;%20}%20%3c/style%3e%3c/defs%3e%3cpath%20class='st1'%20d='M117.78,12.18H43.11c2.9,3.47,4.65,7.94,4.65,12.82,0,5.6-2.3,10.66-6.01,14.29h76.02l7.22-13.56-7.22-13.56Z'/%3e%3cg%3e%3cpath%20class='st0'%20d='M53.58,26.17h-.59v-1.46h.59v-4.96h2.83c1.78,0,2.67.94,2.67,2.82v5.76c0,1.87-.89,2.81-2.67,2.81h-2.83v-4.96ZM55.36,21.37v3.34h1.1v1.46h-1.1v3.34h1.01c.61,0,.91-.37.91-1.1v-5.93c0-.74-.3-1.1-.91-1.1h-1.01Z'/%3e%3cpath%20class='st0'%20d='M65.99,31.14h-1.8l-.31-2.07h-2.19l-.31,2.07h-1.64l1.82-11.39h2.62l1.82,11.39ZM65.28,18.04c-.25.46-.51.77-.75.94-.21.15-.47.22-.79.22-.26,0-.57-.07-.92-.22l-.38-.15c-.14-.05-.26-.07-.37-.07-.3,0-.53.18-.71.54l-.91-.68c.25-.46.51-.77.75-.94.21-.14.48-.21.79-.21.26,0,.57.07.92.21l.38.15c.14.05.26.07.37.07.3,0,.53-.18.71-.54l.91.68ZM61.91,27.52h1.73l-.87-5.76-.87,5.76Z'/%3e%3cpath%20class='st0'%20d='M74.53,26.89v1.52c0,1.91-.89,2.86-2.67,2.86s-2.67-.95-2.67-2.86v-5.93c0-1.91.89-2.86,2.67-2.86s2.67.95,2.67,2.86v1.11h-1.69v-1.22c0-.75-.31-1.12-.93-1.12s-.93.37-.93,1.12v6.15c0,.74.31,1.11.93,1.11s.93-.37.93-1.11v-1.63h1.69Z'/%3e%3cpath%20class='st0'%20d='M81.4,31.14h-1.8l-.31-2.07h-2.19l-.31,2.07h-1.64l1.82-11.39h2.62l1.82,11.39ZM75.9,19.2l1.52-1.91h1.71l1.51,1.91h-1.61l-.76-.95-.75.95h-1.61ZM77.32,27.52h1.73l-.87-5.76-.87,5.76ZM83.1,15.99l-1.76,1.91h-1.26l1.17-1.91h1.86Z'/%3e%3cpath%20class='st0'%20d='M84.86,19.75c1.78,0,2.67.94,2.67,2.82v1.48c0,1.87-.89,2.81-2.67,2.81h-.85v4.28h-1.79v-11.39h2.64ZM84.01,21.37v3.86h.85c.58,0,.87-.36.87-1.08v-1.71c0-.71-.29-1.07-.87-1.07h-.85Z'/%3e%3cpath%20class='st0'%20d='M93.51,19.75c1.78,0,2.67.94,2.67,2.82v1.48c0,1.87-.89,2.81-2.67,2.81h-.85v4.28h-1.79v-11.39h2.64ZM92.66,21.37v3.86h.85c.58,0,.87-.36.87-1.08v-1.71c0-.71-.29-1.07-.87-1.07h-.85Z'/%3e%3cpath%20class='st0'%20d='M98.8,31.14h-1.79v-11.39h1.79v4.88h2.03v-4.88h1.83v11.39h-1.83v-4.88h-2.03v4.88Z'/%3e%3cpath%20class='st0'%20d='M105.36,24.55h2.46v1.62h-2.46v3.34h3.09v1.63h-4.88v-11.39h4.88v1.63h-3.09v3.18ZM108.17,17.29l-1.76,1.91h-1.26l1.17-1.91h1.86Z'/%3e%3cpath%20class='st0'%20d='M112.2,19.75c1.78,0,2.67.94,2.67,2.82v1.48c0,1.87-.89,2.81-2.67,2.81h-.85v4.28h-1.79v-11.39h2.64ZM111.35,21.37v3.86h.85c.58,0,.87-.36.87-1.08v-1.71c0-.71-.29-1.07-.87-1.07h-.85Z'/%3e%3c/g%3e%3ccircle%20class='st1'%20cx='25'%20cy='25'%20r='20'/%3e%3cpath%20class='st0'%20d='M32.78,19.27c2.92,0,4.43,2.55,5.28,5.33l.71,2.17c.14.38-.33.75-.71.75h-5.61c.19-.33.24-.71.09-1.08l-.75-2.45c-.43-1.32-.99-2.64-1.79-3.77.75-.57,1.65-.94,2.78-.94h0ZM25,18.38c3.25,0,4.9,2.78,5.89,5.89l.76,2.45c.14.42-.33.8-.8.8h-11.69c-.42,0-.94-.38-.8-.8l.75-2.45c.99-3.11,2.64-5.89,5.89-5.89h0ZM25,11.35c1.74,0,3.11,1.37,3.11,3.11s-1.37,3.11-3.11,3.11-3.11-1.41-3.11-3.11,1.41-3.11,3.11-3.11h0ZM17.27,19.27c1.08,0,1.98.38,2.73.94-.8,1.13-1.37,2.45-1.74,3.77l-.8,2.45c-.14.38-.05.75.09,1.08h-5.56c-.42,0-.9-.38-.75-.75l.71-2.17c.9-2.78,2.41-5.33,5.33-5.33h0ZM17.27,12.91c1.51,0,2.78,1.27,2.78,2.83s-1.27,2.83-2.78,2.83-2.83-1.27-2.83-2.83,1.27-2.83,2.83-2.83h0ZM32.78,12.91c1.56,0,2.78,1.27,2.78,2.83s-1.23,2.83-2.78,2.83-2.83-1.27-2.83-2.83,1.27-2.83,2.83-2.83h0ZM27.07,28.56v.09c0,.57-.24,1.08-.61,1.46h0v.05c-.38.33-.9.57-1.46.57s-1.08-.24-1.46-.61h0c-.38-.38-.61-.9-.61-1.46v-.09h1.41v.09c0,.19.05.38.19.47v.05c.09.09.28.19.47.19s.38-.09.47-.19v-.05c.14-.09.24-.28.24-.47t-.05-.09h1.41ZM30.99,28.56v.09c0,1.65-.66,3.16-1.74,4.24-1.08,1.08-2.59,1.79-4.24,1.79s-3.16-.71-4.24-1.79l-.05-.05c-1.04-1.08-1.7-2.55-1.7-4.2v-.09h1.41v.09c0,1.27.47,2.4,1.27,3.25h.05c.85.85,1.98,1.37,3.25,1.37s2.4-.52,3.25-1.37c.85-.8,1.37-1.98,1.37-3.25v-.09h1.37ZM34.99,28.56v.09c0,2.78-1.13,5.28-2.92,7.07-1.79,1.79-4.29,2.92-7.07,2.92s-5.23-1.13-7.07-2.92c-1.79-1.79-2.92-4.29-2.92-7.07v-.09h1.41v.09c0,2.4.94,4.53,2.5,6.08,1.56,1.56,3.72,2.5,6.08,2.5s4.52-.94,6.08-2.5c1.56-1.56,2.5-3.68,2.5-6.08v-.09h1.41Z'/%3e%3c/svg%3e)