BioMed Central
BMC Plant Biology
Open Access
Research article Two alternative recessive quantitative trait loci influence resistance to spring black stem and leaf spot in Medicago truncatula Lars G Kamphuis1, Judith Lichtenzveig1,2, Richard P Oliver1 and Simon R Ellwood*1
Address: 1Australian Centre for Necrotrophic Fungal Pathogens, State Agricultural Biotechnology Centre, Murdoch University, Perth 6150, Western Australia, Australia and 2Commonwealth Scientific and Industrial Research Organisation, Plant Industry, Private Bag No. 5, Wembley 6913, Western Australia, Australia
Email: Lars G Kamphuis - Lars.Kamphuis@csiro.au; Judith Lichtenzveig - j.lichtenzveig@murdoch.edu.au; Richard P Oliver - R.Oliver@murdoch.edu.au; Simon R Ellwood* - S.Ellwood@murdoch.edu.au * Corresponding author
Published: 26 March 2008
Received: 11 December 2007 Accepted: 26 March 2008
BMC Plant Biology 2008, 8:30
doi:10.1186/1471-2229-8-30
This article is available from: http://www.biomedcentral.com/1471-2229/8/30
© 2008 Kamphuis et al; licensee BioMed Central Ltd. This is an Open Access article distributed under the terms of the Creative Commons Attribution License (http://creativecommons.org/licenses/by/2.0), which permits unrestricted use, distribution, and reproduction in any medium, provided the original work is properly cited.
Abstract Background: Knowledge of the genetic basis of plant resistance to necrotrophic pathogens is incomplete and has been characterised in relatively few pathosystems. In this study, the cytology and genetics of resistance to spring black stem and leaf spot caused by Phoma medicaginis, an economically important necrotrophic pathogen of Medicago spp., was examined in the model legume M. truncatula.
Results: Macroscopically, the resistant response of accession SA27063 was characterised by small, hypersensitive-like spots following inoculation while the susceptible interaction with accessions A17 and SA3054 showed necrotic lesions and spreading chlorosis. No unique cytological differences were observed during early infection (<48 h) between the resistant and susceptible genotypes, except pathogen growth was restricted to one or a few host cells in SA27063. In both interactions reactive oxygen intermediates and phenolic compounds were produced, and cell death occurred. Two F2 populations segregating for resistance to spring black stem and leaf spot were established between SA27063 and the two susceptible accessions, A17 and SA3054. The cross between SA27063 and A17 represented a wider cross than between SA27063 and SA3054, as evidenced by higher genetic polymorphism, reduced fertility and aberrant phenotypes of F2 progeny. In the SA27063 × A17 F2 population a highly significant quantitative trait locus (QTL, LOD = 7.37; P < 0.00001) named resistance to the necrotroph Phoma medicaginis one (rnpm1) genetically mapped to the top arm of linkage group 4 (LG4). rnpm1 explained 33.6% of the phenotypic variance in the population's response to infection depicted on a 1–5 scale and was tightly linked to marker AW256637. A second highly significant QTL (LOD = 6.77; P < 0.00001), rnpm2, was located on the lower arm of LG8 in the SA27063 × SA3054 map. rnpm2 explained 29.6% of the phenotypic variance and was fine mapped to a 0.8 cM interval between markers h2_16a6a and h2_21h11d. rnpm1 is tightly linked to a cluster of Toll/Interleukin1 receptor-nucleotide binding site-leucine-rich repeat (TIR- NBS-LRR) genes and disease resistance protein-like genes, while no resistance gene analogues (RGAs) are apparent in the genomic sequence of the reference accession A17 at the rnpm2 locus.
Conclusion: The induction of defence responses and cell death in the susceptible interaction following infection by P. medicaginis suggested this pathogen is not negatively affected by these responses and may promote them. A QTL for resistance was revealed in each of two populations derived from crosses between a resistant accession and two different susceptible accessions. Both loci are recessive in nature, and the simplest explanation for the existence of two separate QTLs is the occurrence of host genotype-specific susceptibility loci that may interact with undetermined P. medicaginis virulence factors.
Page 1 of 12 (page number not for citation purposes)
BMC Plant Biology 2008, 8:30
http://www.biomedcentral.com/1471-2229/8/30
trophs and thus is increasingly being used to study resist- ance to species such as Aphanomyces euteiches [13,14], Ascochyta lentis, Botrytis cinerea and B. fabae [15], Colletotri- chum trifolii [16], Mycosphaerella pinodes [17], Phoma medi- caginis [18], and Phytophthora medicaginis [19].
Background Phoma medicaginis is the causal agent of spring black stem and leaf spot in alfalfa (Medicago sativa), a major fodder and forage crop in temperate and Mediterranean regions. Studies in four north-eastern US states have shown foliar necrotrophs, principally P. medicaginis, resulted in esti- mated average yield losses of over 13%. For harvests where significant yield losses occurred, this figure rose to over 19% [1].
study we describe
[18].
this
In
P. medicaginis also causes disease on the model legume Medicago truncatula, or barrel medic, which is used in Aus- tralia in ley rotations to enhance soil nitrogen [2]. In sus- ceptible cultivars, reduction in seed and herbage yields, and almost complete defoliation and premature death has been reported [3,4], with infected cultivars exhibiting an average seed weight reduction of 37.3% [5]. Chemical and cultural control of foliar necrotrophs like P. medicaginis has proved to be expensive and inefficient [1], and there- fore new resistant cultivars or more efficient antifungal control agents are required.
Sources of resistance to P. medicaginis have been previ- ously identified among different Medicago spp. [20], and in the genetically diverse South Australian Research and Development Institute (SARDI) M. truncatula core collec- tion [21]. Single-seeded SARDI core collection M. truncat- ula accessions were screened for resistance to three virulent Western Australian P. medicaginis isolates, and accession SA27063 was shown to be resistant to P. medi- caginis OMT5, whereas A17 and SA3054 were highly sus- ceptible the characterisation of the disease response in these acces- sions macroscopically and cytologically. The genetic basis of resistance to P. medicaginis in M. truncatula is deter- mined together with genetic map positions for major loci conferring resistance in two different mapping popula- tions.
Since the early 1990s, resistance genes (R genes) against various pathogens and pests have been isolated from important crop species such as barley, tomato and rice [reviewed in Hammond-Kosack et al. [6]], although most of the R genes known today were isolated from model plant Arabidopsis. These tend to represent qualitative dominant resistance associated with simple Mendelian genetics. In fungal pathosystems, such genes confer resist- ance to biotrophs and hemi-biotrophs. Resistance to necrotrophic fungal pathogens, by contrast, is often quan- titative. Not surprisingly, the genetic basis of resistance is poorly understood and relatively few resistance genes have been characterised. Those that have been reported involve specific interactions with host selective toxins (HSTs, reviewed in Wolpert et al. [7]) and are predomi- nantly recessive in nature (i.e. susceptibility is dominant) presumably by loss or alteration of gene(s) encoding HST targets. There is evidence to suggest a HST may promote a hypersensitive-like response by acting through a resist- ance gene leading to cell death [8,9]. By contrast, of the two necrotrophic resistance genes isolated to date, the race-specific Hm1 detoxifying gene in maize [10] is domi- nant and the Asc-1 longevity assurance gene homolog in tomato [11,12] is semi-dominant.
Results Macroscopic phenotype of resistant and susceptible accessions Medicago truncatula SARDI core collection accessions were previously screened for their response to three P. medicag- inis isolates. Accession SA27063 was resistant to P. medi- caginis OMT5, whereas A17 and SA3054 were susceptible [18]. When leaves of three-week-old SA27063 plants were spot inoculated, the fungus was limited to the inoculation site and no chlorosis or necrosis was observed 7–10 days post infection (dpi, Figure 1a). In susceptible interactions the fungus successfully penetrated host cells and spread beyond the inoculation site, accompanied by a halo of chlorosis ahead of the infection zone. By 7–10 dpi infected leaves were entirely chlorotic or necrotic and pyc- nidia were apparent (Figure 1b, e). Similar symptoms were observed following spray inoculation: small, micro- scopic hypersensitive response-like lesions and no chloro- sis of leaves occurred in resistant SA27063 (10 dpi; Figure 1c); in the susceptible interactions disease symptoms were visible to the naked eye at 7 dpi. P. medicaginis colonised the surrounding plant tissue, resulting in macroscopic necrotic spots on both leaves and stems surrounded by spreading chlorosis (10 dpi; Figure 1d). As early as 10 dpi P. medicaginis produced pycnidia on susceptible leaves.
Microscopic disease symptoms of P. medicaginis OMT5 Histological staining using trypan blue or DiOC6 was per- formed to examine differences in the infection process between resistant and susceptible accessions at the cellular level (Figures 2a–e). Following inoculation, P. medicaginis spores germinated on the leaf surface and successful pen-
The genetic tools to clone and characterize R genes are not available in most legumes, making it difficult to study the molecular basis of resistance to diseases. Medicago trunca- tula, a close relative of alfalfa, is a model system and pos- sesses a small diploid genome that is currently being sequenced, autogamous genetics and various transforma- tion systems. The significance of M. truncatula lies in its susceptibility to a range of hemi-biotrophs and necro-
Page 2 of 12 (page number not for citation purposes)
BMC Plant Biology 2008, 8:30
http://www.biomedcentral.com/1471-2229/8/30
A
B
C
D
E E
500 M
M
M
Macroscopic disease symptoms of P. medicaginis OMT5 Figure 1 Macroscopic disease symptoms of P. medicaginis OMT5. A, SA27063 spot inoculated 10 days post inoculation (dpi). B, SA3054 spot inoculated 10 dpi. C, SA27063 spray inoculated 7 dpi. D, SA3054 spay inoculated 7 dpi. E, Pycnidium of P. medi- caginis on A17 leaf 14 dpi. M indicates mock inoculated leaflets.
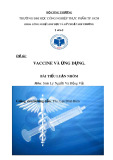
aberrant F2 individuals (Table 1). In the SA27063 × SA3054 cross, F3 families (number of individuals per fam- ily ≥ 16) were phenotyped to confirm individual F2 phe- notypes. When the same F3 families were inoculated between different experiments, mean disease scores did not alter significantly showing the phenotyping method was reliable and reproducible. The proportions of SA27063 × SA3054 F3 families distributed against the mean disease score (Figure 3a) was significantly different from a normal distribution (PW < 0.0001). The relation- ship between the families' means and the variance within each family is depicted in Figure 3b. This relationship was evaluated using the Fain's test which predicts a pattern of maximum variability in intermediate families whenever at least one locus with major effect is involved [24,25]. Analysis of the F3 family disease scores using Fain's test revealed that the quadratic term was highly significant (P/ t/ = 0.0027; Figure 3b), indicating one or a few loci with major effects were involved in resistance to P. medicaginis.
etration of host cells was observed as early as 6 hours post inoculation (hpi). In both interactions, penetration attempts occurred by three routes; directly through sto- mata followed by penetration of the underlying meso- phyll cells (Figure 2a), directly through the epidermal cells (Figure 2c), or between epidermal cells (Figure 2d). Following penetration, fungal colonisation proceeded rapidly in the susceptible accessions SA3054 and A17, whereas in the resistant accession SA27063 hyphal devel- opment was limited to individual or a few epidermal cells. Reddish-brown diaminobenzidine-tetrahydrochloride (DAB) staining to detect endogenous H2O2 production in cells at or around the site of penetration was observed in accession SA27063 (Figure 2b, c). However, H2O2 was inconsistently associated with penetration attempts and was also evident in susceptible accessions. Autofluores- cence was also observed around the site of infection in both the susceptible and resistant interaction, indicating the production of phenolics (Figure 2d, e).
Genetic linkage mapping Genetic maps for the SA27063 × SA3054 and SA27063 × A17 mapping populations were created using both gene- based and microsatellite markers. Markers were initially selected to be evenly distributed over each linkage group and were obtained from several published sources [26- 30]. A total of 115 markers were characterised for the SA27063 × SA3054 (n = 94) and 78 for SA27063 × A17 (n = 92) populations.
Resistance of accession SA27063 to Phoma medicaginis OMT5 in two different mapping populations Accession SA27063 was crossed with susceptible acces- sions A17 and SA3054 to create two F2 mapping popula- tions. F1 individuals of both crosses showed P. medicaginis OMT5 disease symptoms equivalent to the susceptible parents, indicating recessive resistance. F2 individuals were screened for their disease phenotype in both the SA27063 × A17 (n = 92) and SA27063 × SA3054 (n = 94) populations. Both populations differed significantly from a normal distribution (PW < 0.0001; based on the Shapiro and Wilk test [22], which tests the null-hypothesis that a given sample derives from a normally distributed popula- tion).
The SA27063 × A17 population was not chosen for further genetic studies due to poor fertility, the presence of a reciprocal translocation between chromosomes four and eight in accession A17 [23], and a large proportion of
Forty-six and 58 markers for SA27063 × SA3054 and SA27063 × A17 respectively were single nucleotide poly- morphisms (SNPs). The majority of these SNPs were con- verted to cleaved amplified polymorphic sequences [CAPS, [31]]. SNPs that could not be assayed as CAPS were genotyped using SNapShot (AB) single fluorescent nucleotide extension. A total 53% of markers were poly- morphic between SA27063 and A17 and 35% between SA27063 and SA3054. Marker polymorphism data,
Page 3 of 12 (page number not for citation purposes)
BMC Plant Biology 2008, 8:30
http://www.biomedcentral.com/1471-2229/8/30
ifh
ifh
H2O2
H2O2
p
st
20 M
100 M
20 M
A
B
C
p
sp
sp
sp
ifh
p
p
100 M
100 M
E
D
Figure 2 Microscopic analysis of P. medicaginis infection of M. truncatula Microscopic analysis of P. medicaginis infection of M. truncatula. Leaves were spot inoculated with P. medicaginis OMT5 and hyphae visualised with trypan blue (A-C) or DiOC6 (D, E) at 24 and 48 h post infection. (A) P. medicaginis entering a sto- mata of SA3054. (B, C) build-up of H2O2 around the sites of penetration in SA27063. (D, E) Autofluorescence of phenolic compounds around the infection site in both SA27063 (D) and SA3054 (E). H2O2 = hydrogen peroxide; ifh = infection hyphae; p = point of penetration; sp = spore; st = stomata.
primer sequences, and references for SA27063 × SA3054 and for SA27063 × A17 markers have been provided [see Additional files 1 and 2].
expected, the SA27063 × SA3054 map was composed of eight linkage groups, in accordance with the basic number of chromosomes in M. truncatula (x = 8). The map spans a total of 488.3 centimorgans (cM) with an average dis- tance between markers of 4.2 cM. Very few published
The genetic maps for SA27063 × A17 and SA27063 × SA3054 are shown in Figures 4 and 5, respectively. As
Table 1: Fertility of F2 progeny from crosses between A17 and SA27063, and SA3054 and SA27063. Figures are percentages except the average number of seeds per pod, based on 15 randomly selected pods.
A17 × SA27063 n = 200
3054 × SA27063 n = 200
Pollen viability1 Av. No seeds/pod Albinos Abnormal radicals Delayed germination2 Dwarves
47 3.3 6.2 11.8 4.9 19.3
100 8.3 0 0 0 0
1Pollen viability was determined by using Alexanders stain as described in Kamphuis et al. [23]. 2Delayed germination indicates development at two weeks was equivalent to 48 hrs in a normal seedling.
Page 4 of 12 (page number not for citation purposes)
BMC Plant Biology 2008, 8:30
http://www.biomedcentral.com/1471-2229/8/30
A
P
s e
15
i l i
0.15
10
m a f 3 F
0.10
r o p o r t i o n o f
therefore split into two small linkage groups named LG7a and LG7b. The SA27063 × A17 genetic map spans a total of 497.8 cM with an average distance between markers of 6.4 cM. The linkage groups of the genetic maps presented here are similar in length to previously published maps [29,30] with the exception of LG3. In SA27063 × SA3054 the distance between DK501R and CysPR1 was 50.9 cM, whereas in SA27063 × A17 this distance was 79.6 cM.
5
0.05
F 3 f a m
i l i
f o r e b m u N
e s
1.0 1.5 2.0 2.5 3.0 3.5 4.0 4.5 5.0 1.0 1.5 2.0 2.5 3.0 3.5 4.0 4.5 5.0
Mean Disease Score
B
0.35
Vi = 0.088 + 0.050 Mi – 0.043 (Mi – 2.45)2 P/t/ = 0.0027
0.30
0.25
0.20
i
) e r o c S e s a e s D
0.15
( r r
0.10
E d t S
0.05
2.5
4.0
4.5
5.0
1.0
1.5
2.0
3.0
3.5
F3 Family Mean (Disease Score)
QTL mapping of spring black stem and leaf spot resistance in M. truncatula Two major quantitative trait loci (QTLs) for resistance to P. medicaginis OMT5 were identified, one in each mapping population. In SA27063 × A17, the effect of the QTL (d = 1.4) was significantly different from zero (P < 0.00001; LOD = 7.37). The locus was named resistance to the necrotroph Phoma medicaginis one (rnpm1) and was located on LG4 (Figure 4), tightly linked to AW256637. rnpm1 explains 33.6% of the phenotypic variance in the population's response to infection by P. medicaginis OMT5, based on a 1–5 scale [18]. In SA27063 × SA3054, the QTL effect (d = 1.46) was significantly different from zero (P < 0.00001; LOD = 6.77). This locus was named resistance to the necrotroph Phoma medicaginis two (rnpm2) and was located on LG8 (Figure 5), tightly linked to MtB262. rnpm2 explains 29.6% of the phenotypic vari- ance. In SA27063 × SA3054, a second QTL, rnpm3 was located on linkage group one. This locus is statistically less significant (P = 0.04; LOD = 3.37), has a smaller effect (d = 1.1), and explains 19.4% of the total phenotypic vari- ance.
Figure 3 infection Response of SA27063 × SA3054 F3 families to P. medicaginis Response of SA27063 × SA3054 F3 families to P. med- icaginis infection. (A) Frequency distribution of disease scores for F3 families of cross SA27063 × SA3054 infected with P. medicaginis OMT5 at 7 dpi. (B) Variance within a F3 family (Vi) as a quadratic function of its mean response (Mi); (P/t/) probability testing the null-hypothesis the quadratic term (0.043) is significantly different from zero.
markers were polymorphic between SA27063 and SA3054 on the lower half of linkage group 2.
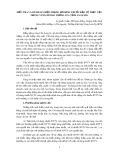
Fine mapping rnpm2 To initiate fine mapping of rnpm2 on the long arm of chromosome eight, an additional 434 F2 individuals (524 in total) were screened for recombination within a 8.2 cM interval between markers MtB294, MtB174 and MtB139 (Figure 5). F3 families from the selected recombinant F2 individuals were phenotypically characterised. As men- tioned above, locus rnpm2 explains 29.6% of the total var- iance in the population's response to the fungal infection when measured in a 1–5 scale. However, recombinant families that showed the SA27063-like (resistant) pheno- type correlated with homozygous SA27063 alleles at rnpm2 in 78.5% of instances. The resistant parent consist- ently showed little or no visible necrotic symptoms, while disease progression in the susceptible parent was variable and ranged from 2.5 – 4.5. The variance in disease scores was therefore partly a function of the continuum of mean quantitative susceptible disease scores and the sum of dis- ease scores in heterozygous F3 families. Recombination break point analysis was therefore used to fine map rnpm2, with phenotyping data from thirty-eight informa- tive F3 families in conjunction with further polymorphic markers to resolve recombination break points. The loca-
In contrast to the SA27063 × SA3054 map, the SA27063 × A17 map was organized into seven linkage groups, with LG4 and LG8 forming a single linkage group (Figure 4). These linkage groups have previously been reported as single linkage groups [29,30,32]. The establishment of new linkage relationships between LG4 and LG8 com- bined with observations of semisterility in hybrids involv- ing A17 provides strong evidence that A17 bears a reciprocal translocation, which differentiates it from other M. truncatula accessions. This reciprocal translocation involves the lower arm of chromosome 4 and the lower arm of chromosome 8 [23]. All publicly available markers in the middle of LG7 were monomorphic and LG7 was
Page 5 of 12 (page number not for citation purposes)
BMC Plant Biology 2008, 8:30
http://www.biomedcentral.com/1471-2229/8/30
LG1
LG2
LG3
LG4/8
LG5
LG6
LG7
a
ENOD8
PFK
DK501R
CrS
0.0
0.0
0.0
0.0
MAA660538 UNK7
0.0 1.7
DK258L
10.1
r n p m 1
MDH2
16.0
DK225L UDPGD PGDH DK322L
0.0 0.6 6.4 13.9
48N18L 36N1L
15.3 18.9
SAMS
21.8
MA660456 MTIC33 TE016 AW256637 EPS MtB99 TE011 MtB344
0.0 4.1 7.0 8.6 9.2 9.8 16.1
DK009R ENOD40 DK242R
11.6 18.8 26.2
MtB169
27.2
DK132L
33.2
ACL
33.7
Ms/U131 DK381L
35.1 36.7
b
MtU04
39.1
DK417L
41.2
EST763 MTR58
39.3 41.6
DK293R
43.6
PROF DK321L
46.4 47.0
DK024R UNK27
47.6 51.2
TUP
53.8
FAL
59.1
TE001
59.5
SAT
61.4
MTSA5 DK287R CAK ENOL
0.0 2.9 6.4 11.7
DK045R
65.6
41O18L MTIC297 CP450
61.4 68.1 71.6
MTSA6 DK006R
75.5 77.2
SDP1
GLNA DK473L EST400 NPAC DK313L CysPr1
84.1
61.4 70.7 74.0 75.1 76.8 79.6
DK505R
92.9
CNCG4 Ms/U336
106.0 110.6
AW257033
128.9
Genetic map of M. truncatula constructed using accessions SA27063 and A17, based on 92 F2 individuals Figure 4 Genetic map of M. truncatula constructed using accessions SA27063 and A17, based on 92 F2 individuals. The genetic map comprises 78 markers and spans 497.8 cM. Horizontal lines show marker positions. Horizontal lines show marker positions and marker names are located to the right. Genetic distances (cM) are located to the left of each marker. The genomic location of the QTL rnpm1 for P. medicaginis resistance is depicted to the right of LG4, with the standard deviation of its location depicted by lines either side.
tion of rnpm2 was mapped to a 0.8 cM interval between markers h2_16a6a and h2_21h11d (Figure 6).
quent cell death to facilitate subsequent infection [36]. Examination of inoculated leaf tissue also showed accu- mulation of autofluorescent phenolic compounds around the infection site in both resistant and susceptible interac- tions. Phenolic compounds, such as flavonoids and iso- flavonoids, are an important aspect in legume plant defence [37], and there is ample evidence for their accu- mulation in response to fungal pathogens in Medicago species [38-42]. Pilot transcriptional profiling at 12 hpi using the Mt16kOLI1plus microarray [43] showed signif- icant changes in induced genes related to oxidative burst, cell wall strengthening, lipid metabolism, and the phenyl- propanoid pathway leading to isoflavonoid production (L. Kamphuis, unpublished data). However, similar levels of induction occurred in both the resistant and susceptible interactions. Cytological similarities reported here are supported in oats, where cell death and induction of defence-related responses were observed in response to the HST victorin in sensitive genotypes (reviewed by Sweat et al., 2007 [9]), and in barley where a susceptible- specific second ROS burst was observed in the later stages of the infection [44]. Detailed expression and metabolic profiling may help to identify differences in the HR response and the abundance and composition of defence- related compounds and their role in restricting P. medicag- inis colonisation.
Discussion and Conclusions The main purpose of this research was to examine differ- ences in disease phenotypes and the genetic basis of resist- ance to P. medicaginis in M. truncatula. The resistant phenotype was characterized macroscopically by the pres- ence of small hypersensitive response-like spots, whereas susceptible accessions showed typical stem and leaf lesions, within which pycnidia, or fruiting bodies, formed. In the resistant accession SA27063 pycnidia were not apparent, or where present they developed following a delay of 2–3 weeks, predominantly on senescing leaves. Microscopically, no differences were observed in penetra- tion attempts between resistant and susceptible acces- sions, and no obvious changes uniquely associated with resistance were evident with the exception of fungal growth being restricted to one or a few plant cells. Produc- tion of H2O2 was observed in resistant SA27063-infected leaves but was also detectable in susceptible SA3054 and A17. H2O2 has been reported to play an important role in resistance involving a hypersensitive response [33,34]. Build up of reactive oxygen species (ROS) is generally observed following penetration by fungi with a hemibio- trophic or biotrophic lifestyle [16,35] and subsequently leads to resistance against such fungi, while necrotrophic pathogens may stimulate ROS production and subse-
Page 6 of 12 (page number not for citation purposes)
BMC Plant Biology 2008, 8:30
http://www.biomedcentral.com/1471-2229/8/30
LG1
LG2
LG3
LG4
LG5
LG6
LG7
LG8
r n p m 3
0.0 0.0 DK501R OXG 0.0 0.0 MtB157 MTIC43 0.0 1.8 MTR52 FENR MAA660538 0.0 0.6 1.8 MtB213 PGDH UDPGD 0.0 2.3 4.0 CrS 6.2 ENOD8 7.4 DK322L 8.0 MA660456 MTIC33 AW256637 TC90233 EPS UNK16 4.5 5.6 7.4 8.0 MTIC19 MtB26 MTIC354 ACCO MTIC74 MTIC361 MTIC452 0.5 2.3 4.0 4.5 8.4 AW257033 GLUT MtB293 MtB247 Ms/U141 MDK455L 0.0 2.4 4.1 7.6 8.8 10.0 MtB220 DK258L 10.2 11.9 DK242R 13.8 MtB61 14.3 36N1L h2_8a13a 14.5 14.6 48N18L MTIC236 MDH2 17.4 15.4 17.5 QORlik MtB344 17.4 18.5 DK505R NTRB1 20.7 21.3 SDP1 25.3
r n p m 2
h2_15m24a MtB59 28.4 30.6 MtB32 31.1 MTIC235 31.7 h2_87i13a 32.5 DK419R DK417L 33.7 34.3 h2_77p14a 36.0 MTIC51 38.8 39.6 MTIC153 MTIC82 39.1 41.8 DK379L DK381L MTIC249 42.3 47.4 MTIC238 46.6 MtB290 47.8 46.7 49.0 54.3 MtB276 48.6 h2_8c19d 50.8 MTIC243 MTSA5 VR MtB55 48.0 50.8 58.1 DK473L MtB118 MtB172 DK313L CysPr1 45.9 47.0 48.2 49.8 50.9 55.6 MTIC48 FAL 53.1 53.7 56.1 TE001 MTIC14 MTIC268 59.7 61.9 MtB4 59.2 CDC2 MtB160 h2_33j22 MtB286 ATP2 52.5 54.8 57.0 57.6 58.8 CAK ENOL MtB124 57.0 59.1 60.2 62.5 50.9 56.6 57.7 58.8 60.9 62.0 63.6 64.1 CA4H MtB96 PTSB MTIC58 58.2 59.9 61.6 64.4 MtB193 64.6 64.7 REP PAE MtB294 MtB217 h2_24j8b MtB3 MtB174 MtB262 MtB139 h2_9d1a MtB295 EIF5A 64.1 DK024R MtB43 MtB223 SQEX MTIC279 MTIC65 MTIC297 BiPA MtB248 41O18L MTSA6 68.9
Genetic map of M. truncatula constructed using accessions SA27063 and SA3054, based on 94 F2 individuals Figure 5 Genetic map of M. truncatula constructed using accessions SA27063 and SA3054, based on 94 F2 individuals. The genetic map comprises 115 markers and spans 488.3 cM. Horizontal lines show marker positions and marker names are located to the right. Genetic distances (cM) are located to the left of each marker. The genomic locations of QTLs rnpm2 and rnpm3 for P. medicaginis resistance are depicted the right of LG8 and LG1 respectively, with standard deviations depicted by lines either side.
The lower proportion of polymorphic makers in the SA27063 × SA3054 cross suggested this is a narrower cross than SA27063 × A17. The total map length for SA27063 × SA3054 (488.3 cM) was smaller than previously reported genetic maps [29,30,32] and in the SA27063 × A17 map. The genetic distance between markers DK501R and CysPR1 on LG3 in particular was notably smaller than in the SA27063 × A17 map. LG3 corresponds with chromo- some three, the largest chromosome of M. truncatula [45]. One explanation for this phenomenon could be that accessions SA27063 and SA3054 are sympatric [21], and may share long stretches of homology in chromosome three, resulting in a lack of detectable recombination.
explained a relatively small amount of the total calculated variance for resistance (29.6%), SA27063-like or resistant individuals in the F2 mapping population correlated with individuals homozygous for SA27063 alleles at rnpm2 in approx. 80% of instances. Among the F3 families used in fine mapping and predicted to be resistant by their geno- type, this proportion remained constant, allowing rnpm2 to be mapped to a 0.8 cM interval between markers h2_16a6a and h2_21h11d by recombination break point analysis. The proportion of resistant homozygous SA27063 rnpm2 individuals suggested rnpm2 is epistatic to one or several cis- or trans-acting genes or regulatory ele- ments, possibly locus rnpm3 on LG1. As the detection and accuracy of minor QTLs in segregating populations largely depends on map quality and population size, increasing the initial mapping population size or genome-wide anal- ysis of expressed QTLs [47] may reveal other minor QTLs and will enable thorough examination of the interaction between rnpm2 and rnpm3.
We did not proceed with fine mapping rnpm1 in the SA27063 × A17 cross, due to poor fertility and a large pro- portion of aberrant phenotypes among the F2 progeny (Table 1), which may cause biased representation of par- ticular gamete genotypes. Furthermore, accession A17
Quantitative trait loci (QTL) analysis is often used to iden- tify and characterise loci conferring resistance. QTL map- ping allows the roles of specific R-loci to be described, race-specificity of partial resistance genes can be assessed, and interactions between resistance genes, plant develop- ment and the environment to be analysed [46]. QTL anal- ysis for P. medicaginis resistance in the SA27063 × A17 mapping population revealed a QTL on chromosome four (rnpm1) and in the SA27063 × SA3054 population a QTL on chromosome eight (rnpm2), both recessive in nature. As explained in the results, although the rnpm2 QTL
Page 7 of 12 (page number not for citation purposes)
BMC Plant Biology 2008, 8:30
http://www.biomedcentral.com/1471-2229/8/30
MtB217
1.0
map produced in M. truncatula not involving A17 as a parental line and is therefore useful in identifying the cor- rect position of ambiguously placed markers in A17- derived genetic maps. The reciprocal translocation involves markers distal to rnpm2 at approximately 30 cM or less and is therefore unlikely to affect the detection of this QTL among SA27063 × A17 progeny.
h2_24j8b
1.3
MtB174 h2_22g24a
0.2 0.3
h2_16a6a
0.4
h2_28c12a
r n p m 2
0.4
The simplest explanation for the existence of two separate QTLs among progeny in two crosses involving the same resistant parent is that genotype-specific susceptibility loci may interact with undetermined P. medicaginis OMT5 vir- ulence factors or HSTs. The rnpm1 locus is tightly linked to marker AW256637 on BAC AC144658, which is in a con- tig containing a cluster of TIR-NBS-LRR and disease resist- ance protein-like genes [48], while no RGAs are apparent in the genomic sequence of the reference accession A17 at the rnpm2 locus. The recessive host genotype-specific nature of rnpm1 and rnpm2 bears similarities to the race- specific Pyrenophora tritici-repentis toxin insensitivity QTLs in wheat [49], where multiple, isolate-specific HSTs inter- act with a given host genotype to produce a susceptible phenotype. To date, no P. medicaginis phytotoxins have been characterised in vivo during infection. However, the presence of chlorotic symptoms in susceptible M. truncat- ula accessions inoculated with P. medicaginis in advance of the fungal hyphae, and the large number of toxins pro- duced by other Phoma species suggests that susceptible plants with Rnpm1 and Rnpm2 are sensitive to a toxin and variation in these genes (rnpm1 and rnpm2) results in lack of sensitivity.
0.3 0.1 0.1
h2_21h11d h2_16a10d h2_9d1a MtB114
1.0
EIF5A
Future work will be directed at further fine mapping and isolation of rnpm2, in conjunction with gene expression studies to identify genes controlling resistance and candi- dates for rnpm2 in the region of interest. In addition, the possible involvement of fungal phytotoxins during infec- tion will be characterised and their interaction with the resistance QTL evaluated.
Fine map genetic position of rnpm2 Figure 6 Fine map genetic position of rnpm2. The genomic region encompassing rnpm2 for P. medicaginis resistance in the SA27063 × SA3054 population is depicted in a 0.8 cM inter- val between markers h2_16a6a and h2_21h11d on lower LG8. The location is based on a recombination point analysis using recombinant F3 families selected from 528 F2 individu- als.
Methods Growth conditions and mapping populations To ensure even germination, seeds were scarified with sand using a mortar and pestle, transferred to a Petri dish lined with blotting paper, and irrigated with sterile water. The seeds were kept at 4°C for 48 h, and germinated at room temperature overnight. Seedlings were sown in ver- miculite (Richgro Garden Products, Jandakot, Western Australia 6164), fertilized twice a week using Optigrow fertilizer (Growth Technology, O'Connor, Western Aus- tralia 6163) and grown under natural light in a tempera- ture controlled greenhouse (22°C day, 18°C night).
bears a reciprocal translocation, involving chromosomes four and eight, and exhibits reduced pollen viability [23]. All previously published M. truncatula genetic maps used accession A17 or a closely related line, J6, as one of the parents. The SA27063 × SA3054 genetic map is the first
Parental M. truncatula accessions were identified from the disease phenotype screens described by as being either
Page 8 of 12 (page number not for citation purposes)
BMC Plant Biology 2008, 8:30
http://www.biomedcentral.com/1471-2229/8/30
resistant (SA27063) or susceptible (SA3054 and A17) to P. medicaginis OMT5 [18]. Crosses between SA27063 and either A17 or SA3054, as pollen donors, were obtained by a manual crossing procedure [32]. F1 seeds were collected and heterozygosity verified with genetic markers poly- morphic between the parental accessions.
the edges with tissue. The samples were examined under UV with a light fluorescent Olympus BH-2 microscope fit- ted with an epifluorescence filter B2A (450–490 nm exci- tation filter and a 520 nm barrier filter). Hyphae stained bright yellow, conidiospores stained bright green to yel- low with increasing age, plant cells exhibiting a hypersen- sitive response were dark brown or dark green, and healthy cells appeared a deep red colour due to the autofluorescence of intact chloroplasts. Yellow autofluo- rescence of phenolic compounds could also be observed under UV-light.
2) Superficial and intracellular fungal growth was observed using trypan blue staining. Leaves were fixed in Farmers Fluid until completely cleared. The cleared leaves were immersed in a 0.03% trypan blue stain concentrate mixed with equal volume of 100% ethanol for 30 min- utes, then destained in 2.5 g/mL chloral hydrate and examined under a Olympus BH-2 light-microscope.
Inoculation procedures and resistance evaluation P. medicaginis OMT5 inoculum was prepared by growing the isolate on wheat meal agar plates (WMA, 12 g ground wheat meal, 12 g agar, and 1 litre of distilled water). The plates were incubated at 22°C for 28–42 days under U/V. Conidia were harvested by incubating plates with 10 ml milliQ water for 20 min. and the suspension filtered through a glasswool syringe. Inoculations of were per- formed at the fourth trifoliate stage. Two methods of inoc- ulation were used: spraying with an artists airbrush to runoff (2 × 10⁶ spores/ml, 0.05% Tween 20), using a rotat- ing platform to ensure an even distribution over plant sur- faces; and spot inoculation with 10 μl droplets of spore suspension (1 × 10⁶ spores/ml, 0.05% Tween 20) on five leaves per plant. These were the unifoliate, two leaflets of the first trifoliate, and two leaflets of the second trifoliate. The third leaflets of the second and third trifoliates were mock inoculated. To ensure high humidity to stimulate conidia germination, plants were placed in sealed propa- gator trays for 48 hours.
3) To visualize production of H2O2 in response to P. med- icaginis penetration, a DAB (Diaminobenzidine-tetrahy- drochloride) staining solution was used [34]. The petioles were placed in the DAB staining solution (1 mg DAB/mL H2O pH 3.8, Sigma) for 48 hours. The leaves were fixed and cleared in a solution of ethanol: chloroform (v/v 4:1) and 0.15% TCA for 2–3 hours. After DAB staining leaves were stained with Trypan Blue staining solution for 5–10 minutes. The stained leaves were examined under an Olympus BH-2 light-microscope.
F2 individuals were spot inoculated and macroscopically evaluated at 7 days post inoculation (dpi), then rescored at 10 dpi to confirm more resistant disease reactions as on a 1 (resistant) – 5 (susceptible) scale described by Ellwood et al. [18]. F3 families were spray inoculated using a mini- mum of 16 F3 individuals per family and a randomised plot design with two representative F3 individuals per family per plot. Disease symptoms were evaluated at 7 and 10 dpi according to the 1–5 scale devised by Salter and Leath [50]. All inoculations incorporated parental control accessions.
Cytology of the M. truncatula-P. medicaginis pathosystem Three different staining methods were used to study the M. truncatula – P. medicaginis interaction microscopically:
Statistical analysis of the disease resistance data Departure from normality for the distribution of disease scores was tested using the W test of Shapiro and Wilk [22]. Fain's test was used to evaluate the relationship between the means of the F3 families and the variance within the families [25]. This test assumes that if resist- ance is determined by one or a few genes with a large effect, that families possessing the most extreme pheno- types are likely to be homozygous, exhibiting low vari- ance within the family. Families with intermediate phenotypes are more likely to be heterozygous, exhibiting large variances (for resistance) within each family. The relationship between families can be described using a quadratic equation, where a significant value (P/t/ < 0.05) indicates the presence of one (or a few) major genes. All the statistical analysis of the data described above was car- ried out using JMP-IN 5.1 software (SAS Institute, Cary, NC).
Identification of polymorphic DNA markers Different types of PCR markers were used to identify pol- ymorphic markers; EST-based intron targeted markers [30]; microsatellites located in introns [28]; microsatel-
1) Superficial fungal growth was observed by staining with fluorescent dye 3'3-dihexyloxacarbocyanine iodide (DiOC6(3), Sigma-Aldrich). Whole or part-leaf samples were immersed in fresh aqueous solutions of the fluores- cent dye 3 DiOC6(3) at 50 mg mL-1, prepared from DiOC6(3) stock solution in ethanol (0.5 mg mL-1, stored at -20°C as described by Duckett and Read [51]. Between 2–3 minutes of exposure normally gave an adequate level of stain absorption. The samples were then placed on slides and the excess stain solution drawn off gently from
Page 9 of 12 (page number not for citation purposes)
BMC Plant Biology 2008, 8:30
http://www.biomedcentral.com/1471-2229/8/30
lites from sequenced BACs [52] and other published sources [26,29].
Removed markers were re-attached to the genetic map in the interval of most probable fit (e.g. minimum increase in the number of recombination events).
QTL analysis QTL analysis was performed with MultiQTL v2.5 [53] by applying a general interval mapping and marker restora- tion method as described by Lichtenzveig et al. [54]. The hypotheses that a single locus or two linked loci have an effect on resistance to P. medicaginis were evaluated. Firstly, 5000 permutation tests were performed on the hypothesis that one locus on a chromosome has an effect on the disease resistance (H1) versus the null hypothesis (H0) that the locus has no effect on the disease resistance. Secondly, 3000 permutation tests were run on the hypothesis that a single locus has an effect on disease resistance versus two linked loci. The model with the highest LOD score was fitted to the QTL and when the models did not differ significantly the simpler model was chosen ('one locus-one trait'). Five thousand bootstrap samples were run to assess the estimates and the standard deviation (SD) of the main parameters: locus effect, its chromosomal position, its LOD score and the proportion of explained variability (PEV).
Authors' contributions SE and RPO designed research. LK and SE conducted dis- ease screens, phenotyping, polymorphism discovery, gen- otyping and genetic mapping. JL provided advice on statistical analyses. LK, JL and SE analysed the data.
Additional material
Temperature gradient PCR was used to identify the opti- mum annealing temperature for each primer pair using the standard reference accession M. truncatula A17 as a positive control. The following basic PCR protocol was used with minor variations: 50 ng of genomic DNA tem- plate, 1 × PCR reaction buffer, 2 mM MgCl2, 0.25 mM of each dNTP, 10 pmol of each primer and 1 unit of Taq DNA polymerase. Thermocycling conditions (with minor variations) were: 2 minutes initial denaturation at 94°C followed by 36 cycles of 94°C for 30 sec, marker-specific annealing temperatures for 30 sec, 72°C for 60 sec, then a final extension step of 5 min at 72°C. Where no length or published restriction enzyme polymorphisms were avail- able, PCR products with a single amplicon were direct sequenced using BigDye 3.1 Terminator Cycle Sequencing Ready Reaction Mix (Applied Biosystems [AB], Foster City, California) and the products run on an AB Prism 3730 DNA sequencer. Polymorphisms in the DNA sequences were identified by aligning the sequences in Vector NTI Suite 9.0 (Invitrogen, Carlsbad, California). Where restriction enzymes recognising differences in DNA sequence were available, markers were run as co-domi- nant CAPS [31]. Single Nucleotide Polymorphisms (SNPs) for which no restriction enzyme was available were detected using SNaPshot (AB), and analysed using GeneMapper v. 3.7 (AB). Large fragment size polymor- phisms were resolved by agarose gel electrophoresis and visualised using ethidium bromide staining. Small frag- ment size polymorphisms were resolved by native poly- acrylamide gel electrophoresis or by AB Prism 3730 capillary sequencer using fluorescently labelled primers and a GeneScan™ 500 LIZ® Size Standard (AB).
Additional file 1 PCR markers used to generate a genetic map in an F2 population between accessions SA27063 and SA3054 Click here for file [http://www.biomedcentral.com/content/supplementary/1471- 2229-8-30-S1.doc]
Additional file 2 PCR markers used to generate a genetic map in an F2 population between accessions SA27063 and A17 Click here for file [http://www.biomedcentral.com/content/supplementary/1471- 2229-8-30-S2.doc]
Acknowledgements This research was funded by the Grains Research and Development Cor- poration of Australia (GRDC). We thank Megan Jordan and Angela Wil- liams for technical assistance.
Genotyping and linkage analysis Genomic DNA from the parents and F2 individuals were extracted as previously described [21] and polymorphic markers genotyped as described above. A Pearson Chi- square analysis was applied to test the observed segrega- tion ratio of parental alleles against the expected Mende- lian segregation ratio for co-dominant inheritance in a F2 population, 1:2:1, to remove highly distorted markers. Marker order and map distances were calculated with Multipoint v1.2 software [53] using a maximum recombi- nation fraction (rf) of 0.210 and the Kosambi mapping function. To test the stability of the order of markers for each linkage group (LG), a Jackknife re-sampling approach was used with 5000 iterations. Markers that vio- lated monotonic increase of rfs (i.e. deviation from the expected increase of rf between a marker and its subse- quent neighbours) were detected and removed using the control of monotony function. Marker orders were accepted if the probability was greater than 0.90.
References 1. Nutter FR, Guan J, Gotlieb AR, Rhodes LH, Grau CR, Sulc RM: Quantifying alfalfa yield losses caused by foliar diseases in
Page 10 of 12 (page number not for citation purposes)
BMC Plant Biology 2008, 8:30
http://www.biomedcentral.com/1471-2229/8/30
2.
22.
3.
4.
24.
5.
25.
dispersal throughout the Mediterranean basin. Theor Appl Genet 2006, 112(5):977-983. Shapiro SS, Wilk MB: An analysis of variance test for normality (complete samples). Biometrika 1965, 52(3 and 4):591-611. 23. Kamphuis LG, Williams AH, D'Souza NK, Pfaff T, Ellwood SR, Groves EJ, Singh KB, Oliver RP, Lichtenzveig J: The Medicago truncatula reference accession A17 has an aberrant chromosomal con- figuration. New Phytol 2007, 174(2):299-303. Lichtenzveig J, Shtienberg D, Zhang HB, Bonfil DJ, Abbo S: Biometric analyses of the inheritance of resistance to Didymella rabiei in chickpea. Phytopathology 2002, 92(4):417-423. Lynch M, Walsh B: Genetics and analysis of quantitative traits. Sunderland, USA , Sinauer Associates; 1997.
6.
Iowa, Ohio, Wisconsin, and Vermont. Plant Dis 2002, 86(3):269-277. Crawford EJ, Lake AWH, Boyce KG: Breeding annual Medicago species for semi-arid conditions in southern Australia. Adv Agron 1989, 42:399-437. Barbetti MJ: Fungal foliage diseases of pasture legumes. J Agric (W Aust) 1983, 1:10-12. Barbetti MJ, Nichols PGH: Effect of Phoma medicaginis and Leptosphaerulina trifolii on herbage and seed yield and cou- mestrol content of annual Medicago species. Phytophylactica 1991, 23:223-227. Barbetti MJ: Resistance in annual Medicago species to Phoma medicaginis and Leptosphaerulina trifolii on herbage under field conditions. Aust J Expt Agric 1995, 35:209-214. Hammond-Kosack KE, Parker JE: Deciphering plant-pathogen communication: fresh perspectives for molecular resistance breeding. Curr Opin Biotechnol 2003, 14(2):177-193.
7. Wolpert TJ, Dunkle LD, Ciuffetti LM: Host-selective toxins and avirulence determinants: What's in a name? Annual Review of Phytopathology 2002, 40(1):251-285.
26. Baquerizo-Audiot E, Desplanque B, Prosperi JM, Santoni S: Charac- terization of microsatellite loci in the diploid legume Medi- cago truncatula (barrel medic). Mol Ecol Notes 2001:1-3. 27. Choi HK, Mun JH, Kim DJ, Zhu H, Baek JM, Mudge J, Roe B, Ellis N, Doyle JJ, Kiss GB, Young ND, Cook DR: Estimating genome con- servation between crop and model legume species. PNAS 2004, 101(43):15289-15294.
28. Gutierrez MV, Vaz Patto MC, Huguet T, Cubero JI, Moreno MT, Torres AM: Cross-species amplification of Medicago truncat- ula microsatellites across three major pulse crops. Theor Appl Genet 2005, 110(7):1210-1217.
9.
10.
in maize.
Science
gene
29. Mun JH, Kim DJ, Choi HK, Gish J, Debellé F, Mudge J, Denny R, Endré S, Saurat O, Dudez AM, Kiss GB, Roe B, Young ND, Cook DR: Dis- tribution of microsatellites in the genome of Medicago trun- catula: A resource of genetic markers that integrate genetic and physical maps. Genetics 2006, 172:2541-2555.
8. Mayama S, Bordin APA, Morikawa T, Tanpo H, Kato H: Association of avenalumin accumulation with co-segregation of victorin sensitivity and crown rust resistance in oat lines carrying the Pc-2 gene. Physiol Mol Plant Pathol 1995, 46(4):263-274. Sweat TA, Wolpert TJ: Thioredoxin h5 is required for victorin sensitivity mediated by a CC-NBS-LRR gene in Arabidopsis. Plant Cell 2007, 19(2):673-687. Johal GS, Briggs SP: Reductase activity encoded by the HM1 dis- ease 1992, resistance 258(5084):985-987.
30. Choi HK, Kim D, Uhm T, Limpens E, Lim H, Mun JH, Kalo P, Penmetsa RV, Seres A, Kulikova O, Roe BA, Bisseling T, Kiss GB, Cook DR: A sequence-based genetic map of Medicago truncatula and comparison of marker colinearity with M. sativa. Genetics 2004, 166(3):1463-1502.
11. Brandwagt BF, Mesbah LA, Takken FLW, Laurent PL, Kneppers TJA, Hille J, Nijkamp HJJ: A longevity assurance gene homolog of tomato mediates resistance to Alternaria alternata f. sp. lyc- opersici toxins and fumonisin B1. Proceedings of the National Academy of Sciences 2000, 97(9):4961-4966.
31. Konieczny A, Ausubel FM: A procedure for mapping Arabidop- sis mutations using co-dominant ecotype-specific PCR-based markers. Plant Journal 1993, 4(2):403-410.
12. Clouse SD, Gilchrist DG: Interaction of the asc locus in F8 paired lines of tomato with Alternaria alternata f. sp. lycop- ersici and AAL-toxin. Phytopathology 1987, 77:80-82.
13. Colditz F, Braun HP, Jacquet C, Niehaus K, Krajinski F: Proteomic profiling unravels insights into the molecular background underlying increased Aphanomyces euteiches-tolerance of Medicago truncatula. Plant Mol Biol 2005, 59(3):387-406.
32. Thoquet P, Gherardi M, Journet EP, Kereszt A, Ane JM, Prosperi JM, Huguet T: The molecular genetic linkage map of the model legume Medicago truncatula: an essential tool for compara- tive legume genomics and the isolation of agronomically important genes. BMC Plant Biol 2002, 2(1):1 EPub.
15.
33. Huckelhoven R, Dechert C, Kogel KH: Non-host resistance of barley is associated with a hydrogen peroxide burst at sites of attempted penetration by wheat powdery mildew fungus. Molecular Plant Pathology 2001, 2(4):199-205.
14. Vandemark G, Grunwald N: Reaction of Medicago truncatula to Aphanomyces euteiches Race 2. Archives of Phytopathology and Plant Protection 2004, 37:59-67. Ellwood S, Kamphuis LG, Pfaff T, Oliver RP, Samac DA, Foster-Hart- nett D, Tivoli B, Onfroy C, Moussart A, Villegas AM, Sillero JC, Rubi- ales D: Inoculation and growth with foliar pathogenic fungi. Medicago truncatula Handbook 2006 [http://www.noble.org/Medicago Handbook/pdf/InoculationGrowth_FoliarPathogenic.pdf]. Ardmore , The Samuel Roberts Noble Foundation
34. Huckelhoven R, Fodor J, Preis C, Kogel KH: Hypersensitive cell death and papilla formation in barley attacked by the pow- dery mildew fungus are associated with hydrogen peroxide but not with salicylic acid accumulation. Plant Physiol 1999, 119:1251-1260.
35. Glazebrook J: Contrasting mechanisms of defence against bio- trophic and necrotrophic pathogens. Annual Review of Phytopa- thology 2005, 43(1):205-227.
Mol Plant Microbe
16. Torregrosa C, Cluzet S, Fournier J, Huguet T, Gamas P, Prosperi JM, Esquerre-Tugaye MT, Dumas B, Jacquet C: Cytological, genetic, and molecular analysis to characterize compatible and incompatible interactions between Medicago truncatula and Colletotrichum trifolii. Interact 2004, 17(8):909-920.
36. Torres MA, Jones JDG, Dangl JL: Reactive oxygen species signal- ing in response to pathogens. Plant Physiol 2006, 141(2):373-378. 37. Dixon RA: Natural products and plant disease resistance.
Nature 2001, 411:843-847.
18.
38. Deavours BE, Liu CJ, Naoumkina MA, Tang Y, Farag MA, Sumner LW, Noel JP, Dixon RA: Functional analysis of members of the iso- flavone and isoflavanone O-methyltransferase enzyme fami- lies from the model legume Medicago truncatula. Plant Mol Biol 2006, 62:715-733.
39. Dixon RA, Achnine L, Kota P, Liu CJ, Reddy MSS, Wang L: The phe- nylpropanoid pathway and plant defence - a genomics per- spective. Molecular Plant Pathology 2002, 3(5):371-390.
17. Moussart A, Onfroy C, Lesne A, Esquibet M, Grenier E, Tivoli B: Host status and reaction of Medicago truncatula accessions to infection by three major pathogens of pea (Pisum sati- vum) and alfalfa (Medicago sativa). Eur J Plant Pathol 2007, 117(1):57-69. Ellwood SR, Kamphuis LG, Oliver RP: Identification of sources of resistance to Phoma medicaginis isolates in Medicago trun- catula SARDI core collection accessions, and multigene dif- ferentiation of isolates. Phytopathology 2006, 96:1330-1336. 19. Moussart A, Tivoli B, Samac DA, D’Souza N: Medicago truncatula resistance to Oomycetes. Medicago truncatula Handbook 2006 [http://www.noble.org/MedicagoHandbook/pdf/OomycetesResist ance.pdf]. Ardmore , The Samuel Roberts Noble Foundation
41.
21.
40. He XZ, Dixon RA: Genetic manipulation of isoflavone 7-O- methyltransferase enhances biosynthesis of 4'-O-methylated isoflavonoid phytoalexins and disease resistance in alfalfa. Plant Cell 2000, 12(9):1689-1702. Liu CJ, Huhman D, Sumner LW, Dixon RA: Regiospecific hydrox- ylation of isoflavones by cytochrome P450 81E enzymes from Medicago truncatula. Plant Journal 2003, 36:471-484. 42. Barbetti MJ: Resistance in annual Medicago spp. to Phoma medicaginis and Leptosphaerulina trifolii and its relationship
20. O'Neill NR, Bauchan GR, Samac DA: Reactions in the annual Medicago spp. core germ plasm collection to Phoma medi- caginis. Plant Dis 2003, 87(5):557-562. Ellwood SR, D'Souza NK, Kamphuis LG, Burgess TI, Nair RM, Oliver RP: SSR analysis of the Medicago truncatula SARDI core col- lection reveals substantial diversity and unusual genotype
Page 11 of 12 (page number not for citation purposes)
BMC Plant Biology 2008, 8:30
http://www.biomedcentral.com/1471-2229/8/30
to induced production of a phytoestrogen. Plant Dis 2007, 91(3):239-244.
43. Kuster H, Hohnjec N, Krajinski F, El Yahyaoui F, Manthey K, Gouzy J, Dondrup M, Meyer F, Kalinowski J, Brechenmacher L, van Tuinen D, Gianinazzi-Pearson V, Puhler A, Gamas P, Becker A: Construction and validation of cDNA-based Mt6k-RIT macro- and micro- arrays to explore root endosymbioses in the model legume Medicago truncatula. Journal of Biotechnology 2004, 108:95-113.
44. Able AJ: Role of reactive oxygen species in the response of Protoplasma 2003,
barley to necrotrophic pathogens. 221(1):137-143.
45. Kulikova O, Gualtieri G, Geurts R, Kim DJ, Cook D, Huguet T, de Jong JH, Fransz PF, Bisseling T: Integration of the FISH pachytene and genetic maps of Medicago truncatula. Plant Journal 2001, 27(1):49-58.
47.
46. Young ND: QTL mapping and quantitative disease resistance in plants. Annual Review of Phytopathology 1996, 34:479-501. Luo ZW, Potokina E, Druka A, Wise R, Waugh R, Kearsey MJ: SFP genotyping from affymetrix arrays is robust but largely detects cis-acting expression regulators. Genetics 2007, 176(2):789-800.
49.
50.
48. Zhu H, Cannon SB, Young ND, Cook DR: Phylogeny and genomic organization of the TIR and non-TIR NBS-LRR resistance gene family in Medicago truncatula. Mol Plant Microbe Interact 2002, 15(6):529-359. Friesen TL, Meinhardt SW, Faris JD: The Stagonospora nodorum- wheat pathosystem involves multiple proteinaceous host- selective toxins and corresponding host sensitivity genes that interact in an inverse gene-for-gene manner. Plant Journal 2007, 51(4):681-692. Salter RM, Leath KL: Spring back stem and leafspot resistance. In Standard Tests to Charaterise Alfafa Cultivars 3rd edition. Edited by: Fox CC, Berberet R, Gray FA, Grau CR, Jessen DL, Petersen MA. North American Alfafa Improvement Conference, Beltsville, MD ; 1992.
51. Duckett JG, Read DJ: The use of fluorescent dye 3,3'-dihexy- loxacarbocyanine iodide, for selective staining of ascomyc- etes fungi associated with liverwort rhizoids and ericoid mycorrhizal roots. New Phytologist 1991, 118:259-272.
52. Medicago truncatula sequencing resources [http://www.med
icago.org/genome/]
53. MultiQTL - the best QTL mapping software [http://www.mul
54.
tiqtl.com/] Lichtenzveig J, Bonfil D J., Zhang HB, Shtienberg D, Abbo S: Mapping quantitative trait loci in chickpea associated with time to flowering and resistance to Didymella rabiei the causal agent of Ascochyta blight. Theor Appl Genet 2006, 113(7):1357-1369.
Publish with BioMed Central and every scientist can read your work free of charge
"BioMed Central will be the most significant development for disseminating the results of biomedical researc h in our lifetime."
Sir Paul Nurse, Cancer Research UK
Your research papers will be:
available free of charge to the entire biomedical community
peer reviewed and published immediately upon acceptance
cited in PubMed and archived on PubMed Central
yours — you keep the copyright
BioMedcentral
Submit your manuscript here: http://www.biomedcentral.com/info/publishing_adv.asp
Page 12 of 12 (page number not for citation purposes)