KẾT CẤU - CÔNG NGHỆ XÂY DỰNG
Tạp chí KHCN Xây dựng - số 1/2025 3
STUDYING SEISMIC DISPLACEMENT OF A CONTAINER CRANE
BY SHAKING TABLE TEST AND PUSHOVER ANALYSIS
NGHIÊN CỨU CHUYỂN DỊCH DO ĐỘNG ĐẤT CỦA KẾT CẤU CẨU HÀNG CONTAINER
BẰNG THÍ NGHIỆM BÀN RUNG VÀ PHÂN TÍCH ĐẨY DẦN
VAN BAC NGUYENª,*
ªFaculty of Civil Engineering, VNU Hanoi, University of Engineering and Technology, Hanoi, Vietnam
*Corresponding Author, E-mail: bacnguyenvan@vnu.edu.vn
Ngày nhận 07/02/2025, Ngày sửa 10/03/2025, Chấp nhận 17/03/2025
https://doi.org/10.59382/j-ibst.2025.vi.vol1-1
Abstract: In this study, the seismic response of a
container crane under a ground motion was
investigated by using shake table testing on a 1/20
scale container crane. The 1/20 scale container
crane was designed and fabricated according to the
similitude laws, utilizing three independent quantities
such as geometric length, acceleration, and elastic
modulus were used to design the 1/20 scale
container crane. The Pohang earthquake was used
to evaluate the seismic response of the 1/20 scale
container crane at the Seismic Research and Test
Center, Pusan National University, Yangsan Campus.
The results showed that the maximum strain on the
seaside leg occurred at the top of the lower seaside
leg. The displacement demand on the container
crane was accessed, paying particular attention to
the portal frame. The container crane exhibited an
elastic-range response, with a portal drift of
approximately 14.8 mm when the container crane
was subjected to the ground motions with the
response spectrum matched to the seismic level
Z1S4_2400.
Keywords: Response spectrum, Acceleration
time history, Similitude law, Strain gauges, Portal drift.
Tóm tắt: Trong nghiên cứu này, phản ứng địa
chấn của một cần cẩu container dưới tác động của
chuyển động mặt đất đã được khảo sát bằng cách sử
dụng thí nghiệm trên bàn rung với mô hình cần cẩu
container tỷ lệ 1/20. Cần cẩu container tỷ lệ 1/20
được thiết kế và chế tạo theo các quy luật tương tự,
sử dụng ba đại lượng độc lập như chiều dài hình học,
gia tốc và mô đun đàn hồi để thiết kế cần cẩu
container tỷ lệ 1/20. Động đất Pohang được sử dụng
để đánh giá phản ứng địa chấn của cần cẩu container
tỷ lệ 1/20 tại Trung tâm Nghiên cứu và Thử nghiệm
Địa chấn, Trường Đại học Quốc gia Pusan, cơ sở
Yangsan. Kết quả cho thấy rằng độ biến dạng lớn
nhất ở chân biển xảy ra tại đỉnh của chân biển phía
dưới. Khả năng dịch chuyển của cần cẩu container
đã được đánh giá thông qua vị trí khung cổng. Cần
cẩu container phản ứng trong phạm vi đàn hồi, với độ
trượt của khung cổng khoảng 14,8 mm khi cần cẩu
container chịu tác động của các chuyển động mặt đất
với phổ phản ứng phù hợp với mức độ địa chấn
Z1S4_2400.
Từ khóa: Phổ phản ứng, Lịch sử thời gian gia tốc,
Quy luật mô phỏng; Cảm biến biến dạng; Độ trôi cổng.
1. Introduction
Container cranes are special equipment widely
used in seaports to transfer containers between ships
and harbors. Despite having an important role in
freight, container cranes have been one of the most
vulnerable equipment at harbors, as observed in past
earthquakes. In past studies by various researchers,
buckling and plastic hinge formation in portal frames
were identified as typical failure modes under seismic
excitation [1–5]. In those studies, however, details on
the cause and location of damages have not been
clearly presented. Therefore, this study analyzes a
container crane located at Gwangyang port in Korea
to find the most vulnerable location on the column leg
under a seismic excitation by employing shake table
testing on a 1/20 scale container crane. In order to
accurately reflect the seismic response of the
prototype crane, the 1/20 scale crane was designed
according to the similitude law [6–9]. This allows for
the conversion of the prototype crane into a lab-size
scale crane using scaling factors. The seismic
responses of container cranes were studied by
employing shake table testing on scale crane models
in some previous studies. For instance, 1/20 and 1/10
scale models of container cranes were constructed to
study the seismic response, including uplift and
derailment [1,2,5,10,11]; a 1/50 scale container crane
were studied to evaluate the effect of a base isolator
on the strain and acceleration amplitude under
earthquake loads [9]; Azeloglu et al. [12] used results
of shake table testing on 1/20 scale container crane
to build a mathematical model for the crane.
Pushover analysis (PA) is a nonlinear static
analysis method primarily based on the assumption
that a structure's seismic response is governed by its
KẾT CẤU - CÔNG NGHỆ XÂY DỰNG
4 Tạp chí KHCN Xây dựng - số 1/2025
first mode of vibration, or the first few modes, with the
shape remaining consistent throughout both the
elastic and inelastic stages of response[13]. In PA, a
numerical model of the structure is subjected to a
lateral load pattern, which helps establish a
relationship between the lateral displacement and the
lateral load. The load intensity is gradually increased
to reach the limits of structural components, such as
yielding, plastic hinge formation, and cracking, by
pushing the structure into the inelastic stage. The
selection of the load pattern is crucial in capturing
dynamic phenomena through static analysis, as it
can significantly influence the results [14–17]. The PA
includes various methods, such as the Capacity
Spectrum Method (CSM) and Displacement
Coefficient Method (DCM) as adopted by the Applied
Technology Council (ATC-40) and Federal
Emergency Management Agency (FEMA 356 and
440) [18,19]; Improved Capacity Spectrum Method
(ICSM) as proposed by Fajfar [20]; N2 method, as
proposed in Eurocode 8 [21]; and Modal Pushover
Analysis (MPA) by Chopra and Goel [22]. In this study,
DCM in FEMA 356 was used to evaluate the seismic
response of a container crane when it was subjected
to seismic motion.
2. Scale model design and input motion
2.1 A 1/20 scale container crane
A container crane located at Gwangyang port,
Korea was employed to design the 1/20 scale
container crane. The basic properties of the prototype
crane include: a total height of 78 m from the ground
to the top of the crane, a length of trolley boom girder
length of 136 m, a portal beam height of 17.5 m, a
crane rail span of 30.5 m and a total mass of
approximately 1,175 tons from a mass of frame itself
(885 tons) and a mass of other components (290
tons). In order to design the 1/20 scale crane model,
the scale factors (see Table 1) were calculated based
on the similitude law. The cross-sections of each part
of the scale crane were designed using the scale
factor for the moment of inertia. The scale factors for
converting the quantities from the prototype crane to
the scale crane were determined by Equation (1).
𝑆𝑙=𝐿
𝑙; 𝑆𝐸=𝐸
𝑒; 𝑆𝑎=𝐴
𝑎; 𝑆𝑚=𝑀
𝑚; 𝑆𝑡=𝑇
𝑡; 𝑆𝐼=𝐼
𝑖
(1)
where Sl; SE; Sa; Sm; St; SI are the scale factors
of geometric dimension, elastic, acceleration, mass,
time, and moment of inertia, respectively. It should be
noted that the uppercases in Equation (1) describe
the quantities of the prototype crane, while
lowercases indicate the quantities of the scale crane.
Table 1. Scale factors for designing the 1/20 scale crane
Quantities
Symbol
Scale factor
Quantities
Symbol
Scale factor
Geometric length, l
Sl
20
Mass, m
Sm
400
Elastic modulus, E
SE
1
Time, t
St
4.472
Acceleration, a
Sa
1
Moment of inertia, I
SI
160,000
(a)
KẾT CẤU - CÔNG NGHỆ XÂY DỰNG
Tạp chí KHCN Xây dựng - số 1/2025 5
(b)
(c)
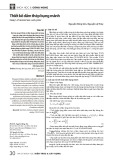
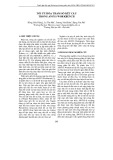
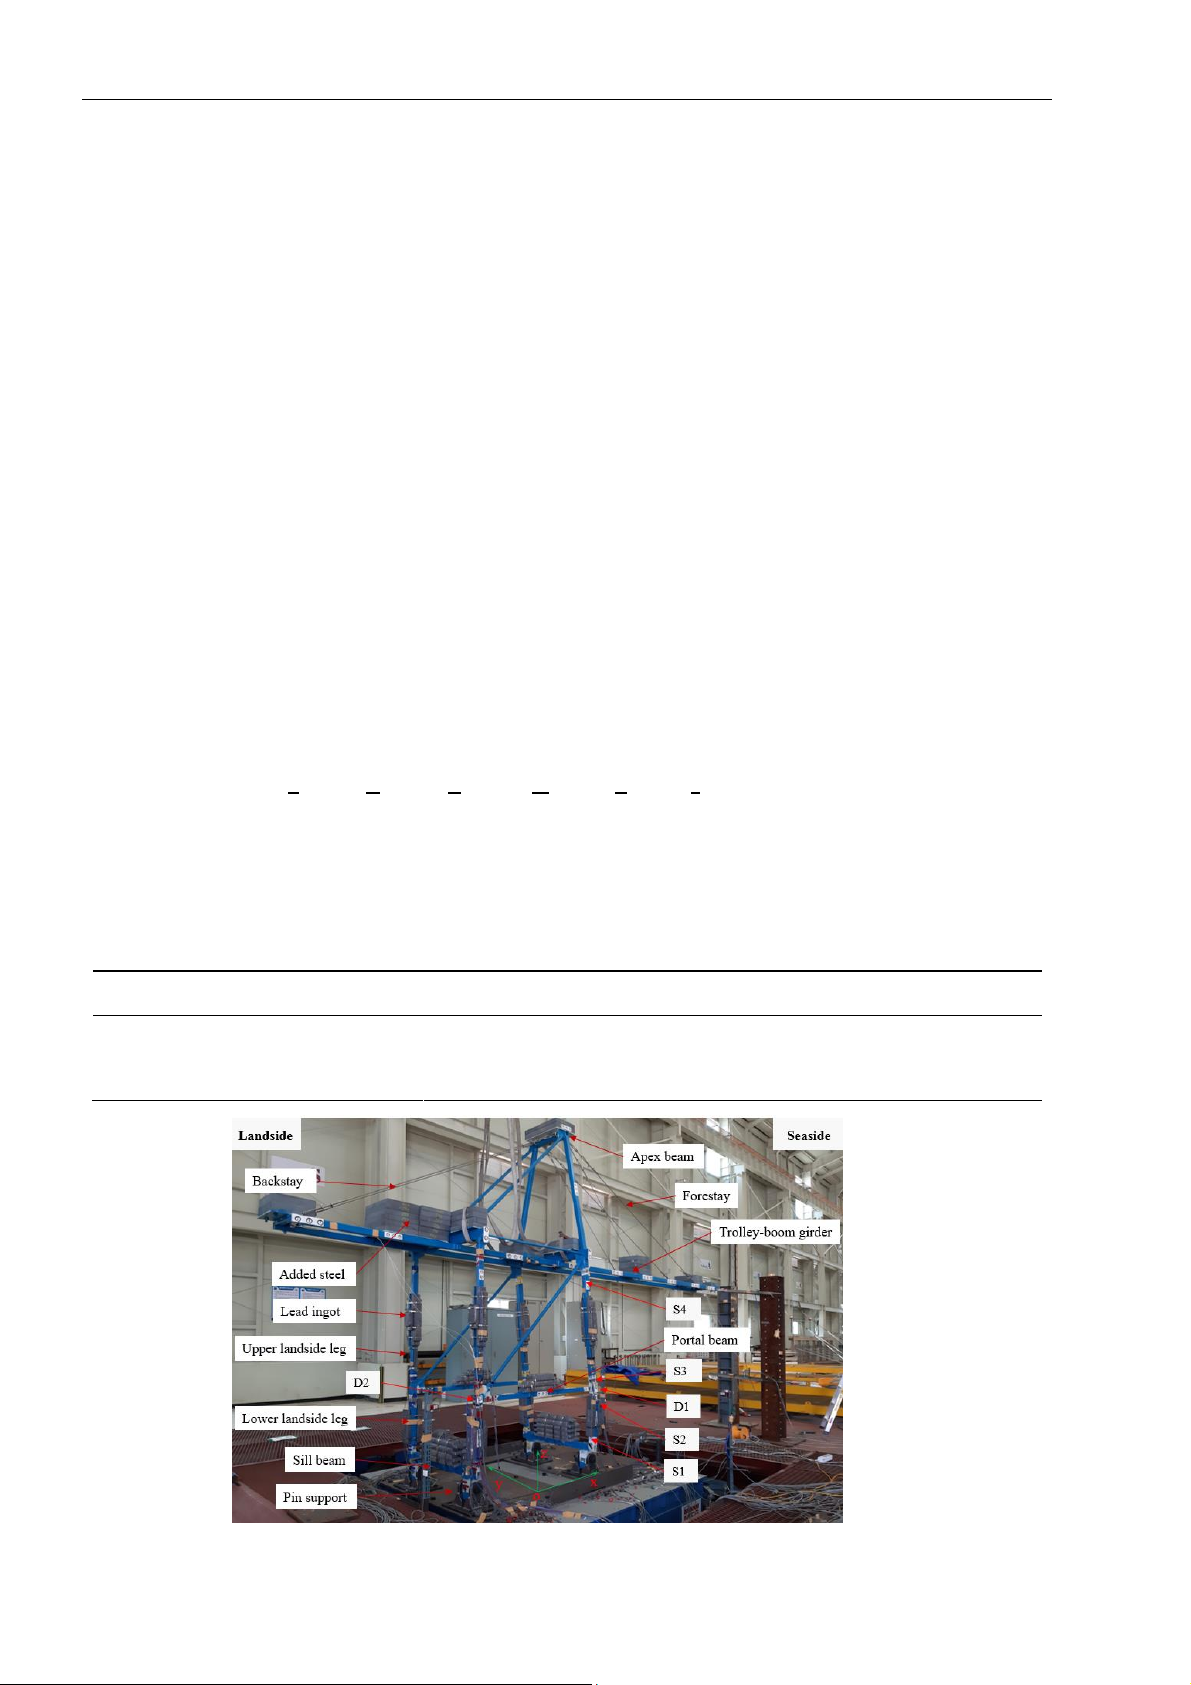
Fig. 1. (a) The 1/20 scale container crane; (b) Installing strain gauge; (c) Installing LVDT
The 1/20 scale crane is shown in Fig. 1. The total
converted mass of the scale crane was 2,939 kg.
After down-scaling the cross-section of the prototype
crane, the self-frame mass of the scale crane was
only 235.5 kg, thus requiring the introduction of
additional mass to the scale crane [23]. An additional
mass of 2703.5 kg was attached to the scale crane in
two ways: by using steel bars, which were attached
to the trolley boom girders and the apex beam by
weldings and bolts and lead ingots, which were
attached to the upper landside and seaside legs, the
lower landside and seaside legs, portal beams, and
sill beams by using steel ties. The boundary condition
model for the scale container crane was pin support,
which allows crane leg rotation but not movement in
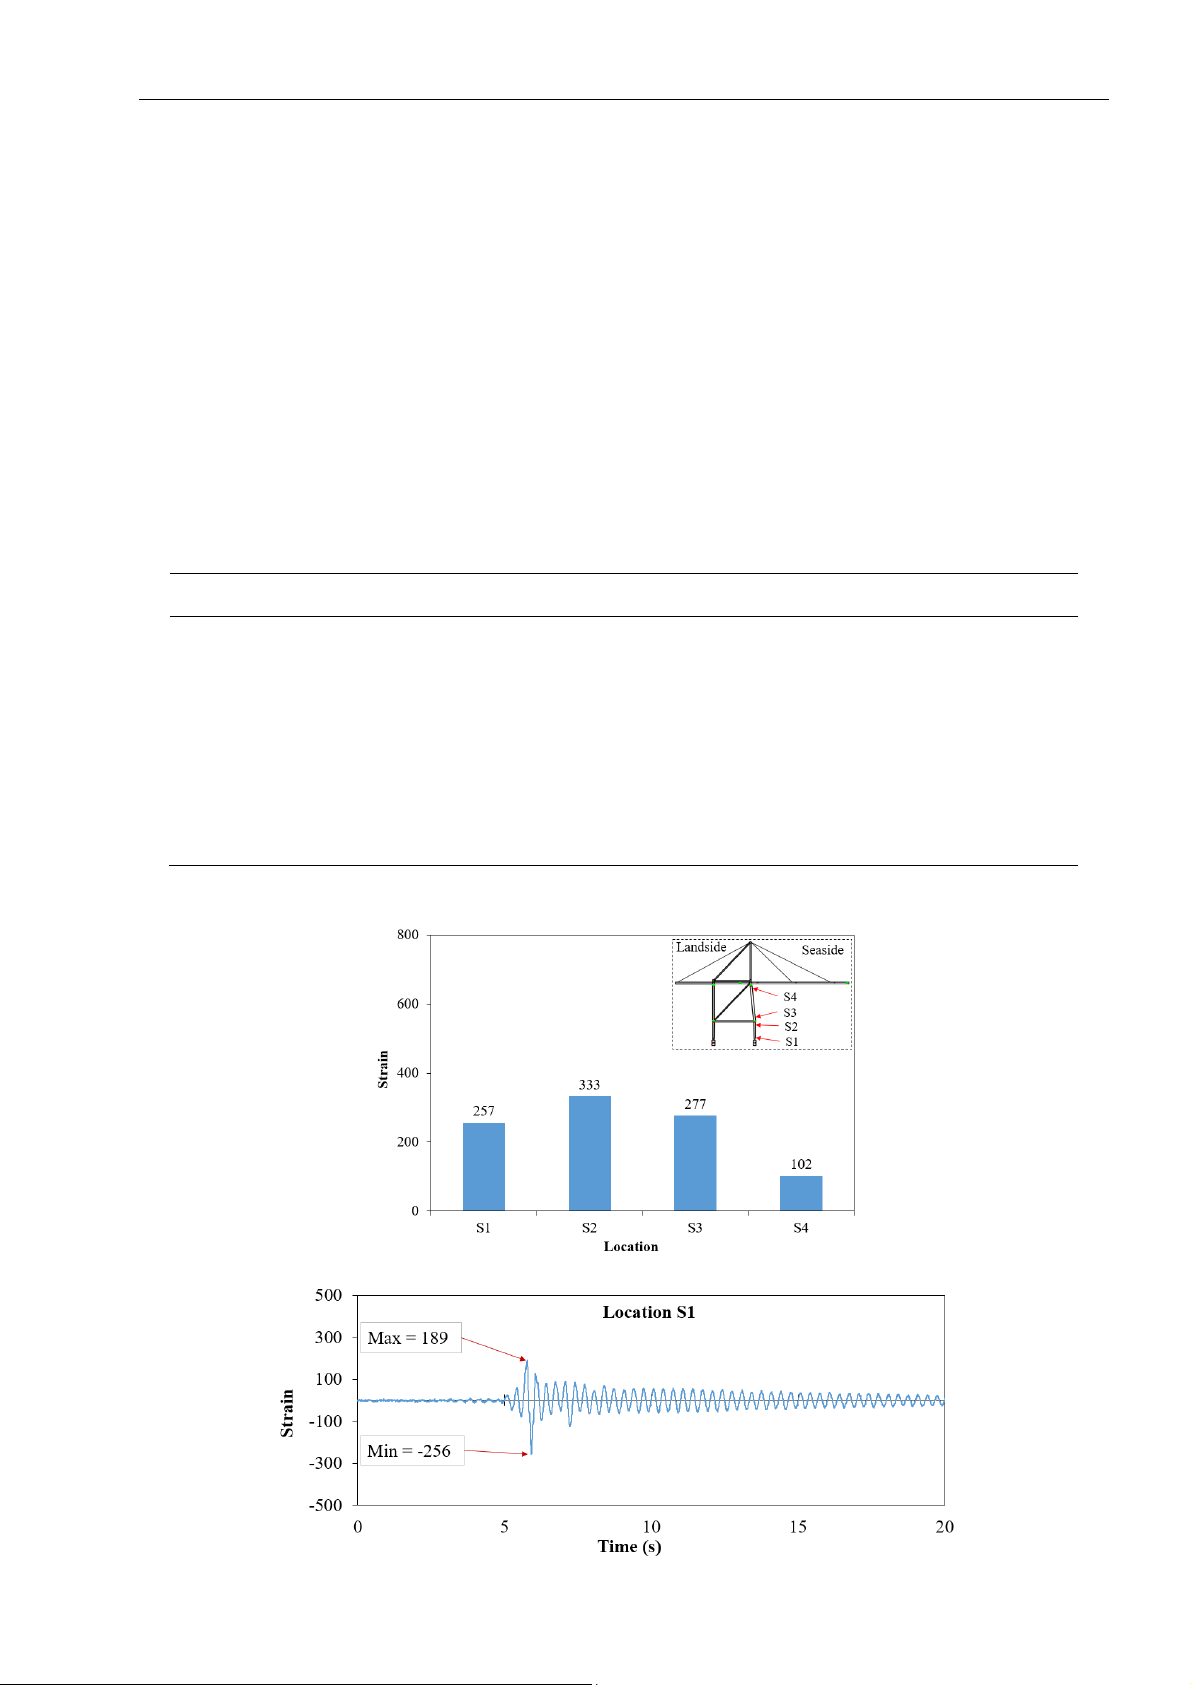
both horizontal and vertical directions. Strain along
the seaside leg was determined via strain gauges
that were attached to frames to find the most stressed
location: location S1 was the bottom of the lower
seaside leg; location S2 was the top of the lower
seaside leg; location S3 was the bottom of the upper
seaside leg; and location S4 was the top of the upper
seaside leg. The drift of the container crane was
determined at the end of the portal beam at the
seaside and landside (D1 and D2, respectively) using
a linear variable differential transformer (LVDT). The
measured locations are shown in Fig. 1.
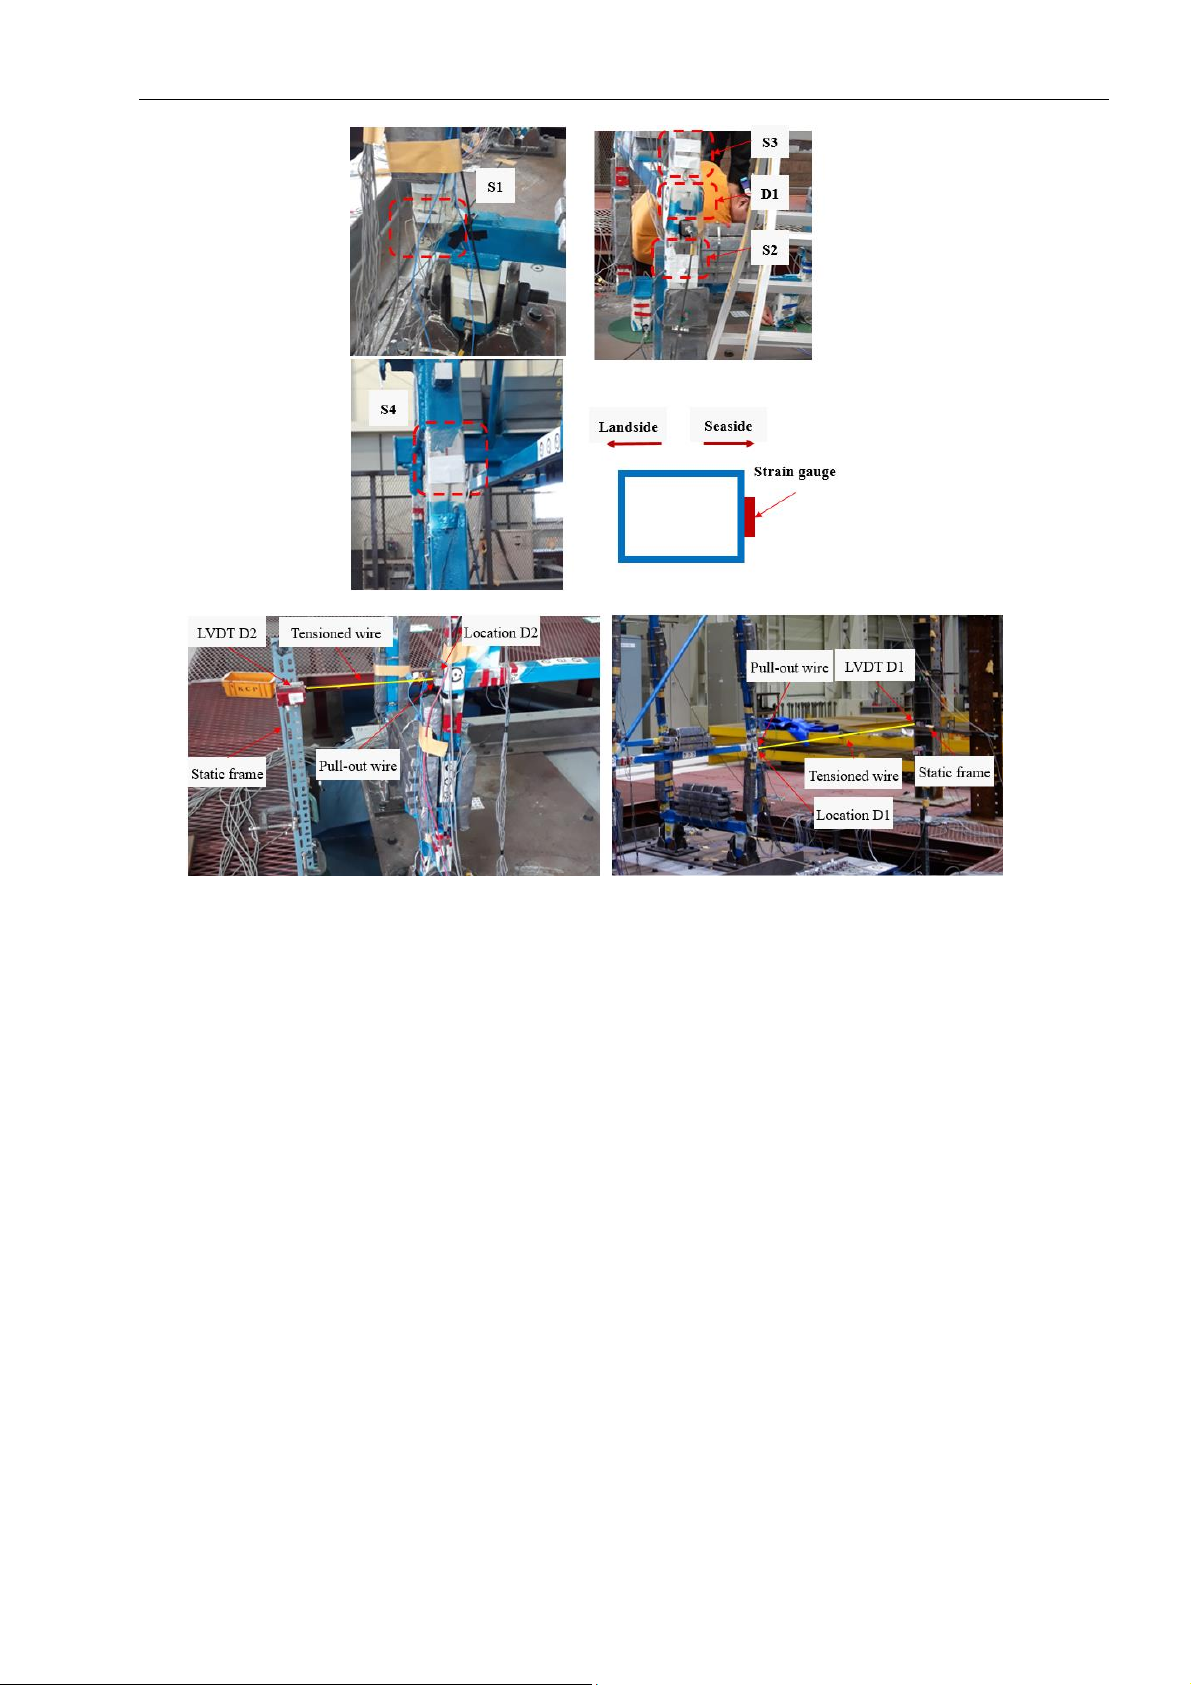
2.2 Input ground motion
For this study, the input ground motion was the
2017 Pohang earthquake, which has a magnitude of
5.4 on the Richer scale and a peak ground
acceleration of 0.27g. To characterize the elastic
Korean design standard [24,25], the response
spectrum of the ground motion was matched to the
elastic response spectrum RS Z1S4_2400 [26,27].
The response spectrum was developed with the
following parameters: seismic zone 1, soil type S4
(deep and hard ground), and a return period of 2400
years, as depicted in the Korean design standard
[24,25]. Then, the adjusted acceleration time history
was scaled down by the scale factor for time (St =
4.472) and acceleration (Sa =1) to create the input
ground motion of the shake table testing. Fig. 2 (a)
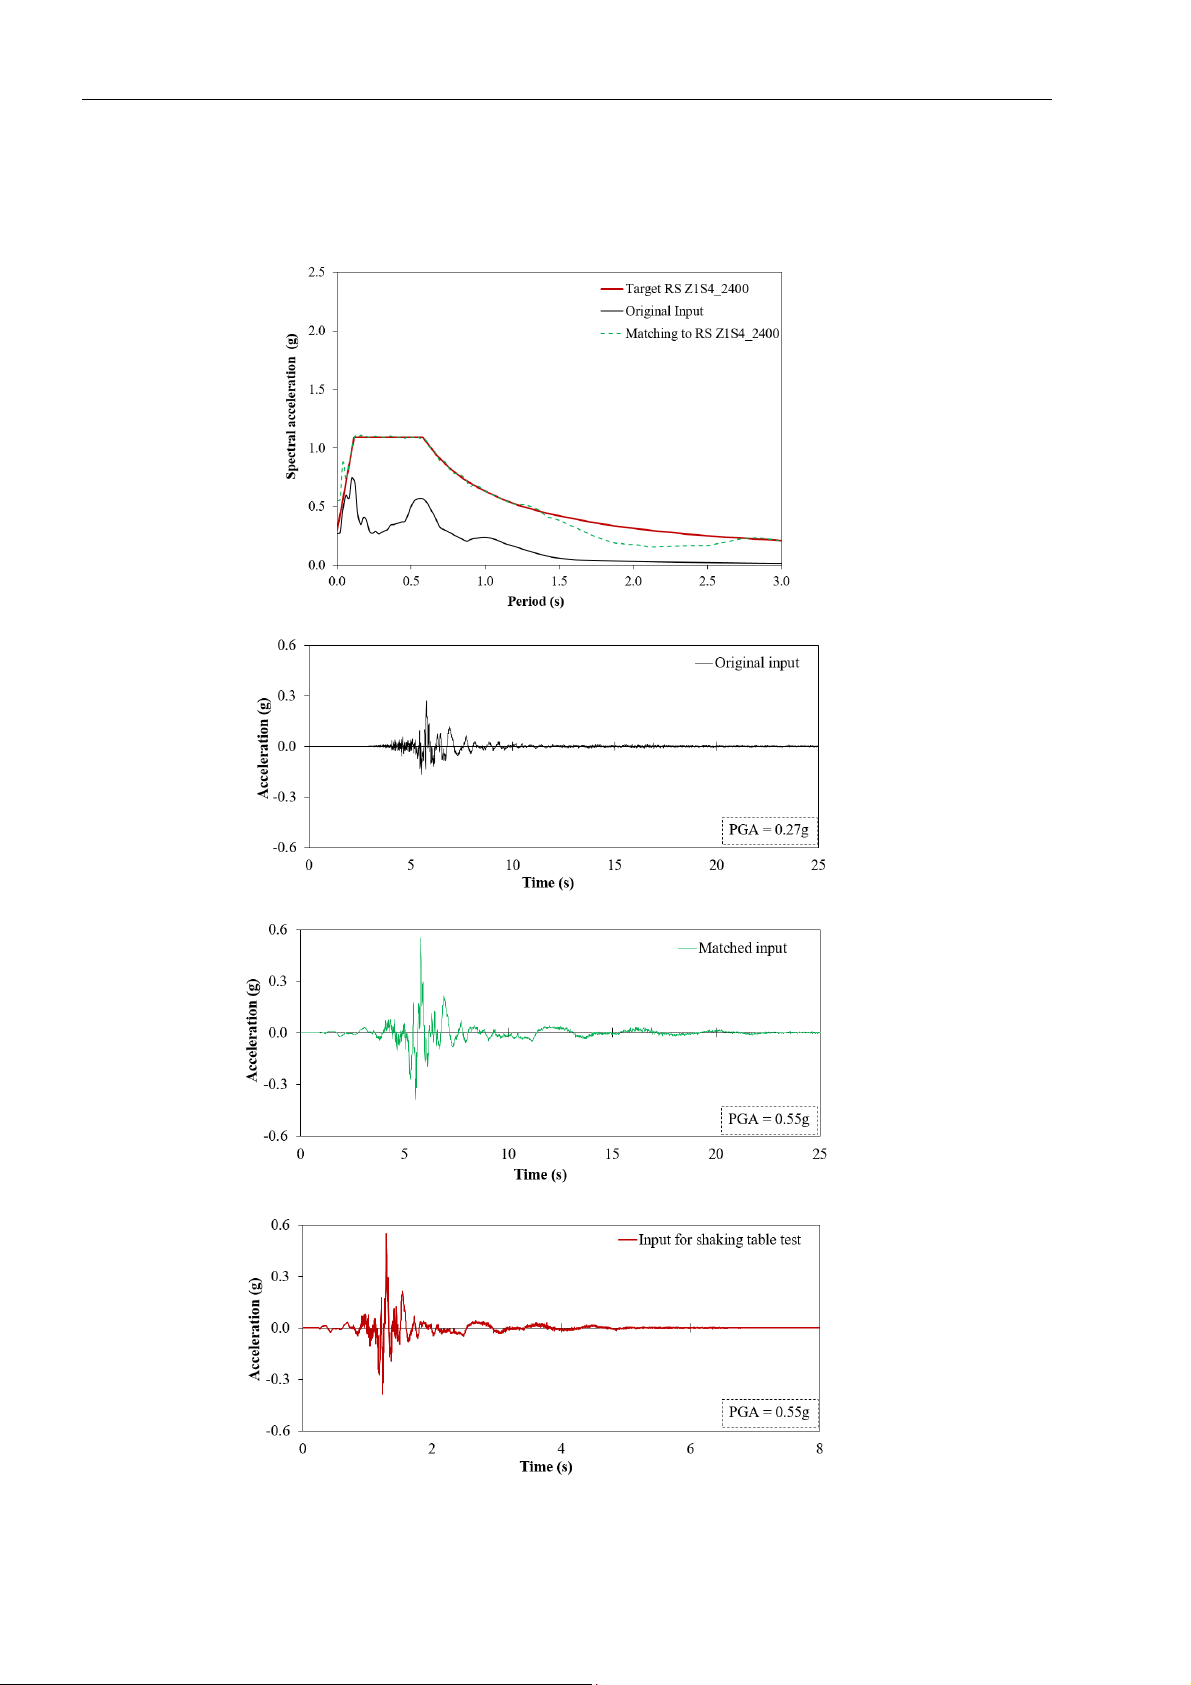
KẾT CẤU - CÔNG NGHỆ XÂY DỰNG
6 Tạp chí KHCN Xây dựng - số 1/2025
shows the original and matched response spectra of
the Pohang earthquake and the target response
spectrum (RS Z1S4_2400); Fig. 2 (b) and (c) show
the original and matched acceleration time histories,
respectively; Fig. 2 (d) shows the input for shaking
table test. The earthquake was applied on the scale
crane along the trolley boom direction to determine
its seismic responses.
(a)
(b)
(c)
(d)
Fig. 2. Input ground motions: (a) response spectrum; (b) original acceleration time history; (c) matched
acceleration time history; (d) acceleration time history for shaking table test
KẾT CẤU - CÔNG NGHỆ XÂY DỰNG
Tạp chí KHCN Xây dựng - số 1/2025 7
3. Results and Discussions
Performance-based design is an emerging
structure methodology developed from the lessons
learned in the 1990s earthquakes [28–30]. It enables
building owners to define performance levels, such
as collapse prevention, life safety, damage control,
and continued operation. Traditional seismic design
focuses on providing the capacity to withstand a
predefined seismic force but does not address how a
structure will perform if the forces exceed the design
limit. Construction or retrofitting costs may become
excessively high if the design is based on rare, high-
intensity seismic events. Conversely, predicting a
structure's performance under stronger ground
motions becomes difficult if the design is based on
more frequent seismic events. The performance level
of a container crane focuses on minimizing downtime
caused by structural damage during seismic events.
To assess this, limit states can be defined based on
expected downtime, which can be linked to specific
repair strategies tied to varying levels of structural
damage. These damage levels are quantified using a
chosen global engineering demand parameter (EDP).
The portal deformation is used as the EDP to assess
damage levels, which correspond to different repair
methods and the associated downtime required for
repairs. Table 2 shows the performance levels,
damage levels, and repair downtimes.
Table 2. Performance level and their expected downtimes [31]
Performance
level
Whole structures
Portal beam
Overall
damage
Mean
(days)
Derailment
Derailment without any structural
damage
Elastic
Derailment
6
Immediate use
Minor structural damage;
Derailment occur or not occur
Low limit: elastic.
High limit: some minor
buckling of hollow sections
Minor
damage
10
Structural
damage
Extensive damage and will not be
suitable for use without major
repairs, but not collapse
A portal deformation is lower
than deformation at
maximum load capacity up to
the point of ultimate ductility
Major
damage
60
Complete
collapse
Local buckling near the portal
frame can quickly lead to global
instability and eventual collapse
Portal deformation surpasses
the estimated point of
maximum ductility
Collapse
330
3.1 Strain of the seaside leg
(a)