
Journal of Science and Transport Technology Vol. 2 No. 4, 1-8
Journal of Science and Transport Technology
Journal homepage: https://jstt.vn/index.php/en
JSTT 2022, 2 (4), 1-8
Published online 27/12/2022
Article info
Type of article:
Original research paper
DOI:
https://doi.org/10.58845/jstt.utt.2
022.en.2.4.1-8
*Corresponding author:
E-mail address:
quy@itims.edu.vn
Received: 26/11/2022
Revised: 17/12/2022
Accepted: 19/12/2022
Synthesis and CO gas adsorption properties
of GO/ZnFe2O4 nanocomposites
Vinh Thanh Nguyen1, Tuan Quoc Tran1, Cuong Van Nguyen1, Hung Van
Nguyen2, Hai Thanh Nguyen2, Hang Thi Bui2, Dang Van Tran2, Quy Van
Nguyen2*
1University of Transport Technology, Ha Noi 100000, Viet Nam
2International Training Institute for Materials Science, Ha Noi University of
Science and Technology, Ha Noi 100000, Viet Nam
Abstract: In this work, ZnFe2O4 nanoparticles were synthesized by
hydrothermal method while the hummer method was used to synthesize GO
nanosheet. GO/ZnFe2O4 nanocomposites (GO/ZFO) were prepared by mixing
GO with ZnFe2O4 in mass ratio of 1:99, respectively. The structure,
morphology, and physical – chemical characteristics were determined by
Raman spectroscopy, Transform Electron Microscopy (TEM), and Fourier
Transform Infrared Spectroscopy (FT-IR). The CO gas adsorption properties
of GO/ZFO were investigated in the range of 25 – 200 ppm at room
temperature using quartz crystal microbalance (QCM). GO/ZFO
nanocomposites show great adsorption – desorption capacity, high
repeatability, and the largest adsorption performance of 1.21‰ (0.098 µg.cm-2
at 200 ppm). The results show that this new approach is promising of spinel
structure materials for CO adsorption at room temperature.
Keywords: ZnFe2O4, GO, QCM, CO, Adsorption.
1. Introduction
Carbon monoxide (CO) is one of the most
common toxic gases that results from the
incomplete burning of fossil fuels. CO is a
colorless, odorless and tasteless gas, known as
the “silent killer” [1],[2],[3]. In addition, CO is
considered as the major gaseous pollutant causing
about 40,000 cause of poisoning per year in the
United States of American [4]. The industry’s
booming together with the increasing number of
motor vehicles have led to a dramatically increase
in CO emissions which is directly posing a serious
threat to human life, work and living environment.
Thus, CO treatment, adsorption and detection are
researches of great significance to our society.
Recently, quartz crystal microbalance (QCM)
coated with sensing materials is used to detect CO
gas through physical/chemical adsorption. These
studies not only make a great contribution to the
development of sensor technology but also give us
a comprehensive understanding of the gas
adsorption properties [5],[6]. On the other hand,
CO adsorption sensitivity studies can be
approached by density functional theory. These
calculation results indicate that the materials based
on graphene can be considered as potential
adsorption materials for toxic gases, such as
carbon monoxide [7-9]. Furthermore, using the
experimental approach, QCM coated with
graphene oxide nanosheets (GO NSs)
demonstrate a quick response, good repeatability
and long-term stability to CO tests at room

JSTT 2022, 2 (4), 1-8
Nguyen et al
2
temperature [10]. In addition, QCM sensors based
on iron oxide/iron oxide-hydroxide and zinc ferrite
nanoparticles (ZnFe2O4 NPs) nanomaterial also
show CO detection capacity via physical
interaction [11],[12].
From this view point, the combination
between GO NSs and ZnFe2O4 NPs promises an
excellent CO adsorbent. Therefore, GO/ZnFe2O4
nanocomposites were created in this work and our
experiments were carried out to understand their
CO adsorption characteristics. In the present
study, we report new results related to the
adsorption capacity, repeatability and adsorption –
desorption time of GO/ZnFe2O4 nanocomposites
for CO gas at room temperature in the
concentration range of 25 – 200 ppm. These
promising results provide an interesting research
direction in the near future.
2. Experiment
2.1. GO/ZnFe2O4 (GO/ZFO) nanocomposites
synthesis
Chemicals used in this experiment include:
zinc nitrate hexahydrate (Zn(NO3)2.6H2O, > 98%),
ferric nitrate nonahydrate (Fe(NO3)3.9H2O, > 98%),
sodium hydroxide (NaOH, > 98%), acid sulfuric
(H2SO4, 98%), sodium nitrate (NaNO3, > 98%),
potassium permanganate (KMnO4, > 98%) and
hydrogen peroxide (H2O2) supplied from Xilong
Scientific Co., Ltd (Guang-dong, China) while flake
graphite was bought from VNGraphene Co. (Ha
Noi, Viet Nam). The 5 MHz AT-cut quartz crystal
microbalance was purchased from Quartz Pro Co
(Sweden). Deionized water (DI) was used in all
experiment steps.
In order to synthesize GO NSs, a typical
process hummer was used, which is really helpful
because it is easy to make and produce in large
quantities. Furthermore, hummer method provides
GO NSs with either hydroxyl, epoxide-rich or more
carbonyl-rich [13],[14],[15] while the gas adsorption
capacity of nanomaterial has been shown to
strongly depend on active functional groups (-OH,
-COOH, C-O-C, …) or vacancies, defects.
In this study, the basic steps of hummer
method are as follow: (i) a mixture of 0.2 g flake
graphite and 0.1 g NaNO3 was added to 16 ml of
98% H2SO4. This solution was stirred for 2 hours at
room temperature. 0.8 g of KMnO4 was then slowly
added for 15 minutes. The reaction released gas
and changed the color of solution into brown. This
solution was continuously stirred for 48 hours at
room temperature. After that, 50 ml of DI was
added to dilute the solution. In the next step, an
amount of H2O2 was slowly dropped into the
solution, until the solution’s color was completely
changed into yellow. The final product was washed
and filtered by centrifugation using DI and HCl till
the pH reached 7. Additionally, the concentration of
GO NSs solution was 1.32 mg/ml.
The synthesis of ZnFe2O4 nanoparticles
(ZFO NPs) via hydrothermal method has already
been reported in our previous work. These results
indicate that the product of hydrothermal method
has high crystallinity, uniform morphology, stability,
porosity and large specific surface area. These
factors enhance gas adsorption properties [11].
Moreover, 482 mg of ZFO NPs and 3.69 ml of GO
NSs solution were dropped into 30 ml of DI, which
was quickly mixed using magnetic stirrer for 30
minutes followed by 30 minutes of ultrasonic
vibration. This two-steps process was repeated for
4 times. Finally, the as-prepared sample was dried
at 60 oC for 48 hours. Obtained GO/ZFO composite
exhibits the black powder.
2.2. Characteristics
The Raman spectra of GO/ZFO
nanocomposites were recorded by Via Micro-
Raman Microscope (Renishaw) using the
excitation laser wavelength of 633 nm while FT-IR
Jasco 4600 spectrophotometer was used to
examine the physicochemical of the as-prepared
sample in the wavenumber range of 4000 – 400
cm-1. The morphology of GO/ZFO nanocomposites
was observed by Transmission Electron
Microscopy (TEM, JOEL 1010).
2.3. Gas adsorption properties test
JSTT 2022, 2 (4), 1-8
Nguyen et al
3
In order to fabricate QCM sensor, an AT-cut
5 MHz QCM was washed by ethanol and dried by
N2 flow. Then, 80.72 µg.cm-2 of the GO/ZFO mass
density (Δmo) was coated on the QCM’s active
electrode by spray-coating method. The coating
process has been described in details in the
previous works [16]. The gas adsorption properties
of GO/ZFO nanocomposites (including: adsorption
– desorption, repeatability and adsorption
performance) were assessed through the change
of mass density on the QCM’s electrode (Δm,
µg/cm2) and the CO sorption capacity per unit
mass density of material sensing (S, ‰) [17],
respectively. In which, the CO molecules are
continuously adsorbed/desorbed by GO/ZFO
during the test experiments causing Δm, and Δm is
determined by Sauerbrey’s formula [18]:
f
f
mC
= −
(1)
where
f
is frequency shift or response of QCM
sensor in Hz; Cf = 56.6 Hz cm2/µg1 is sensitive
factor. Furthermore, the repeatability of material
sensing is visually recognized by relative error (R-
error in %), which can be calculated as followed
[16]:
1
1
.100
n
mm
R error m
−
−=
(2)
1&n
mm
are CO mass densities absorbed on
GO/ZFO sensing layer at the first and nth cycle of
the sensor. Additionally, S of GO/ZFO was
determined by formula (3):
.1000
o
m
Sm
=
(3)
In addition, limit of detection (LOD, ppm), one of
the important factors, is determined by formula (4):
3b
S
LOD S
=
(4)
Sb is the standard deviation of the response and S
is the rope of the calibration curve [19].
3. Results and Discussion
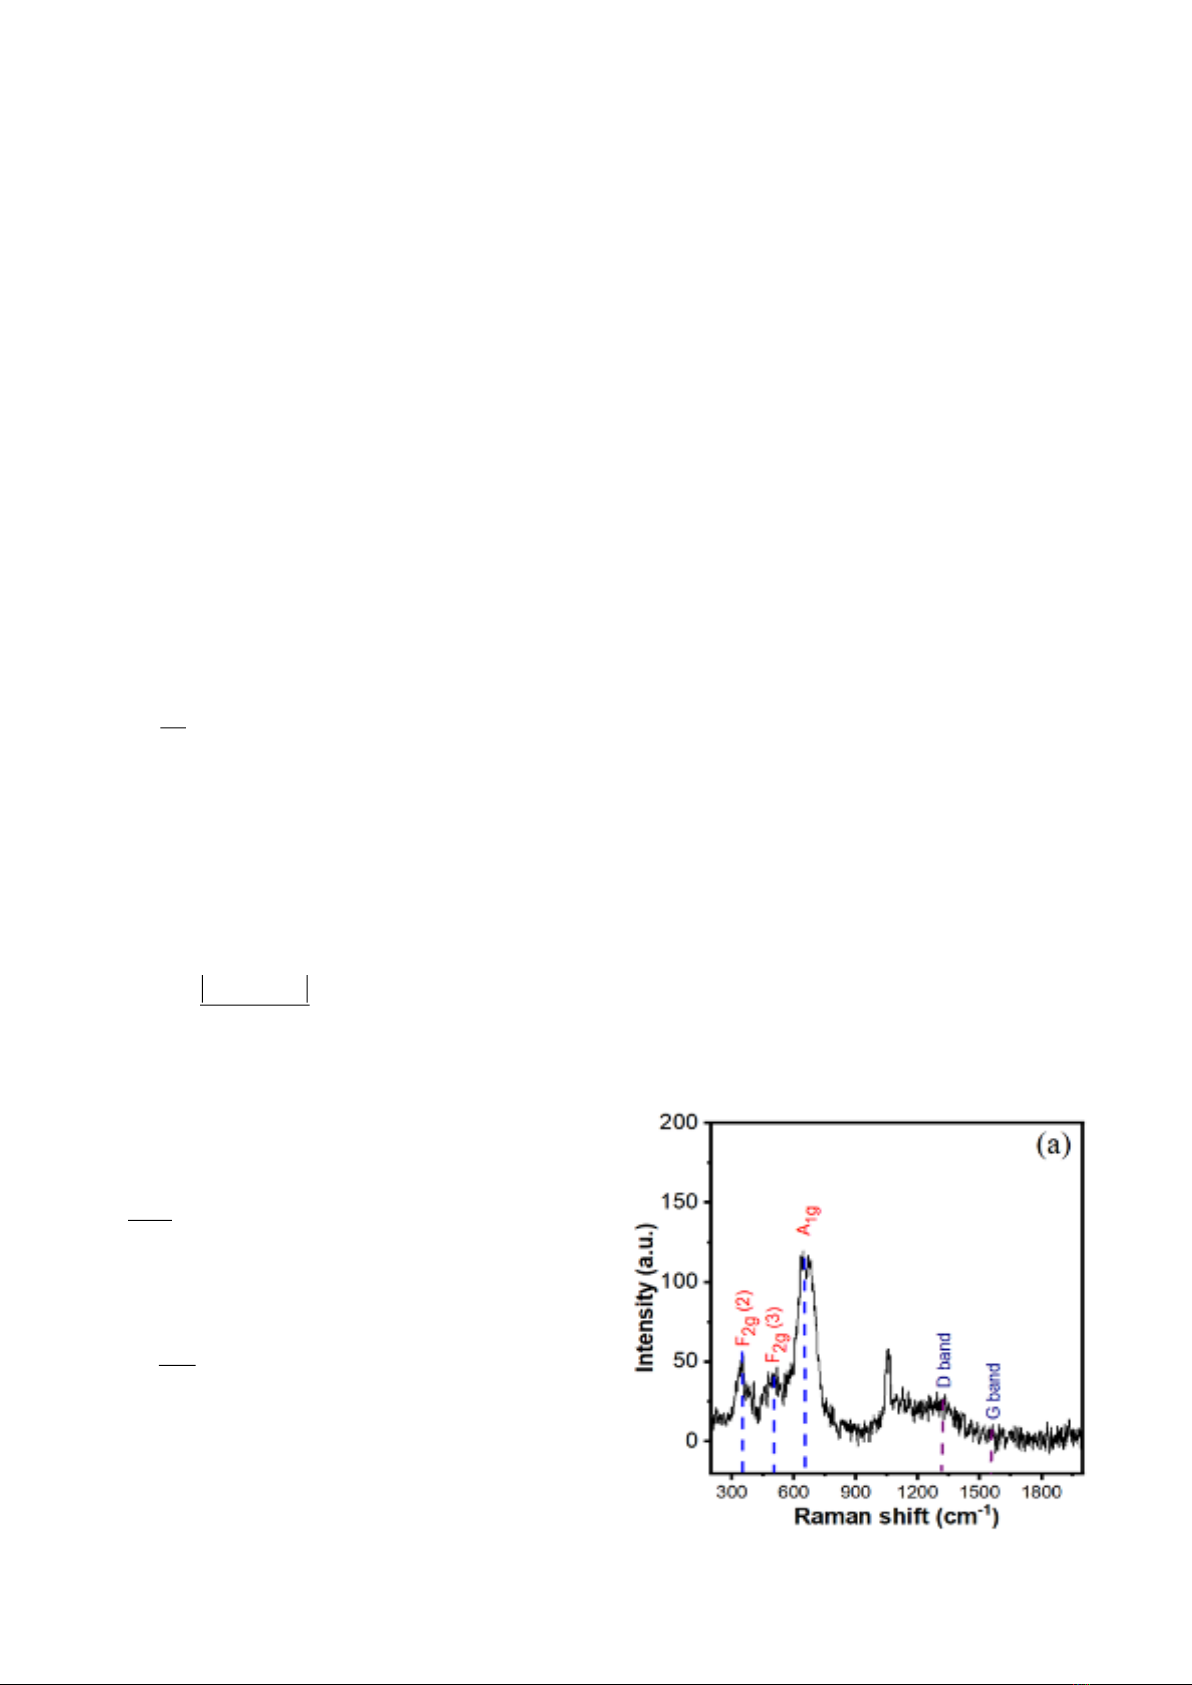
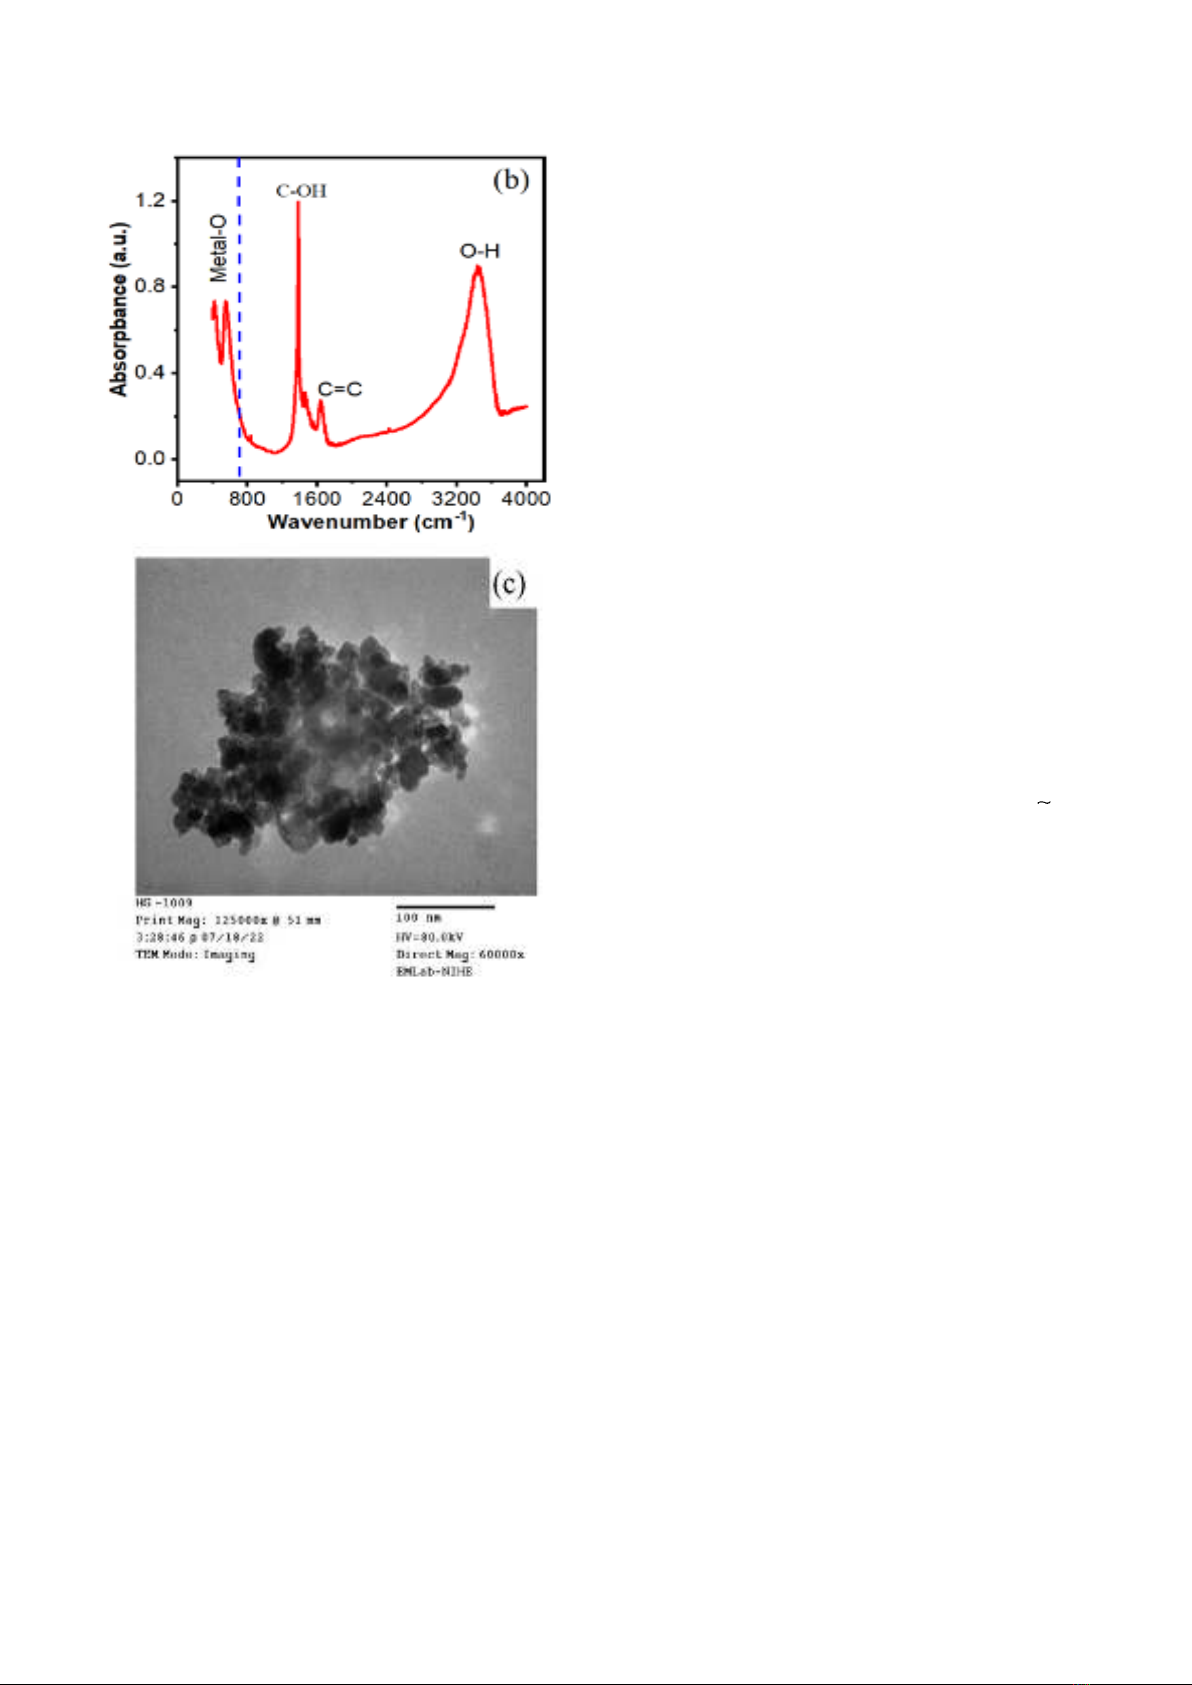
Fig.1 shows the characteristics of the as-
prepared GO/ZFO nanocomposites powder. The
three main peaks at around 353, 508, and 660 cm-
1 can be clearly observed in Raman spectra, as
depicted in Fig. 1a, which correspond to the three
first-order modes (F2g (2), F2g(3) and A1g) of
ZnFe2O4 NPs, respectively [20],[21],[22].
Moreover, two strong peaks at 1314 cm-1 and 1588
cm-1 are known as D band and G band of GO NSs,
respectively. Thus, these characteristic peaks
confirm that GO NSs and ZnFe2O4 NPs are
component of GO/ZFO nanocomposites [23]. Fig.
1b illustrates the FT-IR spectra of GO/ZFO. It
clearly shows that the adsorption peak at 3407 cm-
1 corresponds to the stretching vibration of O-H and
H-O-H, while the strongest peaks in the range of
1350 – 1650 cm-1 represent the important bindings
of GO NSs, such as: C=C (1645 cm-1) and C-O
(1381 cm-1) [24],[25]. Moreover, ferrite often has
metallic-oxygen bonds at 555 and 414 cm-1, which
were assigned to the bonds at tetrahedral site
(Mtetra – O) and octahedral site (Mocta – O) of ZFO
cubic structure, respectively [26]. The sample’s
morphology was disclosed by TEM image (Fig. 1c).
It shows that the small cubic particles are the main
shapes of ZFO in this sample, these particles size
ranges from 6 to 30 nm. On the other hand, the
pale plates on the cubic particles are assigned to
GO NSs. Thus, these results in Fig.1 indicate that
GO/ZFO nanocomposites were successfully
synthesized.
JSTT 2022, 2 (4), 1-8
Nguyen et al
4
Fig. 1. (a) Raman, (b) FT-IR and (c) TEM of
GO/ZFO
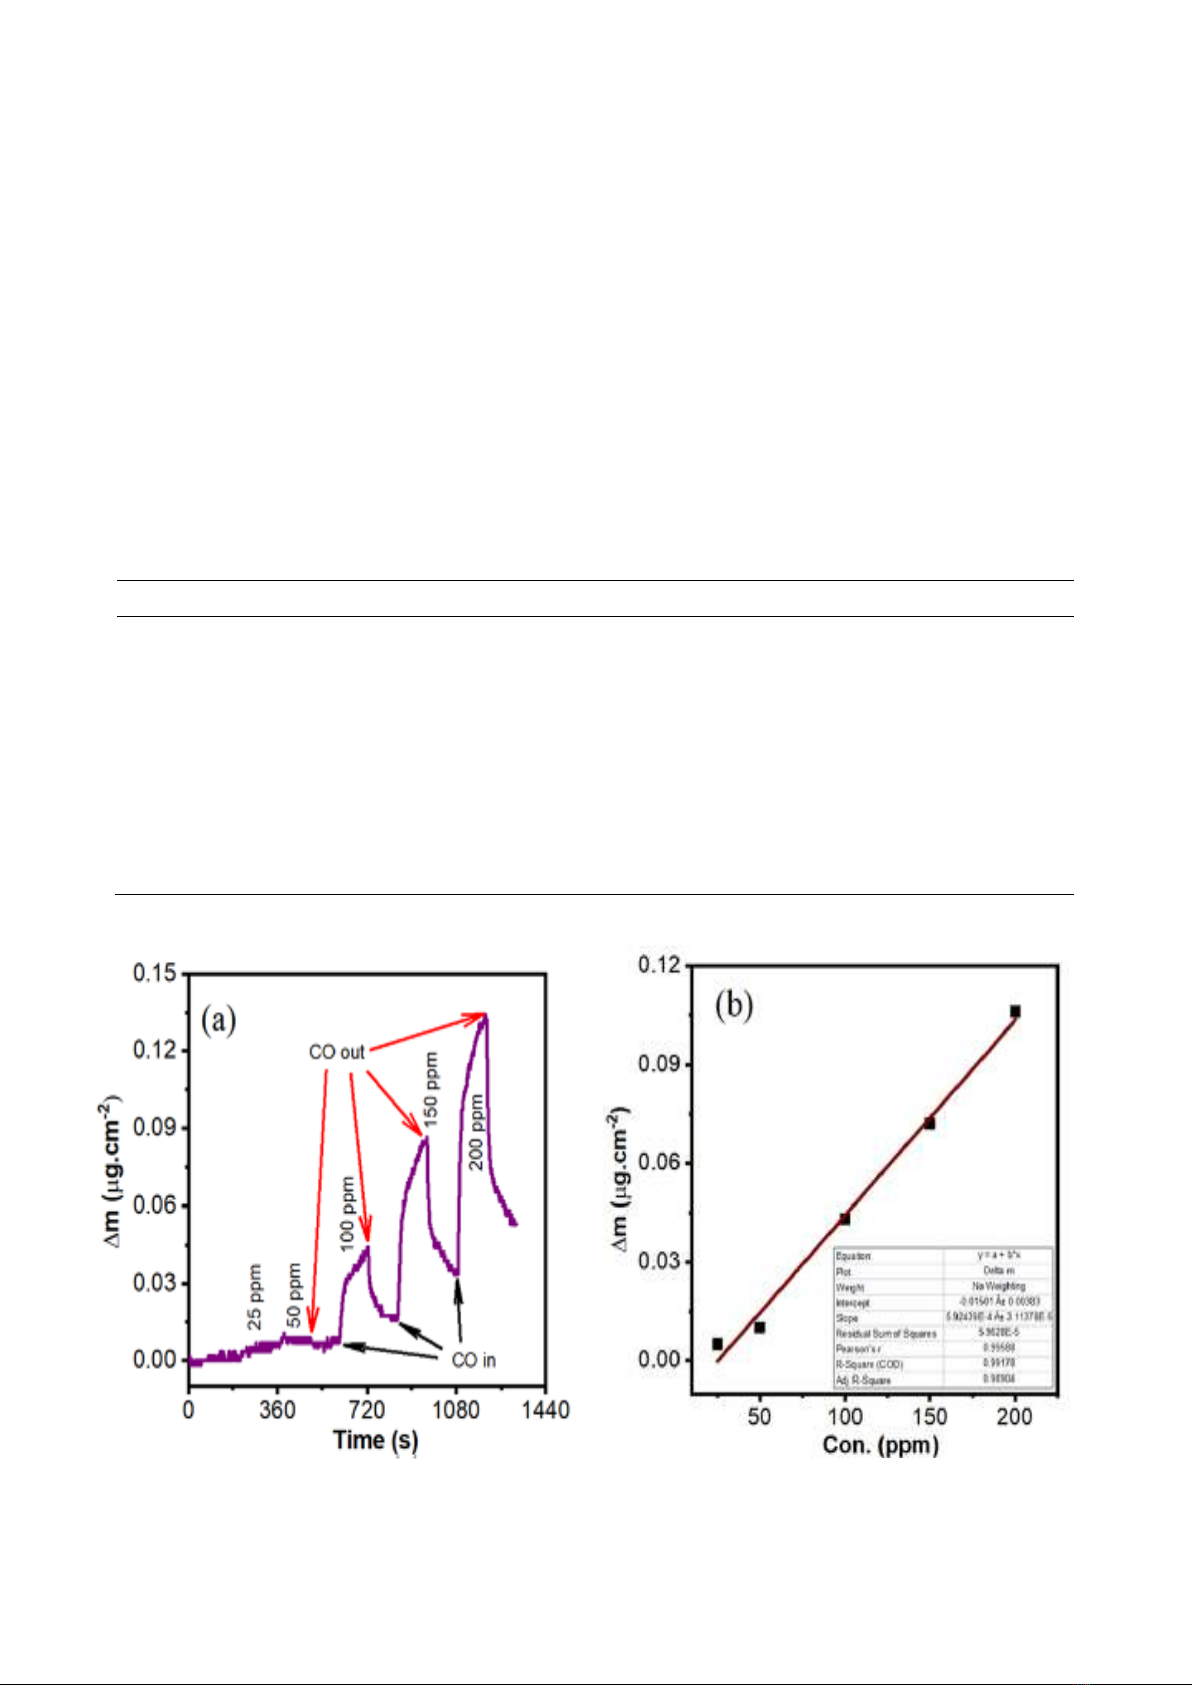
The CO adsorption/desorption kinetics were
investigated under a large concentration range of
25 – 200 ppm at room temperature using QCM.
There were two stages for each cycle test. In the
first stage, CO/N2 gas mixture was blown into the
testing gas chamber. The mass on the active
electrode increased because GO/ZFO sensing
layer tended to adsorb CO molecules, QCM sensor
responded by reducing the resonant frequency. In
the second stage, CO molecules were removed by
N2 gas flow, causing a mass decrease on the
QCM’s electrode and an increase in resonance
frequency simultaneously. The response of QCM
sensor is frequency shift, using equation (1) to
calculate the absorbed CO mass density. Fig. 2a
shows adsorption – desorption curve for five CO
expose cycles of the sensor. In other words, the
change of mass density is determined by the Δm
difference between the two times “CO in” and “CO
out” for each cycle, as shown Fig. 2a. Moreover, it
could be observed that the adsorbed mass density
significantly increases with the increasing of CO
concentration. Namely, the change of mass
densities on the QCM’s electrode was
0.005/0.010/0.034/0.069/0.098 µg.cm-2 at
25/50/100/150/200 ppm, respectively.
The adsorption performance was calculated
by formula (3), which are 0.06‰ (25 ppm), 0.12‰
(50 ppm, 0.42‰ (100 ppm), 0.85‰ (150 ppm) and
1.21‰ (200 ppm). In this case, the maximum
experiment test is 200 ppm (ppm is mean parts per
million) which is converted to 229.122 µg/l, and this
is very small concentration. Furthermore, at this
concentration, the adsorption performance is
1.21‰, that means 1000 µg of GO/ZFO
nanocomposites can absorb 1.21 µg CO ( 2.6 x
1016 CO molecules) per a square centimeter. This
is a big number in the micro world. Additionally, the
change values of mass density are illustrated in
Fig. 2b and the adsorption performance results are
compared to some references and summarized in
Table. 1. The CO adsorption performance of
GO/ZFO nanocomposites is linearly proportional to
CO concentration in the range of 25 – 200 ppm, the
correlation coefficient (R2) is 0.98904. The high
value of R2 represents the fit of linear model
between CO adsorption performance and CO
concentration. From the data in Fig. 2b, S and Sb
were calculated and had values of 5.924 x 10⁻⁴ and
3.864 x 10⁻³, respectively. Using equation (4), LOD
was calculated to have value of 19.57 ppm.
Moreover, the short averaging times of CO
exposure are recommended (remain valid) by
World Health Organization (WHO), these values
are 30.55 ppm (30 mg/m3) and 87.29 ppm (100
mg/m3) for 1 hour and 15 minutes, respectively [1].
Thus, the LOD of this research represents a great
meaning because GO/ZFO nanocomposites can
JSTT 2022, 2 (4), 1-8
Nguyen et al
5
self-adsorb CO under the recommended level.
In order to examine the repeatability, the
GO/ZFO sensor was exposed at 150 ppm for four
cycles. It is clear that the curves are identical at all
periods. The results demonstrate that the
adsorption-desorption process is good reversible,
as observed in Fig. 3. The average change of mass
density is 0.071 µg/cm-2 and the relative error is
determined by equation (2) that is 4.2%. Therefore,
GO/ZFO nanocomposites show high repeatability
adsorption/desorption at room temperature.
Fig. 4 describes the adsorption kinetics of
GO/ZFO when this sensor is exposed to 150 ppm
CO. The mass density of CO was adsorbed to the
saturation in 679 s while desorption time is only 337
s, and the change of mass density is 0.071 µg/cm2.
Moreover, the adsorption/desorption rate is
0.1046/0.2107 ng/(cm2 s), respectively. It is clear
that desorption rate is approximately twice as much
as the adsorption rate. The adsorption mechanism
of GO/ZFO sensing layer toward CO gas is based
on the interaction between active groups on the
surface of GO/ZFO and CO molecules via
hydrogen bond [10].
Table 1. Comparison between this work and reported researches
Sensing material
Con. (ppm)
S-factor (Hz/ppm)
S (‰)
References
Iron doped six
calix[4]arene
-
0.0024
-
[6]
Ferrocene
0-2000
0.0036
-
[5]
Chitosan
0-2000
0.0373
-
Ferrocene-Chitosan
0-2000
0.0544
-
GO NSs
150
0.0613
-
[10]
Fe3O4/FeOOH
150
0.0560
-
[12]
GO/ZFO nanocomposites
200
0.0369*
1.21
This work
* Using formula: S-factor = (Cf*Δm/Con.)
Fig. 2. (a) The adsorption – desorption curves of GO/ZFO sensor and (b) the relationship between
sensor adsorption performance and CO concentrations


![Bài giảng Vật lý đại cương Chương 4 Học viện Kỹ thuật mật mã [Chuẩn SEO]](https://cdn.tailieu.vn/images/document/thumbnail/2025/20250925/kimphuong1001/135x160/46461758790667.jpg)