
BioMed Central
Page 1 of 8
(page number not for citation purposes)
Journal of NeuroEngineering and
Rehabilitation
Open Access
Research
Too much or too little step width variability is associated with a fall
history in older persons who walk at or near normal gait speed
Jennifer S Brach*1, Jaime E Berlin1, Jessie M VanSwearingen1,
Anne B Newman2 and Stephanie A Studenski3
Address: 1University of Pittsburgh, Department of Physical Therapy, 6035 Forbes Tower, Pittsburgh, PA 15260, USA, 2University of Pittsburgh,
Department of Epidemiology, 6035 Forbes Tower, Pittsburgh, PA 15260, USA and 3University of Pittsburgh, Division of Geriatric Medicine, 6035
Forbes Tower, Pittsburgh, PA 15260, USA
Email: Jennifer S Brach* - jbrach@pitt.edu; Jaime E Berlin - jberlin@pitt.edu; Jessie M VanSwearingen - jessievs@pitt.edu;
Anne B Newman - newmanA@edc.pitt.edu; Stephanie A Studenski - StudenskiS@dom.pitt.edu
* Corresponding author
Abstract
Background: Decreased gait speed and increased stride time, stride length, double support time,
and stance time variability have consistently been associated with falling whereas step width
variability has not been strongly related to falls. The purpose was to examine the linear and
nonlinear associations between gait variability and fall history in older persons and to examine the
influence of gait speed.
Methods: Gait characteristics and fall history were obtained in 503 older adults (mean age = 79;
61% female) participating in the Cardiovascular Health Study who could ambulate independently.
Gait characteristics were recorded from two trials on a 4 meter computerized walkway at the
subject's self-selected walking speed. Gait variability was calculated as the coefficient of variation.
The presence of a fall in the past 12 months was determined by interview. The nonlinear association
between gait variability and fall history was examined using a simple three level classification derived
from the distribution of the data and from literature based cut-points. Multivariate logistic
regression was used to examine the association between step width variability (extreme or
moderate) and fall history stratifying by gait speed (1.0 m/s) and controlling for age and gender.
Results: Step length, stance time, and step time variability did not differ with respect to fall history
(p > .33). Individuals with extreme step width variability (either low or high step width variability)
were more likely to report a fall in the past year than individuals with moderate step width
variability. In individuals who walked ≥ 1.0 m/s (n = 281), after controlling for age, gender, and gait
speed, compared to individuals with moderate step width variability individuals with either low or
high step width variability were more likely to have fallen in the past year (OR and 95% CI 4.38
[1.79–10.72]). The association between step width variability and fall history was not significant in
individuals who walked < 1.0 m/s (n = 224).
Conclusion: Extreme (either too little or too much) step width variability is associated with falls
in the past year in older persons who walk at or near normal gait speed and not in older persons
who walk slowly (<1.0 m/s).
Published: 26 July 2005
Journal of NeuroEngineering and Rehabilitation 2005, 2:21 doi:10.1186/1743-
0003-2-21
Received: 18 March 2005
Accepted: 26 July 2005
This article is available from: http://www.jneuroengrehab.com/content/2/1/21
© 2005 Brach et al; licensee BioMed Central Ltd.
This is an Open Access article distributed under the terms of the Creative Commons Attribution License (http://creativecommons.org/licenses/by/2.0),
which permits unrestricted use, distribution, and reproduction in any medium, provided the original work is properly cited.

Journal of NeuroEngineering and Rehabilitation 2005, 2:21 http://www.jneuroengrehab.com/content/2/1/21
Page 2 of 8
(page number not for citation purposes)
Background
Variability of gait can be quantified using both temporal
and spatial gait characteristics. Variability of temporal
characteristics such as stride time, double support time
and stance time and spatial characteristics such has stride
length has been consistently associated with falling, with
increased variability being associated with fall risk [1-3].
The association between step width variability and fall
risk has been inconsistent. Gabell and Nayak suggest that
step width is related to balance control and that an
increase in step width will lead to greater stability, a pos-
sible compensation for instability [4]. In bivariate analy-
sis, step width variability was related to falls with
individuals who had fallen demonstrating reduced varia-
bility in stride width; however in multivariate analyses the
association between step width variability and future falls
was not significant [3]. Given the conflicting findings on
step width variability and the belief that step width is
believed to be related to balance control [4], we feel that
it is important to further investigate the association
between step width variability and fall risk.
When examining the association between gait variability
and falls the influence of gait speed on the relation has
often not been considered. Most of the research examin-
ing the association between gait variability and falls has
either been conducted in older persons walking at a near
normal walking speed [1] or has not included the effects
of walking speed on the association between gait charac-
teristics and falls [3]. Even though there is some evidence
to suggest that reduced gait speed is more strongly associ-
ated with fear of falling than risk of falling [3], several
studies have reported that older persons who walk slowly
are at risk for falling [5-9]. However, in individuals who
are walking at a near normal walking speed gait variability
has been shown to be a stronger indicator of fall risk than
gait speed [1]. Gait variability appears to be an early indi-
cator of fall risk in highly mobile older persons. However,
whether gait variability, specifically step width variability,
provides useful information about fall risk in people who
walk slowly is unknown. Therefore the purpose of this
manuscript is two-fold: 1) to examine the linear and non-
linear association between gait variability (especially step
width variability) and fall history and 2) to examine the
influence of gait speed on the association between gait
variability and fall history. We hypothesized that in peo-
ple who walk at a near normal gait speed that step width
variability, a gait characteristic believed to be related to
balance control, would be a better indicator of falls than
step length variability, a gait characteristic related to the
automatic stepping pattern [4]. We believe that individu-
als walking at a near normal walking speed are less likely
to have disruption of the automatic stepping pattern and
therefore are less likely to have increased step length vari-
ability (i.e. making step length variability an unlikely indi-
cator of falls in people who walk at a near normal walking
speed). Step width which is related to balance control and
not so much the automatic stepping pattern, is more var-
iable in people walking at a normal speed, thus making it
a potential indicator of fall risk in people walking at a near
normal walking speed [10].
Methods
This is a cross-sectional study of the association between
gait variability and fall history in community-dwelling
older adults. Measures of gait characteristics and fall his-
tory were obtained during a single clinic visit.
Subjects
A sample of ambulatory older adults was recruited from
the Pittsburgh site of the Cardiovascular Health Study
(CHS), a population-based, ongoing longitudinal multi-
center study of coronary heart disease and stroke risk in
community-dwelling older adults age 65 years and older
[11,12]. At the initiation of the CHS in 1989–90, individ-
uals were identified from the Health Care Financing
Administration sampling frame. Individuals who were 65
years or older, noninstitutionalized, expected to remain in
the area for 3 years and able to give informed consent were
included in the study. Individuals who were wheelchair-
bound in the home or were receiving hospice care, radia-
tion therapy or chemotherapy for cancer were excluded
[11,12]. In 1989–90 an original cohort of 5201 predomi-
nately Caucasian (i.e. > 95% Caucasian) men and women
were enrolled, and in 1992–93 a cohort of 687 African
Americans was added.
Subjects included in the analyses were men and women
from the 1998–99 clinic visit of CHS at the Pittsburgh site.
Subjects at the Pittsburgh site who could walk without the
assistance of another person, who did not use an assistive
device for ambulation, and who could follow directions
to complete the gait assessment were included (n = 503).
Measures
Gait Characteristics
The GaitMat II™ system was used for the gait analysis [13].
The GaitMat II™ consists of a 4-meter long walkway on
which the subject walks and a computer system which
controls the GaitMat II™ and analyzes the data. In addi-
tion to the 4-meter long walkway, there are initial and
final one meter inactive sections to allow for acceleration
and deceleration of the participant. The GaitMat II™ is an
automated gait analysis system based on the opening and
closing of pressure sensitive switches when the participant
walks on the walkway. After two practice passes on the
GaitMat, each subject completed two passes on the Gait-
Mat II at their self-selected walking speed for data
collection.

Journal of NeuroEngineering and Rehabilitation 2005, 2:21 http://www.jneuroengrehab.com/content/2/1/21
Page 3 of 8
(page number not for citation purposes)
We were primarily interested in gait speed and variability
of step length, step width, step time, and stance time. Step
length and width represent spatial characteristics in two
different planes. Step time and stance time were selected
as the temporal gait characteristics since they have been
widely studied by other investigators. Gait speed was
determined by dividing the time between the first and last
switch closure by the distance traversed. Step length was
determined as the distance between two consecutive foot-
prints, measured from the heel of one footprint to the heel
of the next footprint. Step width was determined as the
distance between the outer most borders of two consecu-
tive footprints. Step time was determined as the time
between initial foot-floor contact of one foot to the initial
foot-floor contact of the contralateral side for two consec-
utive steps. Stance time was determined as the time the
foot was in contact with the floor (i.e. from initial foot-
floor contact until final foot-floor contact).
Gait variability was expressed as the coefficient of varia-
tion (CV) which is SD/mean × 100. The CV for each step
length, step width, step time, and stance time was calcu-
lated using two passes on the GaitMat. Prior testing
showed no difference in right and left step CV, so both
were used to calculate the CV [10].
Fall History
Fall history over the past 12 months was obtained through
a structured interview. Participants were asked the follow-
ing: "During the past year, have you had a fall? (Do not
include falls during skiing, skating, or other activities,
such as walking on ice that may affect balance.)" Partici-
pants, who reported a fall, were then asked to report the
number of falls in the past year.
Data Analysis
Prior to data analyses the gait variability data were exam-
ined for normality. The gait variability data were relatively
normally distributed (mean values approximately equal
to median, low values for skewness and kurtosis). For step
width variability there were a few extreme outliers with
individuals having high values for step width variability.
The raw data were visually examined to make sure there
was not an error in data collection. The values were accu-
rate and were attributed to individuals crossing one foot
over the other when walking. Since these high values rep-
resented a natural phenomenon and were not due to data
collection error they were retained in the analyses. Inde-
pendent t-tests were used to compare the gait variability
data (step width, step length, stance time, and step time)
between the individuals who had reported a fall in the
past year and those who did not report a fall in the past
year for the entire sample and then stratifying by walking
speed (less than or greater than or equal to 1.0 m/s) [5,14-
16].
After discovering the large standard deviation associated
with the step width variability measure, we decided to
explore if the association between step width variability
and fall history was nonlinear. A simple four level classifi-
cation (quartiles) was used to explore the potential non-
linear association between step width variability and fall
history. Since the range of values for the lowest and high-
est quartile was much larger than the range of values for
the middle two quartiles we decided to explore the associ-
ation using a 10 level classification (deciles). Once again,
the range of values for the lowest and highest deciles were
much larger than the range of values for the middle 8
deciles so we further divided the sample by examining the
lowest and highest 5% of the sample in regards to step
width variability. The classification of step width variabil-
ity was collapsed into three groups: low step width varia-
bility (step width variability CV < 7%; lowest 5% of
sample), moderate step width variability (step width vari-
ability CV = 7–30%; middle 90% of sample), and high
step width variability (step width variability CV > 30%;
highest 5% of the sample). Fall history (% fallen in the
past year) was compared across the groups using chi-
square tests for the entire sample and then stratifying by
gait speed (less than or greater than or equal to 1.0 m/s).
A series of logistic regression models were used to exam-
ine the association between step width variability and fall
history. The first model examined the bivariate associa-
tion between step width variability and fall history. The
second model controlled for age and gender, and the third
model accounted for gait speed. The series of models was
calculated for the entire sample and then stratifying the
sample by gait speed (less than or greater than or equal to
1.0 m/s). An interaction between gait speed and step
width variability was also examined in the entire sample.
Initially, step width variability was examined as a 3 level
variable (low, moderate and high). However, after strati-
fying the sample by gait speed the numbers of subjects in
the low and high step width variability groups were low
(gait speed ≥ 1.0 m/s and low step width variability n = 3;
gait speed < 1.0 m/s and high step width variability n = 9)
so the models are presented with step width variability as
a dichotomous variable with step width either being
extreme (low or high) or moderate.
Results
Eighty-one (16%) of the 503 participants reported experi-
encing one or more falls in the past year (32 reported fall-
ing more than once). Individuals who had reported a fall
in the past year were slightly older, and more likely to be
female than individuals who had not fallen in the past
year (Table 1). The average gait speed for the sample was
1.03 m/s (SD = .21).

Journal of NeuroEngineering and Rehabilitation 2005, 2:21 http://www.jneuroengrehab.com/content/2/1/21
Page 4 of 8
(page number not for citation purposes)
In the entire sample, individuals who had reported a fall
in the past year did not differ on any of the measures of
gait variability when compared to individuals who had
not reported a fall (Table 2). Likewise, gait speed did not
differ between individuals who reported and did not
report a fall in the past year. When stratifying the sample
by gait speed, individuals who walked faster than 1.0 m/s
and reported a fall in the past year were more variable in
step width than individuals who had not fallen in the past
year (Table 3). In individuals who walked slowly (< 1.0
m/s) gait variability did not differ with respect to fall
history.
There was no association between step length, step time
and stance time variability groupings (quartiles or cut-
point based groupings) and fall history (p > .25). Step
Table 1: Characteristics of entire study cohort and stratifying by past year fall history
Total sample N = 503 No falls N = 422 ≥1 fall N = 81 P-value*
Age (years) 79.3 (4.1) 79.1 (3.9) 80.3 (5.1) .02
Weight (lbs) 154.9 (28.9) 154.8 (28.3) 155.0 (32.4) .96
Height (cm) 164.3 (9.3) 164.5 (9.4) 163.0 (9.0) .18
ADL difficulty n (%) 148 (29.4) 122 (28.9) 26 (32.1) .56
African American n (%) 113 (22.5) 93 (22.0) 20 (24.7) .80
Female n (%) 306 (60.8) 248 (58.8) 58 (71.6) .03
Gait Characteristics
Step width (m) 0.21 (.04) 0.22 (0.04) 0.21 (0.05) .46
Step length (m) 0.57 (0.09) 0.57 (0.09) 0.56 (0.10) .14
Stance time (s) 0.73 (0.09) 0.73 (0.09) 0.73 (0.10) .71
Step time (s) 0.56 (0.06) 0.56 (0.06) 0.56 (0.06) .81
Gait speed (m/s) 1.03 (0.21) 1.04 (.20) 1.02 (.23) .40
* P-values are for independent t-test comparing continuous data and chi square comparing categorical data between individuals who reported no
falls and those who reported ≥ 1 fall in the past year.
Table 2: Mean (SD) Gait Characteristics stratifying by past year fall history
No falls N = 422 ≥ 1 fall N = 81 p-value
Gait Variability CV* (%)
Step width 17.8 (16.4) 21.8 (22.6) .06
Step length 6.3 (3.0) 6.5 (3.1) .62
Stance time 4.9 (2.0) 5.2 (2.1) .33
Step time 4.7 (1.8) 4.7 (1.8) .90
*CV = coefficient of variation
Table 3: Mean (SD) gait characteristics stratifying by gait speed and past year fall history.
Gait Speed < 1.0 Gait Speed ≥ 1.0 m/s
No falls n = 185 ≥ 1 fall n = 37 p-value No falls n = 237 ≥ 1 fall n = 44 p-value
Gait Variability CV* (%)
Step width 15.6 (15.9) 15.7 (7.7) .95 19.6 (16.6) 26.8 (29.1) .02
Step length 7.5 (3.4) 7.7 (3.7) .77 5.4 (2.3) 5.5 (2.2) .77
Stance time 5.7 (2.3) 6.0 (2.3) .47 4.3 (1.5) 4.5 (1.5) .55
Step time 5.4 (1.7) 5.3 (2.1) .83 4.1 (1.6) 4.2 (1.3) .79
Gait speed (m/s) .85 (.11) .82 (.14) .11 1.18 (.13) 1.18 (.14) .98
*CV = coefficient of variation

Journal of NeuroEngineering and Rehabilitation 2005, 2:21 http://www.jneuroengrehab.com/content/2/1/21
Page 5 of 8
(page number not for citation purposes)
width variability examined as a three level categorical var-
iable (low, <7%; moderate 7–30%; or high, > 30%) was
associated with fall history in the entire sample (Figure
1A). Individuals with extreme step width variability
(either low or high) were more likely to report a fall in the
past year than individuals with moderate step width vari-
ability (p = .006); thus providing evidence that the associ-
ation between fall history and step width variability may
be nonlinear. The association remained in individuals
who walked faster than 1.0 m/s, p = .0008 (Figure 1B), but
was not significant in those who walked slowly, p = .39
(Figure 1C). The lack of significant findings in those indi-
viduals who walked slowly could possibly be attributed to
inadequate power due to the small sample size in the
extreme step width variability groups (low step width var-
iability n = 14 and high step width variability n = 9).
In the entire sample, after controlling for age, gender, and
gait speed, compared to individuals with moderate step
width variability individuals with low or high step width
variability were 2.76 times more likely to have fallen in
the past year (OR and 95% CI were 2.76 [1.40–5.45]). In
individuals who walked ≥ 1.0 m/s (n = 281), after control-
ling for age, gender, and gait speed, compared to individ-
uals with moderate step width variability individuals with
either low or high step width variability were 4.38 times
more likely to have fallen in the past year (OR and 95% CI
were 4.38 [1.79–10.72]). The association between step
width variability and fall history was not significant in
individuals who walked < 1.0 m/s (Table 4). In the entire
sample, the interaction term between gait speed and step
width variability was not significant (p = .16).
Discussion
This study of gait variability and fall history in commu-
nity-dwelling older individuals has two key findings. First,
among community-dwelling older persons ambulating
independently the association between step width varia-
bility and fall history was nonlinear. Consistently it has
been shown that increased variability of stride length,
stride time, and stride speed are related to falls [2,3,17],
where as decreased step width variability has been only
associated with falls during walking in one research report
[3]. The lack of significant findings associating step width
variability with fall history may be the result of assuming
a linear relationship between step width variability and
falls. For step width variability the normal situation is to
have a moderate amount of variability. We discovered
that not only having too little step width variability but
also having too much step width variability was associ-
ated with a history of falls.
Gabell and Nayak suggest that step width is related to bal-
ance control and that an increase in step width variability
could indicate a lack of compensation for instability [4].
Both young and older person who have not fallen demon-
strate an increased level of step width variability (median
step width variability in young and old is 20.62 and
26.84, respectively) compared to variability of other gait
characteristics such as step length (median step length
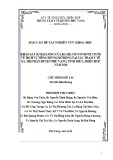
Percent of participants who reported a fall in the past year by amount of step width variability (low, moderate, or high) for (A) the entire sample, (B) individuals with a gait speed ≥ 1.0 m/s, and (C) individuals with a gait speed < 1.0 m/s (C)Figure 1
Percent of participants who reported a fall in the past year by
amount of step width variability (low, moderate, or high) for
(A) the entire sample, (B) individuals with a gait speed ≥ 1.0
m/s, and (C) individuals with a gait speed < 1.0 m/s (C). P-val-
ues are for Chi-square.
Low
(n=17)
Moderate
(n=457)
High
(n=31)
0
5
10
15
20
25
30
35
40
45
50
Step Width Variability
% Fallen Past Year
Low
(n=3)
Moderate
(n=256)
High
(n=22)
0
10
20
30
40
50
60
70
Step Width Variability
% Fallen Past Year
Low
(n=14)
Moderate
(n=199)
High
(n=9)
0
5
10
15
20
25
30
35
40
45
50
Step Width Variability
% Fallen Past Year
(A)
(B)
(C)
P=0.006
P=0.0008
P=0.39


![Bộ Thí Nghiệm Vi Điều Khiển: Nghiên Cứu và Ứng Dụng [A-Z]](https://cdn.tailieu.vn/images/document/thumbnail/2025/20250429/kexauxi8/135x160/10301767836127.jpg)
![Nghiên Cứu TikTok: Tác Động và Hành Vi Giới Trẻ [Mới Nhất]](https://cdn.tailieu.vn/images/document/thumbnail/2025/20250429/kexauxi8/135x160/24371767836128.jpg)


