
16 Nguyen Hong Phuc, Tran Thanh Truc, Lieu Kim Hia, Vo Tran Thi Bich Chau
AN OPTIMIZATION MODEL FOR CROP ALLOCATION TO
MAXIMIZE PROFIT UNDER CARBON TARIFFS AND
INTERNATIONAL CARBON CREDIT MARKETS
MÔ HÌNH PHÂN BỔ CÂY TRỒNG NHẰM TỐI ĐA LỢI NHUẬN TRONG
BỐI CẢNH THUẾ QUAN CARBON VÀ THỊ TRƯỜNG TÍN CHỈ CARBON QUỐC TẾ
Nguyen Hong Phuc*, Tran Thanh Truc, Lieu Kim Hia, Vo Tran Thi Bich Chau
College of Engineering, Can Tho University, Vietnam
*Corresponding author: nguyenhongphuc@ctu.edu.vn
(Received: June 01, 2025; Revised: July 21, 2025; Accepted: August 05, 2025)
DOI: 10.31130/ud-jst.2025.23(9A).290
Abstract - In response to global climate change challenges, many
agricultural-importing countries have tightened environmental
policies, notably through the implementation of carbon tariffs to
control greenhouse gas (GHG) emissions. To address this issue,
the research team developed a linear programming (LP)
optimization model to determine an efficient crop structure that
maximizes profits under carbon tariff constraints. To evaluate the
feasibility of this model, a simulation scenario based on reference
data in the Mekong Delta (MD) was proposed as a representative
case study. The results indicate that the model not only improves
land-use efficiency and profitability but also expands
opportunities for participation in the international carbon credit
market. This research provides practical insights for promoting
sustainable agriculture and enhancing the competitiveness of
Vietnamese agricultural products in the international market.
Tóm tắt - Trước thách thức toàn cầu về biến đổi khí hậu, nhiều
quốc gia nhập khẩu nông sản đã siết chặt chính sách môi trường,
đặc biệt là áp dụng thuế quan carbon nhằm kiểm soát phát thải khí
nhà kính (GHG). Nhằm tìm ra giải pháp thích ứng, nhóm nghiên
cứu đã xây dựng mô hình tối ưu hóa tuyến tính (LP) giúp xác định
cơ cấu cây trồng hợp lý và tối đa hóa lợi nhuận trong điều kiện
chịu tác động của thuế carbon. Để đánh giá tính khả thi của mô
hình này, một kịch bản giả lập theo dữ liệu tham khảo ở vùng
Đồng bằng sông Cửu Long (ĐBSCL) được đề xuất làm trường
hợp nghiên cứu điển hình. Kết quả cho thấy mô hình không chỉ
nâng cao hiệu quả sử dụng đất và lợi nhuận, mà còn góp phần mở
rộng cơ hội tham gia thị trường tín chỉ carbon. Nghiên cứu mang
ý nghĩa thực tiễn trong việc định hướng phát triển nông nghiệp
bền vững và tăng khả năng cạnh tranh của nông sản Việt Nam
trên thị trường quốc tế.
Key words - Carbon tariffs; Linear programming (LP); crop
allocation; sustainable agriculture; Carbon credits.
Từ khóa - Thuế quan carbon; tối ưu hóa tuyến tính; cơ cấu cây
trồng; nông nghiệp bền vững; tín chỉ carbon.
1. Introduction
The Mekong Delta (MD) is a key agricultural production
area in Vietnam, accounting for 33.5% of the country’s total
fruit cultivation area. Benefiting from favorable climatic
conditions and an extensive irrigation system, this region
plays a pivotal role in ensuring both national and
international food security. In 2024, the export value of
agricultural products reached a record USD 7.12 billion,
with the MD making significant contributions, especially
with fruits such as durian, dragon fruit, banana, mango, and
jackfruit. China is the largest consumer market, followed by
the United States, the EU, Japan, and South Korea.
However, fruit export activities in Vietnam in general
and the MD in particular are facing an urgent need for
transformation to adapt to increasingly stringent
environmental regulations from international markets. The
rise in greenhouse gas (GHG) emissions has prompted
many importing countries to implement control measures
such as carbon tariffs. Although these barriers currently do
not exert excessive direct pressure, they signal a tightening
trend in the near future. This requires Vietnam’s
agricultural sector, especially enterprises with limited
resources, to gradually transition to sustainable production
models to maintain export advantages and enhance long-
term competitiveness.
In this context, carbon credits are receiving increasing
attention, and the exploitation of carbon credits in
agriculture is emerging as a promising direction. Besides
forests, fruit trees in the MD, particularly perennial species
such as durian, mango, and star apple, have the capacity to
absorb CO₂ and participate in the carbon credit market if
sustainable cultivation practices are adopted. This not only
helps the agricultural sector mitigate costs associated with
carbon tariffs but also creates additional revenue streams,
enhances product value, and increases the competitiveness
of Vietnamese agricultural products in the global market.
Therefore, this study proposes a linear programming
(LP) optimization model ([1],[2]) for allocating areas to
potential crops, integrating emission and carbon credit
factors to maximize profit on a given land area and help
enterprises better adapt to changing market requirements.
2. Literature review
2.1. Crop allocation using traditional cultivation methods
Crop allocation has long been a concern, primarily in
the context of traditional cultivation, with the goal of
efficient land use to maximize yield and profit for farmers.
In summary, several key factors such as crop variety,
soil conditions, and management practices have been
identified as having significant impacts on productivity,

ISSN 1859-1531 - TẠP CHÍ KHOA HỌC VÀ CÔNG NGHỆ - ĐẠI HỌC ĐÀ NẴNG, VOL. 23, NO. 9A, 2025 17
forming the foundation for subsequent modern research
directions [3].
Building on this, recent studies have approached the
issue quantitatively and through technological
applications. For example, a study in Northeast China
employed a multi-criteria evaluation (MCE) method
combined with GIS to determine the suitability of rice,
soybean, and maize under local natural conditions, thereby
proposing a crop rotation model to improve land-use
efficiency and ensure food security [4]. Additionally,
researchers have focused on optimizing crop diversity by
applying mathematical models such as linear programming
and optimization algorithms to assist farmers in making
rational decisions regarding crop type, timing, and planting
area, thus enhancing production efficiency [5], [6].
2.2. Crop allocation following sustainable trends
Amid the growing need for optimizing agricultural land
use, sustainable crop allocation is becoming an important
orientation in agricultural planning and development.
Various land suitability assessment methods, such as the
FAO framework, MCDA, AHP, and GIS, facilitate the
selection of crops compatible with natural conditions,
optimizing economic efficiency and protecting soil
resources [7]. Moreover, crop optimization models play a
crucial role in rational land allocation, not only increasing
profits but also reducing resource dependency, thereby
promoting sustainable cultivation [8].
Linear programming (LP)-one of the most widely used
tools in crop optimization models-enhances land allocation
efficiency and fosters sustainable cultivation. For instance,
Sofi et al. applied the simplex method to adjust the
allocation of wheat, rice, beans, and maize, expanding the
area from 2,409 to 2,752.56 acres, resulting in higher
profits [9]. Similarly, Bhatia and Bhat utilized an LP model
to optimize crop structure, achieving an income of 156,499
Rs by switching from a mixed crop of wheat, grapes, and
mustard to peas [10]. In 2020, Bhatia and Rana proposed
two scenarios combining crop and livestock farming,
improving land allocation efficiency to 68% on farm 1 and
16.5% on farm 2, while also enhancing soil quality and
reducing production costs [11]. Additionally, research by
Alotaibi and Nadeem highlighted the role of LP in
identifying high-value crops and efficiently allocating area
to maximize profit [12].
2.3. Crop allocation considering carbon emissions
A study was conducted by integrating life cycle
assessment (LCA) with the Monte Carlo method to
estimate the carbon footprint of rice, maize, and soybean
production in various cities in Northeast China. The
research proposed crop allocation strategies combined with
staged fertilization [13]. In Turkey, Başer et al.
investigated land fragmentation in hazelnut cultivation,
revealing that fragmented farms have 11.74% higher GHG
emissions than non-fragmented ones, emphasizing the
importance of land management to minimize emissions
[14]. Furthermore, a study on soil CO₂ flux changes
indicated that cultivating soybeans and eucalyptus could be
a low-carbon farming strategy, reducing environmental
impact and supporting carbon neutrality goals in
agriculture [15].
2.4. Carbon credits and markets
Recent studies on sustainable agriculture not only focus
on profit optimization but also open up opportunities to
participate in the carbon credit market. Meena et al.
demonstrated that conservation agriculture, agroforestry,
and land conversion could reduce CO₂ emissions by 20–
30%, while providing opportunities to earn income from
carbon credits [16]. Other studies also affirm that carbon
credits can promote emission reductions and increase
income, but simplifying measurement and providing
financial support for farmers are essential for effective
participation, although technical and financial barriers
remain [17].
The current carbon market includes two main types:
mandatory markets, such as Emissions Trading Systems
(ETS), and voluntary markets, where businesses purchase
carbon credits to offset emissions and meet ESG standards.
Regions like the EU, China, and several US states have
implemented these systems, promoting sustainable
production and mitigating climate change impacts. In
Vietnam, the carbon market is being developed under
Decree 06/2022/NĐ-CP, with a pilot planned for 2025 and
official operation in 2028. Currently, carbon credit
transactions mainly occur in the voluntary market due to
the absence of an official trading platform. Participation in
the carbon credit market also creates new financial
opportunities through the sale of carbon credits from
sustainable agricultural activities [18].
Challenges from the carbon market also present
significant opportunities as low-emission farming models
are deployed. In the MD, the project for one million
hectares of high-quality, low-emission rice aims to reduce
5–10 tons of CO₂/ha/year, equivalent to 5–10 carbon
credits, generating profits of USD 50–100 [19]. In Đắk
Lắk, a similar model helps reduce about 3.5 tons of CO₂/ha,
increase yields, and improve farmers’ incomes through
carbon credit sales and reduced production costs [20].
2.5. Crop allocation considering the impact of carbon
tariffs
Although relatively new, research on the impact of
carbon tax policies and land-use changes on GHG
emissions is gaining attention, reflecting a growing global
awareness of agriculture’s role in climate change
mitigation.
Climate simulation models show that combining
increased crop productivity with the implementation of
global carbon tariffs can limit the expansion of cultivated
land, thereby effectively reducing emissions. Additionally,
research in Chile indicated that imposing sector-specific
taxes on agriculture leads to significant economic losses
and low emission reduction efficiency, whereas
comprehensive carbon taxes combined with forestry
subsidies achieve higher environmental effectiveness with
minimal impact on growth. These findings suggest that
carbon taxes are only truly effective when implemented
synchronously with appropriate support policies, in which
18 Nguyen Hong Phuc, Tran Thanh Truc, Lieu Kim Hia, Vo Tran Thi Bich Chau
crop allocation strategies must consider both economic
benefits and environmental objectives [21]. These two
goals should be pursued in parallel in the long-term
development strategies of agricultural enterprises.
2.6. Contribution of the study
Table 1. Review of related literature
Year
Author
Crop Allocation
Model
Method and
Algorithm
A
B
C
D
E
2005
Donal J
Mead
✓
Literature Review,
Modeling and
Forecasting
2011
Nordin
Mohamad
✓
LP
2012
Wankhade
✓
LP, Push – Pull
System
2013
Ruohong
Cai
✓
Stochastic Modeling,
Dynamic Optimization
Model
2014
Davies
Barnard
✓
✓
✓
Hadley Centre Global
Environment Model
version 2 – Earth
System
2015
Sofi
✓
LP
2016
Chiranjit
Singha
✓
Literature Review
2017
Sara Osama
✓
LP, GA
2017
Mohammadi
✓
✓
LP, Interger Linear
Programming
2019
Mahak
Bhatia
✓
LP
2020
Mahak
Bhatia
✓
LP
2020
Cristian
Mardones
✓
CGE (Computable
General Equilibrium)
2021
Alanoud M
Alotaibi
✓
LP, Parametric
Programming
2021
Ge Song
✓
✓
Agent-based Land
Allocation Modeling,
Multi-Criteria
Evaluation (MCE)
2022
Nimanthika
Lokuge
✓
✓
Qualitative Analysis,
Literature Review
2023
Hoàng
Đông
✓
✓
MRV (Measurement,
Reporting and
Verification)
2024
Jin Sai
Chen
✓
✓
Monte Carlo, Life
Cycle Assessment
2024
Paulo
Eduardo
Teodoro
✓
✓
Principal Component
Analysis
2024
Uğur Başer
✓
✓
Life Cycle
Assessment, Partial
Budgeting Analysis
2024
Ram
Swaroop
Meena
✓
✓
Quantitative Analysis,
Qualitative Analysis,
Literature Review
A: Conventional Approach; B: Sustainable Approach;
C: Carbon-Conscious Planting; D: Incorporates Tax Policy;
E: Integrates Carbon Credit Mechanisms
Based on the studies summarized in Table 1, it can be
seen that most current research focuses on the relationship
between crop allocation and emission reduction, without
fully integrating factors such as profit, carbon tariffs, and
carbon credits. The lack of such integrated analyses creates
a gap in the development of comprehensive decision-
making models. In particular, key factors such as carbon
emissions, the impact of tariffs on crop structure, and
trading opportunities for optimizing profits have not been
thoroughly considered.
Driven by these practical requirements, the proposed
optimization model aims to enhance the efficiency of fruit
crop area allocation, thereby maximizing profit for
producers. The model simultaneously incorporates
emerging factors such as carbon tariffs in major export
markets, helping enterprises to proactively adapt to policy
changes. Additionally, the model considers the CO₂
absorption capacity of perennial fruit trees, opening up
pathways for accessing the carbon credit market as a
supplementary source of income.
3. Model development
3.1. Problem description
This study develops a linear programming (LP)
optimization model [12] for planning the cultivation area
of export-oriented crops in the context of international
economic integration and the need to improve agricultural
resource management efficiency. As the global market
imposes stricter environmental standards, especially
regarding carbon emissions from imported agricultural
products, agricultural production organizations face the
challenge of balancing economic efficiency with
environmental responsibility.
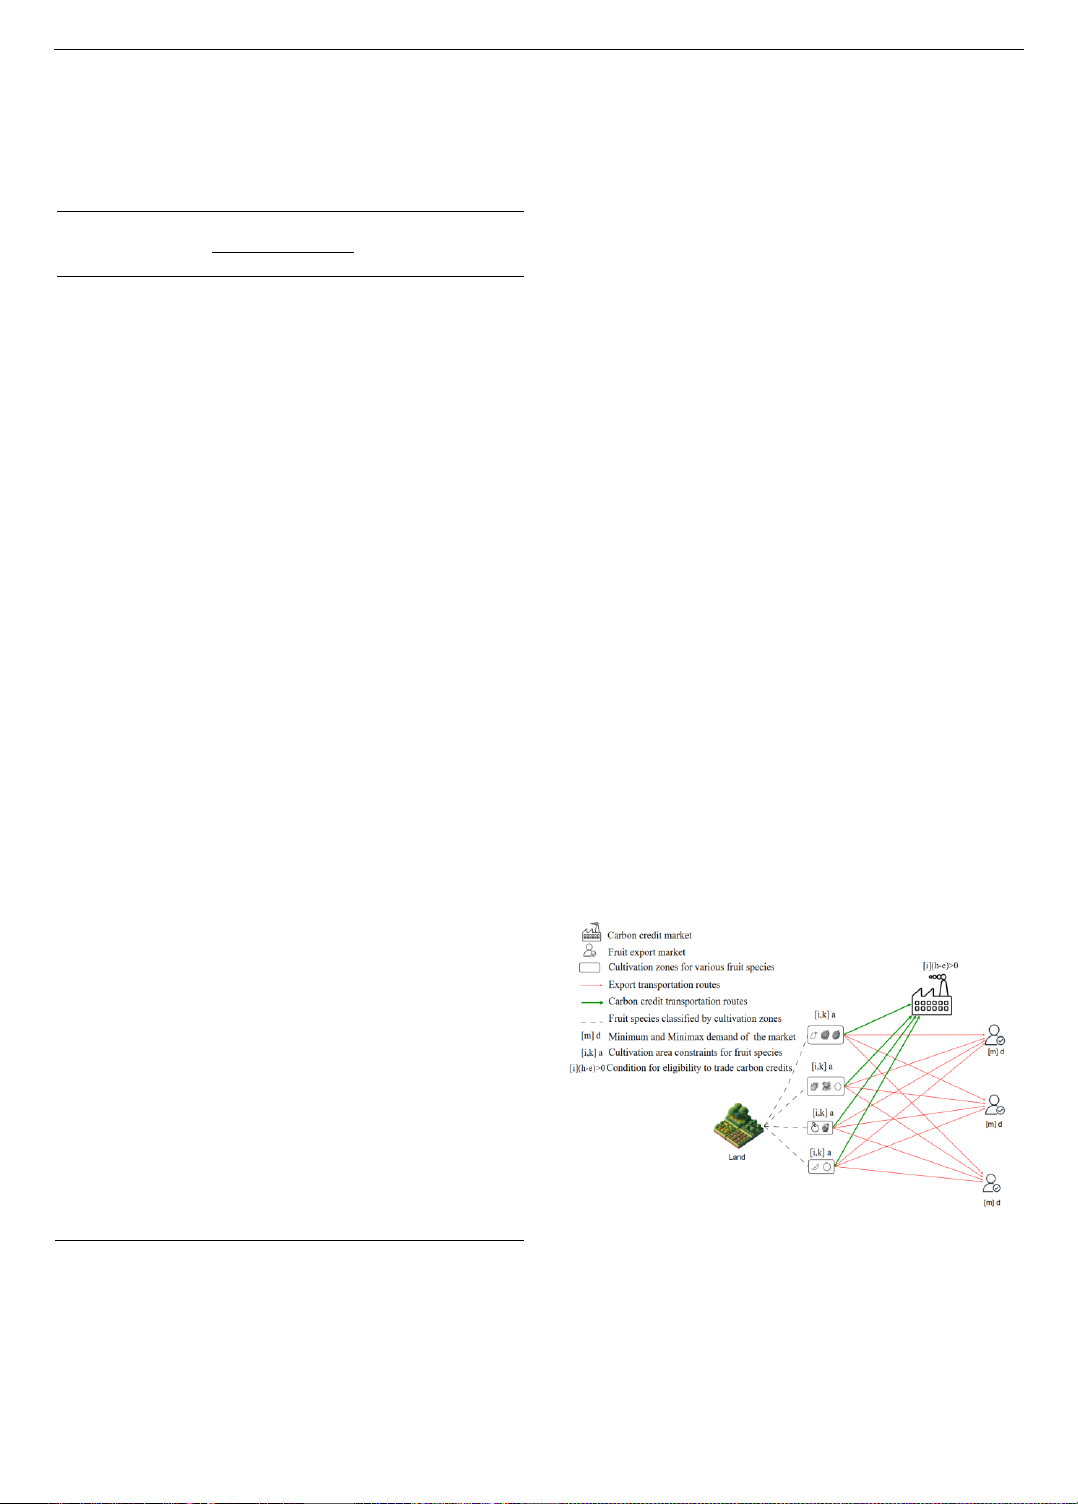
The crop allocation model is described in the overview
diagram in Figure 1. Harvested products from these areas
can be distributed in two main directions:
- Exporting fruits to consumer markets, ensuring
minimum and maximum demand compliance.
- Selling carbon credits when environmental
requirements are met (i.e., net carbon absorption exceeds
emissions), opening opportunities for additional income.
Figure 1. Problem description diagram
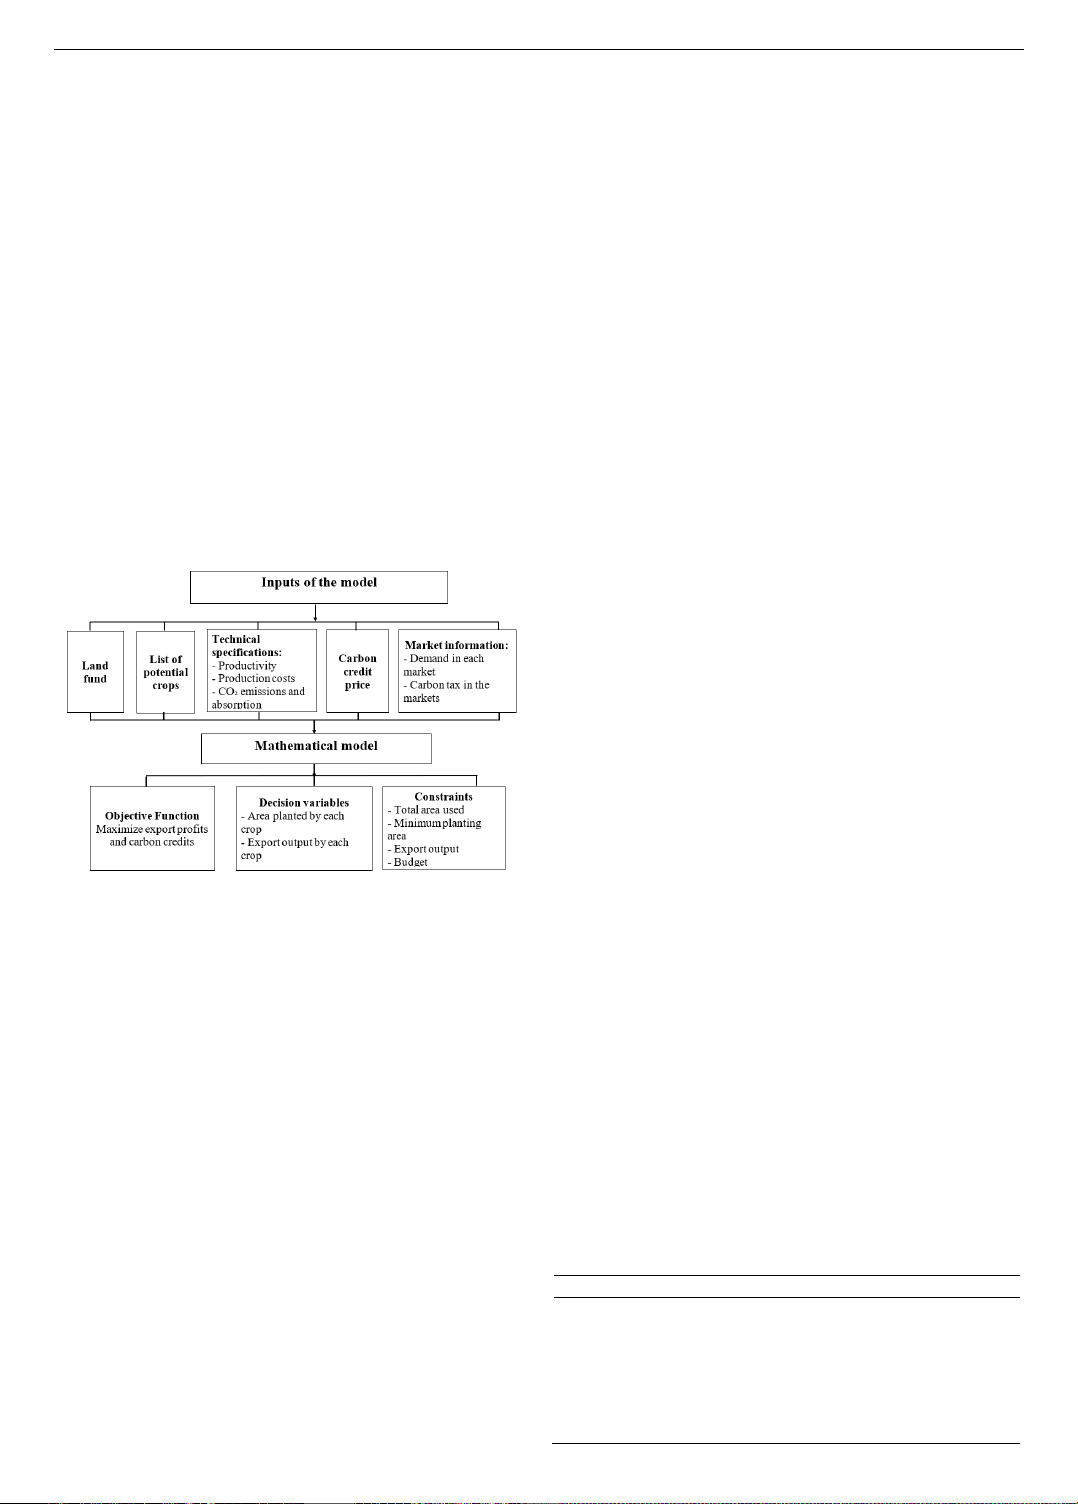
This study focuses on developing an optimization
model for allocating crop areas over a specific time period
(Figure 2), aiming to:
-
Maximize profit from fruit exports.
-
Ensure carbon emission standards and leverage the
carbon credit market.
-
Ensure carbon emission standards and leverage the
carbon credit market.
ISSN 1859-1531 - TẠP CHÍ KHOA HỌC VÀ CÔNG NGHỆ - ĐẠI HỌC ĐÀ NẴNG, VOL. 23, NO. 9A, 2025 19
Model assumptions:
-
Ensure carbon emission standards and leverage the
carbon credit market.
-
Ensure carbon emission standards and leverage the
carbon credit market.
-
Ensure carbon emission standards and leverage the
carbon credit market.
-
Ensure carbon emission standards and leverage the
carbon credit market.
-
Profit from carbon credits is calculated by multiplying
net positive CO₂ absorption by the carbon credit price. Since
Vietnam’s mandatory carbon market is not yet officially
operational, this study uses reference prices from the
international voluntary carbon market. Specifically, data are
sourced from the Verra – Verified Carbon Standard (VCS)
system and the State of the Voluntary Carbon Markets 2024
report by Ecosystem Marketplace [22].
-
The model calculates profit based on nominal annual
values without discounting cash flows to present value, to
simplify the comparison of alternatives during the initial
implementation phase.
Figure 2. Mathematical Model Development Flowchart
Parameters:
𝑎𝑘
Total area of region 𝑘.
𝑑𝑚𝑎𝑥𝑖,𝑡,𝑚
Maximum export demand for crop 𝑖 in year
t
in market 𝑚.
𝑑𝑚𝑖𝑛𝑖,𝑡,𝑚
Minimum export demand for crop 𝑖 in year
t
in market 𝑚.
𝑙𝑖,𝑚,𝑡 Export profit for crop i in year t in market m.
𝑞𝑖,𝑡,𝑚 Carbon tariff for crop i in year t in market m.
𝑝𝑖,𝑡 Carbon profit for crop 𝑖 in year t.
𝑐𝑖,𝑡 Cultivation cost for crop i in year t.
𝑟𝑖,𝑡 Yield of crop i in year t.
𝑠𝑖 Minimum area required for crop i to achieve
economic efficiency.
𝑣𝑖,𝑡,𝑚 Export cost for crop 𝑖 in year t in market m.
𝑤𝑘,𝑖 Assigned value of 1 if crop i is suitable for region k,
otherwise 0.
Decision variables:
𝑋𝑘,𝑖
Area of crop 𝑖 in region
k
.
𝑌𝑖,𝑡,𝑚
Export output of crop 𝑖
in year
t
in market
m
.
Objective function:
The objective function is to maximize profit from fruit
exports and carbon credit sales. Specifically, the problem
seeks the optimal values for the area allocated to each crop
and export output.
𝑀𝑎𝑥: 𝑍=∑ ∑(∑((𝑙𝑖,𝑡,𝑚
𝑀
𝑚=1 −𝑞𝑖,𝑡,𝑚)𝑌𝑖,𝑡,𝑚
𝐼
𝑖=1
𝑇
𝑡=1 )
+ ∑𝑋𝑘,𝑖.(𝑝𝑖,𝑡 −𝑐𝑖,𝑡)
𝐾
𝑘=1 ) (1)
Constraints include:
Land area limitation:
∑𝑋𝑘,𝑖
𝐼
𝑖=1 ≤𝑎𝑘,∀𝑘 (2)
The total area allocated to all crops i in region k must
not exceed the available area 𝑎𝑘.
Land allocation in each region:
𝑤𝑘,𝑖𝑠𝑖≤𝑋𝑘,𝑖 ≤𝑤𝑘,𝑖𝑎𝑘,∀𝑘,𝑖 (3)
The area for crop i must not be less than the minimum
required 𝑠𝑖 for economic efficiency and must not exceed
the total available area in region k.
Export output limitation:
∑𝑌𝑖,𝑡,𝑚
𝑀
𝑚=1 ≤𝑟𝑖,𝑡∑𝑋𝑘,𝑖
𝐾
𝑘=1 ,∀𝑖,𝑡 (4)
The total export output of crop i to all export markets
must not exceed the actual harvested yield.
Market demand:
𝑑𝑚𝑖𝑛𝑖,𝑡,𝑚 ≤𝑌𝑖,𝑡,𝑚 ≤ 𝑑𝑚𝑎𝑥𝑖,𝑡,𝑚,∀𝑖,𝑚,𝑡 (5)
Export output must meet the minimum requirement to
maintain market share but not exceed the maximum demand.
Budget constraint:
∑ ∑ (𝑐𝑖,𝑡𝑋𝑘,𝑖
𝐼
𝑖=1
𝐾
𝑘=1 ) + ∑ ∑ 𝑌𝑖,𝑡,𝑚(𝑞𝑖,𝑡,𝑚 +
𝐼
𝑖=1
𝑀
𝑚=1
𝑣𝑖,𝑡,𝑚)≤𝑏𝑡,∀𝑡 (6)
Ensures that the total production and export costs in
year t do not exceed the available budget 𝑏𝑡.
Non-negativity of decision variables:
𝑋𝑘,𝑖,𝑌𝑖,𝑚,𝑡 ≥0,∀𝑖,𝑘,𝑡,𝑚 (7)
4. Experimental results
4.1. Case study description
The case study is based on an agricultural cooperative
in the Mekong Delta (MD), which owns a land fund of 350
hectares divided into four areas with distinct
characteristics, each suitable for different crop types. The
harvested products are exported to three major markets: the
United States, the EU, and China. The model is designed
to plan crop cultivation over a 10-year period with the
objective of maximizing profit.
Table 2. Crop allocation and land use per region
Land type
Area (ha)
Crops
Alluvial soil along rivers
140
Mango, Durian,
Jackfruit
Sandy loam soil along
rivers
105
Dragon fruit, Coconut,
Passion fruit
Elevated well-drained land
70
Banana, Star apple
Slightly saline and acidic
alluvial soil
35
Pomelo, Orange
20 Nguyen Hong Phuc, Tran Thanh Truc, Lieu Kim Hia, Vo Tran Thi Bich Chau
4.2. Experimental results
The optimization model was solved using IBM ILOG
CPLEX 12.6 software, executed on a computer with a Core
(TM) i5-11320H 3.20GHz processor and 8.00 GB RAM.
The results show that the objective function value reached
VND 1,244 billion, with the following breakdown:
• Carbon tax cost: VND 48.33 billion;
• Cultivation cost: VND 636.54 billion;
• Export profit: VND 1,895 billion;
• Carbon credit profit: VND 33.85 billion.
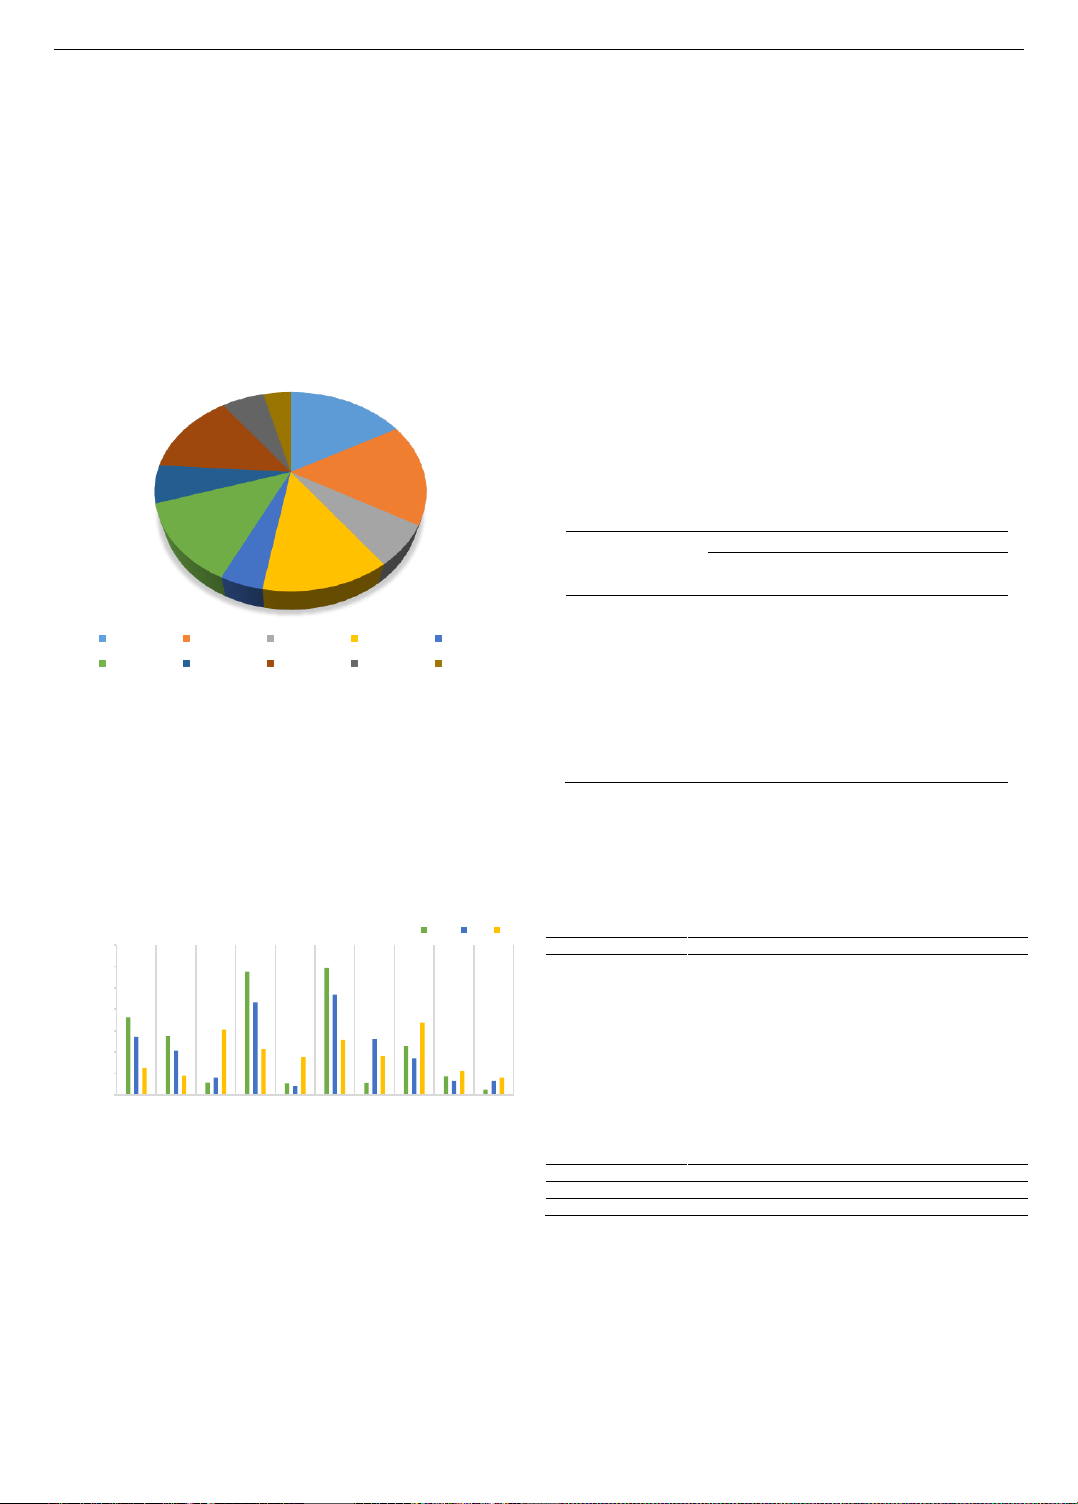
Figure 3. Land use allocation per crop type
Figure 3 illustrates the allocation of land area for each
crop type. The results indicate that mango and durian are
prioritized, occupying the largest areas (17% and 16%,
respectively), followed by dragon fruit, passion fruit, and
star apple, which have similar proportions. This reflects the
high economic efficiency and strong adaptability of these
crops to their respective soil types.
Figure 4. Export volumes of fruit crops by market
Differences in consumption levels and carbon tariff
rates across markets are reflected in the allocation of export
output. Figure 4 shows that the model optimizes crop
structure and output distribution to maximize market
advantages: passion fruit and dragon fruit are prioritized
for export to the US and EU due to higher selling prices
and carbon credit opportunities, while crops such as
jackfruit, star apple, pomelo, and orange are focused on the
Chinese market, which has more accessible requirements.
Allocating output according to market characteristics
enables enterprises to proactively optimize profits by
leveraging high prices, favorable carbon tariff rates, and
regional consumer preferences.
4.3. Sensitivity analysis
Sensitivity analysis was conducted to assess the impact
of key parameters on the optimal results, including export
profit, carbon profit, carbon tax, cultivation cost, yield,
minimum and maximum demand. This analysis supports
effective decision-making in the context of constantly
changing real-world conditions. The analysis focuses on:
- The individual impact of each factor on the objective
function value.
- The combined effect (when multiple factors change
simultaneously) on the objective function value.
Table 3 presents the analysis data, which were
developed based on three scenarios for each factor: Low –
Medium – High.
Table 3. Key factors incorporated in sensitivity analysis
Factor
Adjustment scenarios
Low
(Derease)
Medium
High
(Increase)
Export profit
20%
-
20%
Carbon profit
20%
-
60%
Carbon Tariffs
20%
-
60%
Farming cost
20%
-
20%
Maximum
demand
20%
-
20%
Minimum
demand
20%
-
20%
Productivity
20%
-
20%
Due to the large number of full factorial combinations
(3⁷ = 2,187), the research team used a fractional factorial
design. After removing outliers and duplicates, 29
representative experiments remained. Analysis was
performed using Minitab 17 software.
Table 4. Analytical results
Source
DF
Adj SS
Adj MS
F-Value
P-Value
Export profit
7
1.58950E+24
2.27072E+23
1648.24
0.000
Carbon profit
1
7.96049E+23
7.96049E+23
5778.28
0.000
Carbon
Tariffs
1
1.94069E+21
1.94069E+21
14.09
0.001
Farming cost
1
2.11879E+21
2.11879E+21
15.38
0.001
Maximum
demand
1
1.23268E+23
1.23268E+23
894.77
0.000
Minimum
demand
1
3.71365E+20
3.71365E+20
2.70
0.116
Productivity
1
3.02911E+20
3.02911E+20
2.20
0.153
Export profit
1
3.18425E+23
3.18425E+23
2311.35
0.000
Error
21
2.89308E+21
1.37766E+20
Total
28
1.59239E+24
Model Summary
S
R-sq
R-sq (adj)
R-sq (pred)
1.17374E+10
99.82%
99.76%
99.62%
After analysis, the key factors influencing the objective
function value are: export profit, carbon profit, carbon tax,
cultivation cost, and yield. The model demonstrates high
statistical significance with a clear linear relationship
between input variables and the objective function. The R²
index reached 99.82%, indicating that the model explains
most of the variance in the dependent variable. The
adjusted R² (99.76%) confirms that all included variables
contribute significantly without causing noise.
17%
16%
7%
13%
4%
13%
6%
14%
6% 4%
Land use allocation per crop type
Mango Durian Jackfruit Dragon fruit Coconut
Passion fruit Banana Star apple Pomelo Orange
1810.2
1374.4
287.91
2880.4
270.83
2964.8
278.26
1138
433.3
124.6
1359.3
1031.8
402.01
2159.99
202.64
2343.3
1300.79
852
325.2
327.26
630.84
446.81
1526.28
1074.01
879.47
1282.89
901.91
1690.41
555.67
404.3
0
500
1000
1500
2000
2500
3000
3500
Mango
Durian
Jackfruit
Dragon fruit
Coconut
Passion fruit
Banana
Star apple
Pomelo
Orange
Yield (ton)
Crop
Total export volumes of major fruit crops to key
international markets over a 10-year period
USA EU TQ


![Bài giảng môn Thống kê nông nghiệp [chuẩn nhất]](https://cdn.tailieu.vn/images/document/thumbnail/2011/20110424/hoangnguyetminh/135x160/bai_giang_thong_ke_nong_nghiep_chokte_7909.jpg)


