ISSN: 2615-9740
JOURNAL OF TECHNICAL EDUCATION SCIENCE
Ho Chi Minh City University of Technology and Education
Website: https://jte.edu.vn
Email: jte@hcmute.edu.vn
JTE, Volume 19, Issue 03, 2024
77
Aqueous Ultrasound-Assisted Extraction of Phenolics and Saponins from Xao
Tam Phan Plant Parts: Optimization and Comparison of Extraction Efficiency
Thao Thi Nguyen Nguyen1,3 , Tan Thanh Trinh1, Nghia Huu Le1, Tuyen Chan Kha1, Hien Phuoc Phan2,
Hong Minh Xuan Nguyen1*
1Nong Lam University, Ho Chi Minh City, Vietnam.
2Van Lang University, Ho Chi Minh City, Vietnam.
3Phu Yen University, Phu Yen Province, Vietnam.
*Corresponding author. Email: nmxhong@hcmuaf.edu.vn
ARTICLE INFO
ABSTRACT
Received:
30/04/2024
Xao tam phan (XTP), a medicinal plant renowned for its health benefits, is
rich in antioxidants such as saponins, phenolics, flavonoids, and
proanthocyanidins. Although existing studies confirm that the presence of
these beneficial phytochemicals in XTP, further research is essential to
optimize their extraction yield. Ultrasound-assisted extraction (UAE),
recognized for its sustainability and efficiency, presents a promising
solution for maximizing these yields. This research uses UAE to optimize
the extraction of beneficial phytochemicals from XTP roots, stems, and
leaves. The study finds that the optimal extraction conditions vary
depending on the specific plant part. For roots and stems, the highest yield
was achieved using 220W ultrasonic power at 52°C for 8 min, resulting in
a total phenolic content (TPC) of 7.56 and 7.83 mg GAE/g d.b., and total
saponin content (TSC) of 116.24 and 117.84 mg EE/g d.b., respectively. In
contrast, for leaves, using 200W ultrasonic power at 47°C for 8 min yielded
higher TPC (11.60 mg GAE/g d.b.) and TSC (207.43 mg EE/g d.b.). Leaf
extracts exhibited approximately double the TPC and TSC compared to
other plant parts. These findings highlight the potential of XTP leaf extracts
as a valuable resource for the pharmaceutical, cosmetic, and food
industries.
Revised:
15/06/2024
Accepted:
24/06/2024
Published:
28/06/2024
KEYWORDS
Paramignya trimera;
Total phenolics;
Total saponins;
Ultrasound;
Xao tam phan.
Doi: https://doi.org/10.54644/jte.2024.1581
Copyright © JTE. This is an open access article distributed under the terms and conditions of the Creative Commons Attribution-NonCommercial 4.0
International License which permits unrestricted use, distribution, and reproduction in any medium for non-commercial purpose, provided the original work is
properly cited.
1. Introduction
Xao tam phan (Paramignya trimera (Oliv.) Guillaum) is a medicinal plant renowned for its ability
to cool the liver, reduce heat, and replenish health. It's especially recognized for its potential to prevent
various types of cancer, including HepG2 liver cancer, HTC116 colorectal cancer, MDA MB231 breast
cancer, OVCAR-8 ovarian cancer, and cervical cancer (Nguyen et al., 2017a). Additionally, it exhibits
anti-inflammatory properties [1] and α-glucosidase inhibitory activities [2]−[4]. Due to its unique
antioxidant components such as saponin, phenolic, flavonoid, proanthocyanidin, and many other
compounds, Xao tam phan (XTP) is often referred to as a "miracle" plant. While these studies indicate
that XTP contains biologically active phytochemicals; further investigation into extraction conditions is
necessary to enhance the yield of these compounds.
Extraction of natural products has been a practice since the discovery of fire. Ancient civilizations
like the Mayas, Aztecs, Egyptians, Phoenicians, Jews, Arabs, Indians, Chinese, Greeks, and Romans
used extracted products in perfume, cosmetics, medicine, and food. Traditional extraction methods such
as infusion, decoction, digestion, maceration, and percolation have long been employed to extract
bioactive compounds. However, these conventional solid-liquid extraction techniques are time-
consuming and necessitate large amounts of toxic organic solvents [5]. This prompted the development
of environmentally friendly (green) extraction technologies over the past two decades. Green extraction
processes aim to minimize organic solvent consumption, energy usage, costs, and extraction time [6].
Ultrasound-assisted extraction (UAE) emerges as a critical technology in achieving the sustainability

ISSN: 2615-9740
JOURNAL OF TECHNICAL EDUCATION SCIENCE
Ho Chi Minh City University of Technology and Education
Website: https://jte.edu.vn
Email: jte@hcmute.edu.vn
JTE, Volume 19, Issue 03, 2024
78
objectives of green extraction. The utilization of UAE in various fields including chemistry, biology,
and technology has been well-documented [7]−[9].
Phytochemical and bioassay studies have confirmed the potential of XTP, leading to the exploration
of various extraction techniques. However, chemical solvent methods are not appropriate for food
production [10]−[12]. As a result, we adopted aqueous ultrasound-assisted extraction (UAE), a method
that is eco-friendly, efficient, simple, and fast. This study focuses on optimizing parameters for the UAE
with a water solvent. Utilizing response surface methodology (RSM) to maximize the extraction yield
of phytochemicals from the plant's roots, stems, and leaves, particularly the total phenolic content (TPC)
and total saponin content (TSC). The efficacy of UAE on different parts of XTP was evaluated by
comparing the TPC and TSC in the extracts.
2. Materials and Methods
2.1. Materials
The Xao tam phan trees, aged four years, were freshly harvested from Phu Yen province, Vietnam.
Upon harvesting, the plants were categorized into roots, stems, and leaves. Following a thorough
washing process, the plants were allowed to drain and subsequently dried at a temperature of 40 ± 2°C,
until reaching a final moisture content of approximately 10%. These dried samples were then finely
ground into a powder, sieved through a 0.3 mm mesh, packed into nylon bags, and stored at -10°C for
subsequent analysis. Folin-Ciocalteu reagent, gallic acid (GA), vanillin, and aescin were procured from
Sigma-Aldrich Co. (USA).
2.2. Experimental methods
For each assay, 1g samples of XTP powder were utilized. These samples were placed in 250mL
beakers and mixed with water at various ratios. The treatment of samples was conducted using a probe-
type ultrasonic device (BSP-1200 bench-scale, USA). The sonication temperature was controlled by
immersing the beakers with the samples in a manually regulated thermostatic water tank. Following
sonication, the resulting mixture underwent centrifugation at 5000 rpm for 15 mins using a centrifuge
(Sartorius, Switzerland). Subsequently, the supernatant was used to quantify the TPC and TSC in XTP
extracts.
2.2.1. Optimization of UAE conditions for maximizing the TPC and TSC in XTP extracts
The experiments were designed using JMP version 13 Pro statistical software and Central Composite
Design (CCD) to study the combined effect of independent variables on desired responses. The objective
was to determine the optimal ultrasonic power (X1, W), temperature (X2, °C), and duration (X3, mins)
for maximizing TPC and TSC in root, stem, and leaf extracts.
Preliminary experiments, as outlined by Nguyen et al.(2023), were conducted to establish the
minimum and maximum values of the dependent variables [13]. Based on these findings, the dependent
variables were adjusted to define the range for the optimization study: ultrasonic power ranging from
190 to 220W, temperature ranging from 40 to 60 °C, and duration ranging from 4 to 8 mins.
Table 1 displays the levels of independent variables along with the results of 17 experiments run to
determine the saponin and phenolic contents in each part of the plant extracts. Additionally, a control
experiment without ultrasonication was also conducted.
Regression analysis was carried out to create quadratic models (Equation 1) [7]. The optimal value
generated was then validated by comparing the predicted and experimental values.
𝑌𝑛= 𝛽0+ ∑𝛽𝑖 𝑋𝑖
𝑘
𝑖=1 + ∑𝛽𝑖𝑖 𝑋𝑖2
𝑘
𝑖=1 + ∑
𝑘
𝑖=1 ∑ 𝛽𝑖𝑗 𝑋𝑖
𝑘−1
𝑗=𝑖+1 𝑋𝑗
(1)
In equation 1, Yn represents the response variables, β0 denotes the intercept, βi signifies the linear
regression coefficient for the ith factor, βij and βii represent the cross-product and quadratic terms,
respectively. Xi and Xj denote the input variables, and k represents the number of input variables (k =
3). The regression coefficients of individual linear, interaction, and quadratic terms are determined based

ISSN: 2615-9740
JOURNAL OF TECHNICAL EDUCATION SCIENCE
Ho Chi Minh City University of Technology and Education
Website: https://jte.edu.vn
Email: jte@hcmute.edu.vn
JTE, Volume 19, Issue 03, 2024
79
on the analysis of variance (ANOVA). The magnitude of the standardized model coefficients indicates
their importance in the model, with larger values among standardized coefficients being more
influential. Aside from the quadratic model, the interactive effects of the factors can be illustrated in 3-
D surface plots, aiding in visualizing the relationships between the variables and the response.
2.2.2. Comparison of UAE efficacy on XTP root, stem, and leaf extracts
The efficacy of recovering bioactive compounds in UAE was compared across the root, stem, and
leaf extracts of XTP. To facilitate this comparison, the optimal UAE conditions for each part of the XTP
plant were used to evaluate the efficacy of TPC and TSC in the extracts.
2.3. Analytical methods
TPC and TSC were measured using the spectrophotometric method, following the procedure
described by Nguyen et al.(2023) [13]. The results were expressed as mg gallic acid equivalent (GAE)/g
dried basis (d.b.) for TPC and mg of aescin equivalents (AE)/g d.b. for TSC.
2.4. Statistical analysis
All experiments and analytical measurements in the research were performed in triplicate. The data
were statistically processed using JMP software version 13 Pro. The experimental data were presented
as means and standard deviations (Mean ± SD). The differences between the mean values were evaluated
using analysis of variance (ANOVA) and the least significant difference (LSD) at a 5% significant level
(p < 0.05). The graphs of mean values and error bars were created using Excel version 2016.
3. Results and Discussion
3.1. Optimization of sonication parameters for maximizing the extraction of total phenolic
compounds and saponins in XTP
The RSM of TPC and TSC from the XTP root, stem, and leaf extracts, obtained using various UAE
parameters are shown in Table 2. The determination coefficient (R2), F-values, and p-value from these
models suggest a high model-fitting rate, indicating that 95% of the predicted values correlate with the
experimental data. The results imply that the RSM of TPC and TSC of the XTP extracts is adequate and
suitable for describing the effects and interactions of independent variables on the models, optimizing
the UAE parameters.
3.1.1. Optimizing sonication parameters in XTP root extracts
The optimization of ultrasound parameters in XTP root extracts was conducted using the CCD-RSM.
Three significant factors, namely power (X1), temperature (X2), and extraction time (X3) were optimized.
It was found that the highest TPC level (7.79 mg GAE/g d.b.) was achieved under conditions (210W, 6
min, and 50oC), while the highest TSC level (105.61 mg AE/g d.b.) was obtained under similar
conditions (Table 1).
Table 1. The effects of UAE conditions on the TPC and TSC in each part of XTP plant extracts
Parts of the
plant
Treatment
No.
Power
(W)
Temperature
(oC)
Duration
(mins)
TPC
(mg GAE/g d.b.)
TSC
(mg AE/g d.b.)
1
190
45
6
7.08
75.64
2
200
40
4
7.16
71.42
3
200
40
8
7.37
84.86
4
200
50
4
6.97
70.49
Roots
5
200
50
8
7.45
87.17
6
210
37
6
7.79
89.33
7
210
45
3
7.26
60.67
8
210
45
6
7.61
88.55

ISSN: 2615-9740
JOURNAL OF TECHNICAL EDUCATION SCIENCE
Ho Chi Minh City University of Technology and Education
Website: https://jte.edu.vn
Email: jte@hcmute.edu.vn
JTE, Volume 19, Issue 03, 2024
80
9
210
45
6
7.66
88.51
10
210
45
6
7.60
88.40
11
210
45
9
7.65
93.27
12
210
53
6
7.52
105.61
13
220
40
4
7.49
76.47
14
220
40
8
7.47
84.20
15
220
50
4
7.27
74.30
16
220
50
8
7.46
101.39
17
226,8
45
6
7.05
78.31
1
190
55
6
6.86
98.78
2
200
45
4
6.65
91.33
3
200
45
8
7.84
87.98
4
200
65
4
7.84
77.26
5
200
65
8
7.62
87.35
Stems
6
210
38
6
7.26
85.57
7
210
55
3
7.00
79.73
8
210
55
6
7.94
85.13
9
210
55
6
7.98
86.66
10
210
55
6
8.00
85.28
11
210
55
9
7.71
102.63
12
210
72
6
7.97
72.91
13
220
45
4
6.65
97.32
14
220
45
8
7.61
108.00
15
220
65
4
7.87
91.93
16
220
65
8
7.72
97.19
17
230
55
6
6.95
119.26
1
190
50
6
10.99
235.00
2
200
40
4
11.52
125.77
3
200
40
8
11.74
173.97
4
200
60
4
11.82
203.68
5
200
60
8
10.90
209.45
6
210
33
6
10.74
122.8
Leaves
7
210
50
3
11.43
141.79
8
210
50
6
11.15
180.23
9
210
50
6
11.14
181.29
10
210
50
6
11.17
183.25
11
210
50
9
11.88
194.25
12
210
67
6
10.34
178.72
13
220
40
4
9.73
124.76

ISSN: 2615-9740
JOURNAL OF TECHNICAL EDUCATION SCIENCE
Ho Chi Minh City University of Technology and Education
Website: https://jte.edu.vn
Email: jte@hcmute.edu.vn
JTE, Volume 19, Issue 03, 2024
81
14
220
40
8
11.08
148.95
15
220
60
4
10.85
191.63
16
220
60
8
10.03
178.88
17
230
50
6
10.11
168.16
The influence of each variable (X1, X2, X3) as well as the interaction between variables is determined
based on Table 2. A second-order polynomial equation was derived from experimental data via multiple
regression analysis, describing the efficiency of TPC (mg GAE/g d.b.) and TSC (mg AE/g d.b.):
𝑌𝑇𝑃𝐶 = 7,6265−0,0562𝑋2+0,1110𝑋3−0,20831𝑋1
2−0,0701𝑋3
2
(2)
𝑌𝑇𝑆𝐶 = 88,6349+3,2064𝑋2+8,7732𝑋3−4,5747𝑋1
2+2,6869𝑋2
2−4,5764𝑋3
2
(3)
Variance analysis (ANOVA) is a reliable method to assess a model's quality. It compares the
variations in level combinations with the inherent randomness. The model's fit is best if it shows
significant regression and an insignificant lack of fit [14]. The results indicate that the regression model
for the function of TPC and TSC is statistically significant with a p-value <0.05, demonstrating that the
probability of noise occurring in the experimental results is not more than 5%, indicating that the
designed model is highly significant. The correlation coefficients R2TPC = 0.9463 and R2TSC = 0.9542
indicate that the experimental model has high compatibility with the predictive model.
The quadratic regression equation and the p-value indicated in Table 2 reveal that the primary effects
of two factors, temperature and time, significantly impact both TPC and TSC. However, there is a
difference in the factors affecting TPC and TSC at the quadratic level. For TPC, the effect of power is
most pronounced (p<0.001), followed by time. In contrast, TSC is significantly and equally affected by
all three factors. Despite this, the interaction between these factors does not statistically impact TPC and
TSC (p>0.05). This data suggests that the extraction of the root is influenced by these factors in the
following order: time > power > temperature.
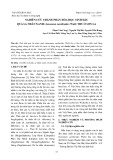
(a)
(b)
(c)
(d)
(e)
(f)
Figure 1. Response surface plots of (a-c) TPC and (d-f) TSC of extracts from XTP roots
The study further examined the optimal level of each variable and the impact of their interaction on
TPC and TSC using response surface plots (Figure 1). The maximum TPC and TSC can be observed
most clearly in the tests illustrated in Figures 1b and 1e. The best extraction conditions yielded the
highest TPC (7.67 ± 0.44 mg GAE/g d.b.) and TSC (101.86 ± 3.66 mg AE/g d.b.) using a power of
210W, a temperature of 50°C, and a duration of 8 min. The model's accuracy was confirmed by