
Expression of the
Drosophila melanogaster
ATP synthase asubunit
gene is regulated by a transcriptional element containing GAF
and Adf-1 binding sites
Ana Talamillo
1,
*, Miguel Angel Ferna
´ndez-Moreno
1
, Francisco Martı
´nez-Azorı
´n
1
,Bele
´n Bornstein
1,2
,
Pilar Ochoa
1
and Rafael Garesse
1
1
Departamento de Bioquı´mica, Instituto de Investigaciones Biome
´dicas ‘Alberto Sols’, CSIC-UAM, Facultad de Medicina,
Universidad Auto
´noma de Madrid, Spain;
2
Servicio de Bioquı´mica, Hospital Severo Ochoa, Legane
´s, Madrid, Spain
Mitochondrial biogenesis is a complex and highly regulated
process that requires the controlled expression of hundreds
of genes encoded in two separated genomes, namely the
nuclear and mitochondrial genomes. To identify regulatory
proteins involved in the transcriptional control of key nuc-
lear-encoded mitochondrial genes, we have performed a
detailed analysis of the promoter region of the asubunit of
the Drosophila melanogaster F
1
F
0
ATP synthase complex.
Using transient transfection assays, we have identified a
56 bp cis-acting proximal regulatory region that contains
binding sites for the GAGA factor and the alcohol dehy-
drogenase distal factor 1. In vitro mutagenesis revealed that
both sites are functional, and phylogenetic footprinting
showed that they are conserved in other Drosophila species
and in Anopheles gambiae. The 56 bp region has regulatory
enhancer properties and strongly activates heterologous
promoters in an orientation-independent manner. In addi-
tion, Northern blot and RT-PCR analysis identified two
a-F1-ATPase mRNAs that differ in the length of the 3¢
untranslated region due to the selection of alternative
polyadenylation sites.
Keywords: mitochondria; a-F
1
-ATPase; GAGA; Adf-1;
transcription regulation.
The bulk of cellular ATP is synthesized through oxidative
phosphorylation (OXPHOS) that takes place in the mito-
chondria. The OXPHOS system is composed of five
multisubunit complexes embedded in the inner mitochond-
rial membrane and two small electron carriers, ubiquinone
and cytochrome c[1]. The OXPHOS system is generated in a
unique manner. The majority of the more than 80 OXPHOS
subunits are encoded by genes in the nuclear DNA (n-DNA),
while 13 essential subunits are encoded in the mitochondrial
DNA (mtDNA), contributing to four out of the five
OXPHOS complexes. The mtDNA consists of a small,
double-stranded, circular DNA molecule that is transcribed
and translated within this organelle. However, all of the
components involved in the replication, maintenance and
expression of the mtDNA, as well as the factors that
participate in the assembly of the respiratory complexes, are
encoded in the nucleus. Therefore, correct OXPHOS func-
tion relies on the coordinated expression of numerous genes
encoded in two physically separated genetic systems [2,3].
The multisubunit enzyme ATP synthase (complex V of the
OXPHOS system) is present in the membranes of eubacteria,
mitochondria and chloroplasts. It synthesizes ATP by means
of a rotary mechanism coupled to the electrochemical
gradient generated by the electron transport chain [4]. The
mitochondrial ATP synthase of animals contains 16 subunits
and is responsible for the synthesis of the majority of cellular
ATP, thereby playing a crucial role in energy metabolism. It
is formed by an F
1
soluble complex containing five subunits
with a stoichiometry of a
3
b
3
dce, and a hydrophobic F
0
complex composed of 11 subunits that forms an H
+
channel
embedded in the inner mitochondrial membrane [1]. The F
1
subcomplex contains the three catalytic sites of the enzyme
located at the interfaces of the aand bsubunits where
nucleotide turnover takes place [4]. Two of the subunits are
encoded in the mtDNA; ATPase 6 (or a) and ATPase 8 (or
A6L). In contrast, the remainder are nuclear-encoded and
are translated by cytoplasmic ribosomes before being
imported to the mitochondria.
The molecular basis underlying nucleo–mitochondrial
crosstalk is still poorly understood [3]. During the last few
years a number of processes have been shown to participate
in this process, including transcriptional and post-transcrip-
tional regulation of gene expression [5,6], changes in Ca
2+
Correspondence to R. Garesse, Departamento de Bioquı
´mica, Insti-
tuto de Investigaciones Biome
´dicas ‘Alberto Sols’ CSIC-UAM, Fac-
ultad de Medicina, Universidad Auto
´noma de Madrid, C/Arzobispo
Morcillo 4, 28029 Madrid, Spain. Fax: +34 91 5854001,
Tel.: +34 91 4975453, E-mail: rafael.garesse@uam.es
Abbreviations: Adf-1, alcohol dehydrogenase distal factor; GAF,
GAGA factor; OXPHOS, oxidative phosphorylation; n-DNA, nuc-
lear DNA; mtDNA, mitochondrial DNA; NRF, nuclear respiratory
factor; RACE, rapid amplification of cDNA ends; AEL, after egg
laying; UTR, untranslated region; DPE, downstream promoter
element.
*Present address: Departamento de Anatomı´a y Biologı´aCelular,
Facultad de Medicina, Universidad de Cantabria, Santander, Spain.
(Received 2 June 2004, revised 6 August 2004,
accepted 18 August 2004)
Eur. J. Biochem. 271, 4003–4013 (2004) FEBS 2004 doi:10.1111/j.1432-1033.2004.04336.x

concentration [7], control of the mitochondrial dNTP pool
[8,9], mitochondrial localization to specific cellular domains
[10], or changes in local ATP concentrations [11]. A
particularly fruitful experimental strategy to identify key
regulatory factors in mitochondrial biogenesis was pioneered
by Scarpulla’s group [5]. This involves characterization of the
promoter regions of mammalian nuclear-encoded mito-
chondrial genes, and has led to the identification of several
transcription factors and coactivators that regulate the
expression of genes playing key roles in the biogenesis of
the OXPHOS system. In general, the transcription of nuclear
genes encoding proteins involved in OXPHOS biogenesis is
controlled by a combination of transcription factors that
are specific for each promoter [3,12]. However, one DNA
regulatory element that is more common in the 5¢upstream
regulatory region of respiratory genes is that recognized by
the constitutively expressed Sp1 factor [13]. Additionally,
two other transcription factors have been shown to play a
significant role in mitochondrial biogenesis, the nuclear
respiratory factors (NRFs) 1 and 2 [5,14]. These factors are
likely to be involved in the integration of mitochondrial
biogenesis with other cellular processes related to cell growth
[15,16]. NRF-1 belongs to a novel class of regulatory
proteins, and it contains a DNA binding domain conserved
in two invertebrate developmental regulators, Erect Wing
and P3A2 [17]. Erect Wing is essential for the Drosophila
myogenesis and neurogenesis [18] while P3A2 regulates the
expression of several genes during sea urchin development
[19]. The transcription factor NRF-2 belongs to the ets family
and is the human homologue of the previously described
mouse transcription factor GABP [20]. Other DNA regula-
tory elements have been identified in the promoter of several
genes involved in mitochondrial biogenesis, such as
OXBOX/REBOX [21], Mts [22] or GRBOX [23]. However
the putative transcription factors that recognize these DNA
motifs remain to be identified.
In contrast, less is known about the mechanisms
controlling mitochondrial biogenesis in other animal sys-
tems or in invertebrates. We previously described how the
transcription of several Drosophila melanogaster genes
encoding components of the mtDNA replication machinery
was regulated. These included the mitochondrial single-
stranded binding protein (mtSSB), and the catalytic (a)and
accessory (b) subunits of the DNA polymerase c(Pol c)
[24,25]. Interestingly, the expression of the genes encoding
mtSSB and Pol c-bis transcriptionally regulated by the
DNA replication-related-element binding factor (DREF).
Indeed, in Drosophila this transcription factor regulates the
expression of genes that are essential for the cell-cycle and
for the nuclear DNA replication machinery [26], establish-
ing a link between mitochondrial and nuclear DNA
replication [24,25]. Here, we have identified essential
elements that participate in the transcriptional regulation
of the gene encoding the asubunit of the H
+
ATP synthase
(a-F1-ATPase)inD. melanogaster.
Materials and methods
Library screenings
We screened a D. melanogaster genomic library prepared in
the vector k-DASH using the previously described a-F1-
ATPase cDNA labelled with [
32
P]dCTP[aP] as a probe [27].
Two genomic equivalents were transferred to Zeta-probe
filters (Bio-Rad), hybridized at 68 C in ZAP buffer [7%
(w/v) SDS, 0.25
M
phosphate buffer, pH 7.2], washed in
0.5% (w/v) SDS, 2·NaCl/Cit at 55 C (NaCl/Cit: 0.15
M
NaCl/0.015
M
sodium citrate) and visualized by autoradio-
graphy with intensifying screens at )70 C. Positive clones
were purified by two additional rounds of screening, and
positive phages were amplified using standard protocols,
and the inserts analysed by Southern blotting. The complete
sequence of the gene as well as 5¢upstream and 3¢
downstream regions (http://Flybase.bio.indiana.edu) were
included in two overlapping phages. Selected fragments
strongly hybridizing with the probe were subcloned into
pBluescript (Stratagene) and further characterized by
sequencing.
DNA sequencing
The nucleotide sequence of the genomic clones was
determined using the dideoxy chain-termination method
with Taq DNA polymerase and automatic sequencing (3T3
DNA sequencer, Applied Biosystems) following the manu-
facturer’s instructions. Both DNA strands were sequenced
in their entirety and the sequences were analysed using the
GCG
programme (University of Wisconsin) [28].
Mapping of transcriptional initiation sites
Identification of the a-F1-ATPase transcription start site
was achieved by three different methods: primer extension,
high-resolution S1 mapping and rapid amplification of
cDNA ends (RACE).
Primer extension analysis. Two different oligonucleotides
were used: a-PE1 (5¢-ACGGCCGGTCTCCTCCAGA
TC-3¢) from bp 216–195 and a-PE2 (5¢-GGACGC
CAGGCGGGCGGAAAAAATCG-3¢) from bp 30–4
from the ATG start codon in the a-F1-ATPase cDNA
sequence, respectively [27] (accession number Y07894). In
the assay, 50 pmol of the oligonucleotides were labelled with
50 lCi of [
32
P]ATP[cP] and polynucleotide kinase. Total
RNA (30 lg) from adults or from embryos obtained 0–18 h
after egg laying (AEL), and 8 lCi
1of
32
P-labelled primer
were used in each experiment. Annealing and reverse
transcription were carried out as described previously [29],
and the extended products were analysed in 8% (w/v)
polyacrylamide/7
M
urea gels. Sequencing reactions using
the same oligonucleotides were run in parallel.
S1 analysis. We PCR amplified a 506 bp fragment using
the forward primer 5¢-AGATGACCTGATTCCCTT
GG-3¢corresponding to bp )476 to )459 from the ATG
start codon in the genomic sequence (GenBank
2accession
number NT_033778) and the reverse primer 5¢-GGACGC
CAGGCGGGCGGAAAAAATCG-3¢corresponding to
bp 30–4 in the same sequence. The reverse oligonucleotide
was labelled at its 5¢end with 100 lCi of [
32
P]ATP[cP] using
T4 polynucleotode kinase under standard conditions. The
probe (3.2 lCi)
3was hybridized with 75 lgoftotalRNA
extracted from adult Drosophila, for 15 h in 80% (v/v)
formamide, 40 m
M
Pipes pH 6.4, 1 m
M
EDTA, 0.4
M
4004 A. Talamillo et al.(Eur. J. Biochem. 271)FEBS 2004
NaCl. After adding four volumes of S1 nuclease buffer
(40 m
M
sodium acetate, 250 m
M
NaCl, 4 m
M
ZnSO
4
), the
sample was incubated with 150 units of S1 nuclease
(Pharmacia) for 60 min. The reaction was stopped with
4
M
ammonium acetate and 0.1
M
EDTA, and the nucleic
acids extracted with phenol and precipitated with ethanol.
The pellet was resuspended in 75 m
M
NaOH, and after
incubating for 15 min at 90 C it was precipitated with
ethanol, resuspended in 98% (v/v) formamide, 25 m
M
EDTA, 0.02% (w/v) bromophenol blue, 0.02% (w/v)
xylene cyanol, and analysed in 8% (w/v) polyacrylamide/
7
M
urea gels. Sequencing reactions were run in parallel.
5¢RACE experiments. We used the RLM-RACE kit from
Ambion Inc. (cat. # 1700), following the manufacturer’s
instructions. We used a-PE1 as the outer primer oligo-
nucleotide for the a-F1-ATPase cDNA (see Primer exten-
sion analysis) and the inner primer was 5¢-TCTCCTCCA
GATCAGCCTTGGGGG-3¢.
RT-PCR analysis of a
-F1-ATPase
mRNA-3¢ends
Total RNA from D. melanogaster embryos 0–18 h AEL or
adult flies was extracted using Trizol (Gibco-BRL) and
treated for 30 min with RNAse-free DNAse I (1 unit per lg
of RNA). Reverse transcription was carried out following a
protocol described previously [24]. Amplification of the 3¢
ends was performed with an oligo(dT) primer and one of
the two primers a-RT1 (5¢-TGCGCGGTCATCTGG
ACAA-3¢)anda-RT2 (5¢-ATCGCCAAGGACGGTGC
TA-3¢), at positions )184/)165
4and )83/)64 with reference
to the translation stop codon, respectively.
Promoter constructs
A909 bpDNAfragmentfromthe5¢region upstream of the
D. melanogaster a-F1-ATPase gene (from )914 to )5
considering +1 the first nucleotide of the translation start
codon) was amplified by PCR from total DNA using the
primers pADm1 (forward; 5¢-AGCAGTCGACGA
AGCGACGAAGTGAAGCTGCGTGA-3¢) and pADm3
(reverse; 5¢-ATCCGTCGACATGCTTTTTAACTGTT
CG-3¢). After digestion with SalI (which recognizes the
sequence underlined in the oligonucleotides), the DNA
fragment was cloned into the pXp2 vector that contains the
luciferase reporter gene. The construct with the suitably
orientated insert was used as a parental DNA fragment for
the generation of a series of deletion constructs. These were
generated either by ExoIII digestion and blunt-end cloning,
by restriction endonuclease-based cloning, or by PCR
amplification and cloning of selected DNA fragments.
Finally, we obtained the constructs shown below, where +1
represents the transcription start point according to the data
presented here.
Mutagenesis of the GAGA element was achieved by
PCR and subcloning of the amplified fragment. The
oligonucleotides used for PCR were the luciferase gene
internal primer 5¢-GGCGTCTTCCATTTTACC-3¢and
the oligonucleotide 5¢-CCGTCGACATTAATTTAATTT
ccccAATTATATTGCGTCG-3¢in which the SalI recogni-
tion site is in bold and the GAGA element is replaced by the
sequence underlined (lowercase letters show the nucleotide
changes). The )146/+79 construct was used as a template
and the amplified fragment was cloned into the pXp2
5vector.
This strategy was also used to mutate the alcohol dehy-
drogenase distal factor (Adf-1) element using the specific
primer 5¢-CCGTCGACATTAATTTGAGAAATTATAT
TGCGTCGCccgccggcCgcCacgGAGGGTGAC-3¢(again
the SalI recognition site is in bold, the location of the
Adf-1 element is underlined, and nucleotides in lowercase
have been changed). A similar strategy was carried out to
construct the GAGA or/and Adf-1 mutants in the hybrid
promoters (see Results).
Cell transfection assays
The pXp constructs (5 lg) were transiently transfected into
Schneider S2 cells (as described previously [25]) to assay
their promoter activity. To correct for variations in the
efficiency of transfection, we cotransfected the cells with the
plasmid pSV-bGAL and the quantification of luciferase was
normalized to b-galactosidase activity. Luciferase activity
was determined using the Luciferase Assay System (Pro-
mega) according to manufacturer’s recommendations, and
b-galactosidase activity was measured as described previ-
ously [30].
Results
Transcriptional initiation sites of the
D. melanogaster
a
-F1-ATPase
gene
We have previously characterized a cDNA encoding the
D. melanogaster a-F1-ATPase subunit [27]. To isolate the
corresponding D. melanogaster a-F1-ATPase gene and
flanking regions, we screened a genomic library using this
a-F1-ATPase cDNA as a probe. Two overlapping clones
containing the entire gene as well as 5¢upstream and 3¢
downstream sequences were selected for further analysis.
The a-F1-ATPase gene maps to the 2R arm of the
D. melanogaster polytene chromosomes and its structure
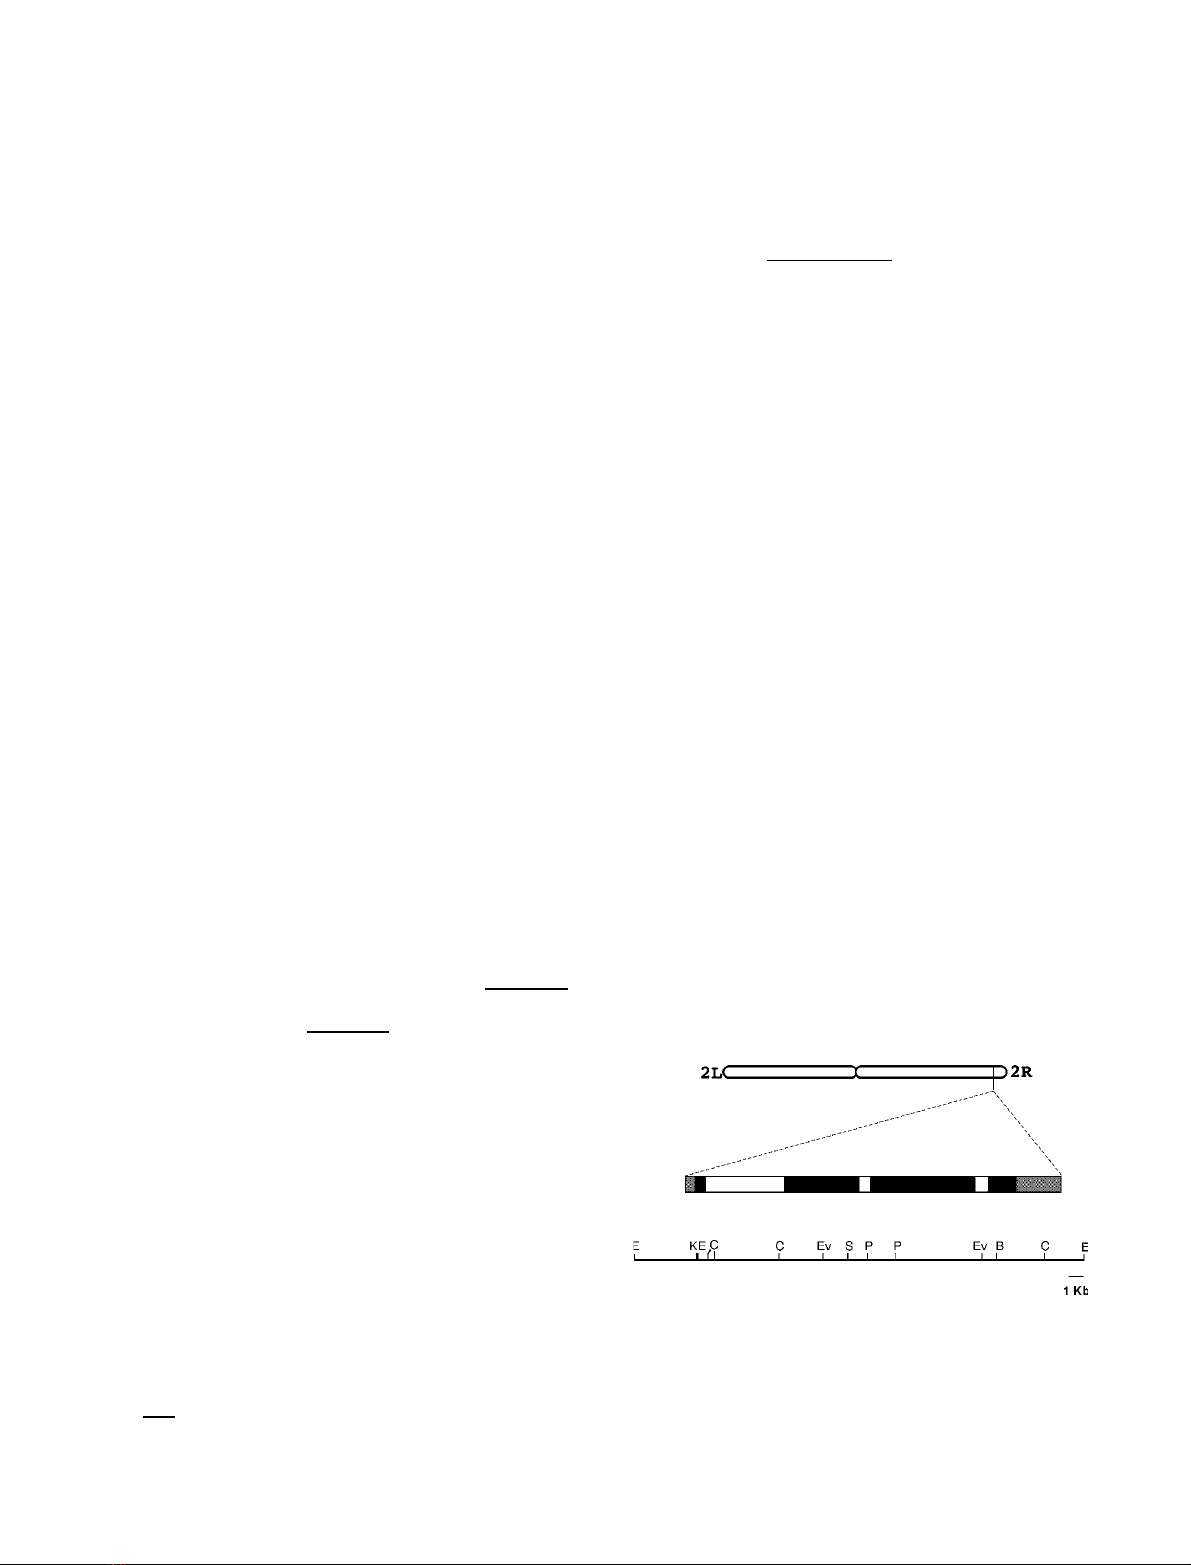
is shown schematically in Fig. 1. It contains four exons
separated by three 624, 92 and 113 bp introns. The first
Fig. 1. Structure of the D. melanogaster a-F1-ATPase gene. Chromo-
somal location and structure of a-F1-ATPase. The gene maps to the
2R arm in D. melanogaster. In the schematic diagram of the gene
structure, white boxes represent introns, black boxes represent exons,
and the grey boxes represent UTRs. The line underneath the gene
shows the position of several restriction endonucleases. E: EcoRI; K:
KpnI; C: ClaI; Ev: EcoRV; S: SalI; P: PstI; B: BamHI.
FEBS 2004 Drosophila a-F
1
-ATPase gene expression (Eur. J. Biochem. 271) 4005
exon encodes the 5¢untranslated region (5¢-UTR) as well as
the first 22 amino acids of the 23 residues which form the
targeting sequence. The last amino acid of the presequence,
the complete mature protein and the 3¢-UTR region are
encoded in exons 2–4. To determine the transcriptional
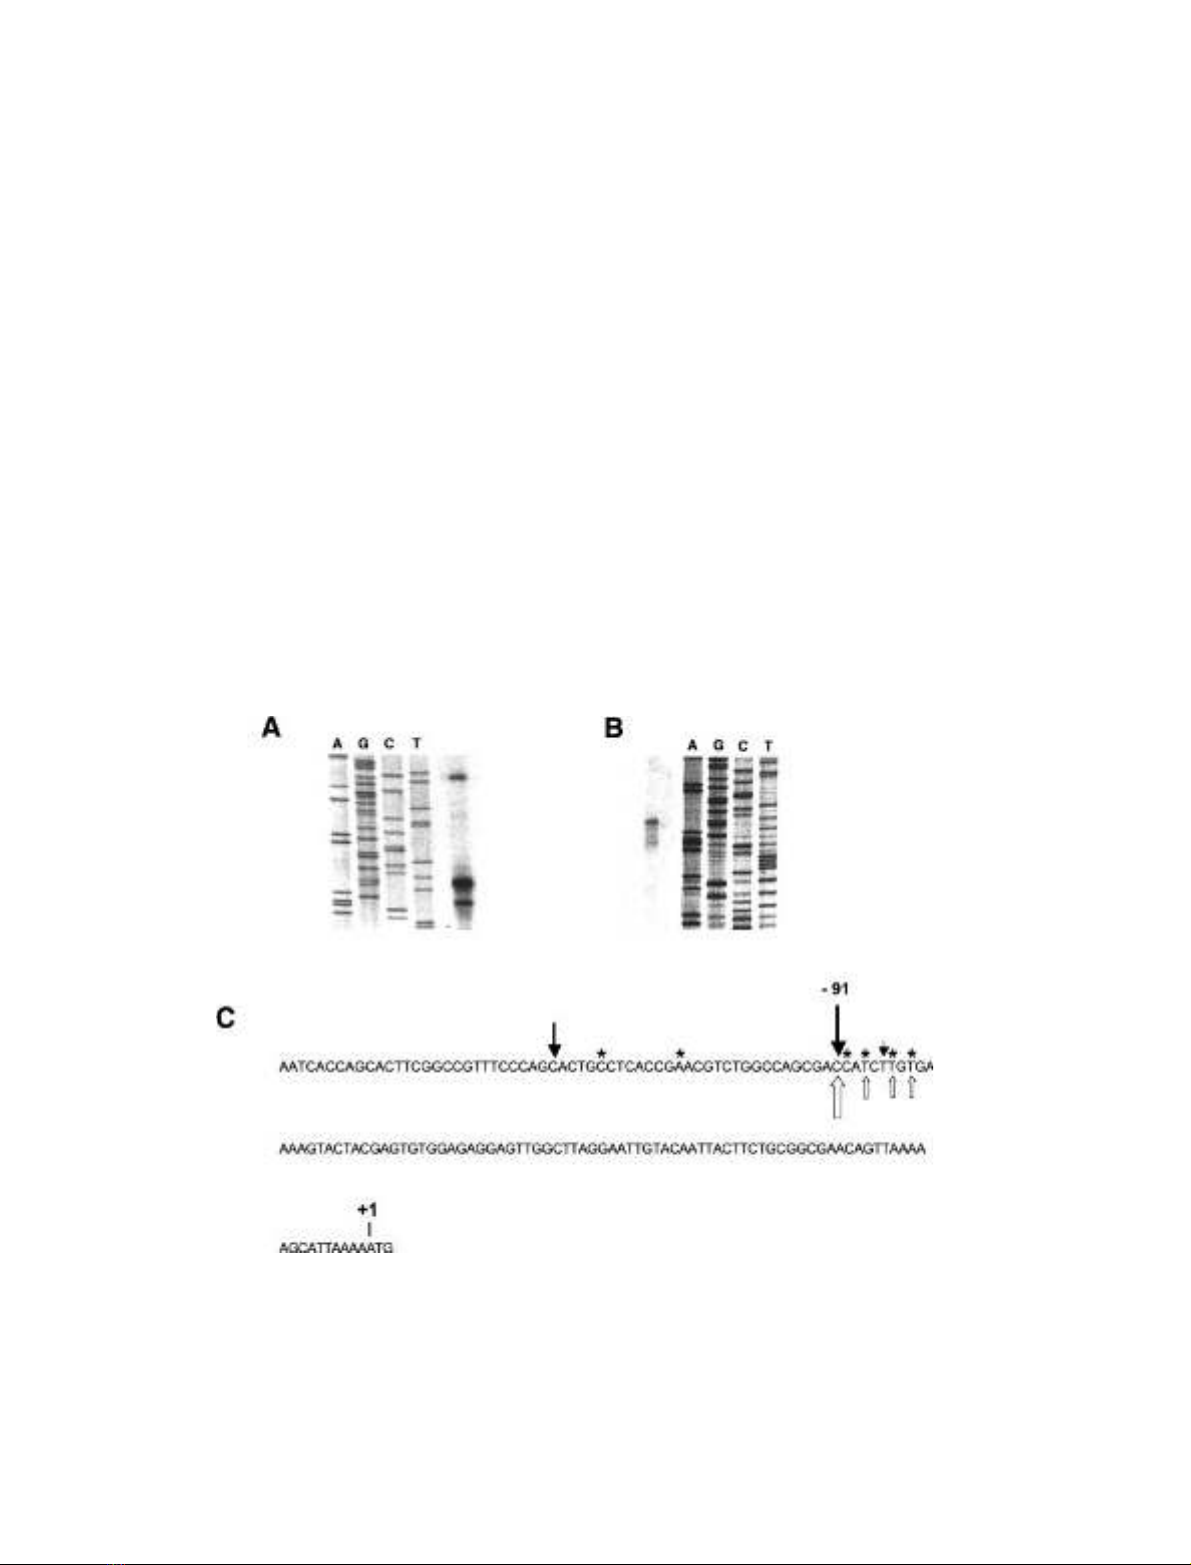
initiation sites of the a-F1-ATPase gene we first carried out
primer extension analysis using total RNA extracted from
adults or embryos 0–18 h AEL, and two different
32
P-labelled oligonucleotide primers (a-PE1 and a-PE2).
Both primers produced identical results in embryos and
adults, three transcriptional initiation sites being detected at
positions )86, )91 (the majority) and )120, considering
position +1 as the first nucleotide of the translation
initiation codon ATG (Fig. 2A,C).
This result was confirmed by high resolution S1 mapping
using a 506 bp probe that extended from the coding region
(position +30) to 477 bp upstream of the ATG. In this
analysis, several DNA fragments were protected (Fig. 2B),
with the strongest signal corresponding to position )91, the
prominent position detected by primer extension. The
position )91 is 22 nucleotides upstream of the transcription
startpoint previously described for this gene [27] (GenBank
accession number Y07894). Additionally, more weakly
protected smaller fragments were detected, reflecting the
failure to precisely identify the initiation site typical in
housekeeping and TATA-less promoters. Finally, we per-
formed a RACE study on the 5¢end of the a-F1-ATPase
mRNA. All of the clones analysed end in the region )83 to
)115, most of them ending between )83 to )90 (Fig. 2C).
Interestingly, three clones identified in RACE experiments
detected the same nucleotides as the three weaker bands
shown by S1 mapping as the transcription start point.
Hence, we concluded that the D. melanogaster a-F1-ATP-
ase gene contains a heterogeneous region responsible for the
initiation of transcription although a common initiation site
was located at position )91.
As frequently observed in other housekeeping genes,
neither TATA nor CCAAT boxes were found in canon-
ical positions in the Drosophila a-F1-ATPase gene [31].
Moreover, in the 5¢upstream region of the a-F1-ATPase
gene we did not find the TCAG/TTPy arthropod initiator
element [32]. Nevertheless, in the bovine and human a-F1-
ATPase genes, the transcriptional initiation sites located at
positions )91 and )120 lie within short conserved
sequences. Indeed, the sequence at the )91 transcriptional
start site, CCATCT, corresponds to a conserved
vertebrate initiator element (Inr; PyPyAT/APyPy), indica-
ting that it may be involved in tethering the basal
Fig. 2. Identification of the transcription start site of the D. melanogaster a-F1-ATPase gene. (A) Primer extension analysis. Transcripts from
a-F1-ATPase mRNA primers were obtained with both a-PE1 and a-PE2 primers, although because the results were identical only those with the
primer a-PE2 are shown. Sequencing was performed with the same primers using a genomic clone as the template. (B) High resolution S1 mapping.
Total RNA from D. melanogaster was hybridized with a 506 bp probe from )476 to +30, the ATG translation start codon being referred to as +1.
Bands that were protected from S1 nuclease were visualized in 8% (w/v) acrylamide/urea gels, close to the sequencing reactions. (C) The nucleotide
sequence of a-F1-ATPase 5¢upstream region. Black arrows show the transcription start points identified in the primer extension assays. White
arrows represent transcription start points from S1 mapping. The thickness of the black and white arrows is related to the intensity of the band.
Asterisks represent transcription start points from the 5¢end amplification experiments (see Materials and methods). PCR products were cloned and
six of them were sequenced, identifying the nucleotide shown by asterisk as the 5¢end of a-F1-ATPase cDNA.
4006 A. Talamillo et al.(Eur. J. Biochem. 271)FEBS 2004
transcriptional apparatus to the a-F1-ATPase promoter.
Furthermore, several short sequences commonly found
downstream of transcriptional initiation sites in Drosophila
promoters include ACGT, ACAA, ACAG, and AACA
[32], and these were detected at )17, )18, )36 and )103
positions of the a-F1-ATPase gene (position relative to
ATG). However, the region did not contain a canonical
downstream promoter element (DPE), which is recognized
by the TAFII60 factor [33]. Indeed, the short elements
described above probably substitute for the DPE motif in
the Drosophila a-F1-ATPase promoter.
Functional analysis of the a-F1-ATPase promoter region
The function of the Drosophila a-F1-ATPase promoter
region was characterized by transient transfection into
Schneider SL2 cells. A series of deletions of the 5¢upstream
region of the gene were cloned in the pXp2 vector that
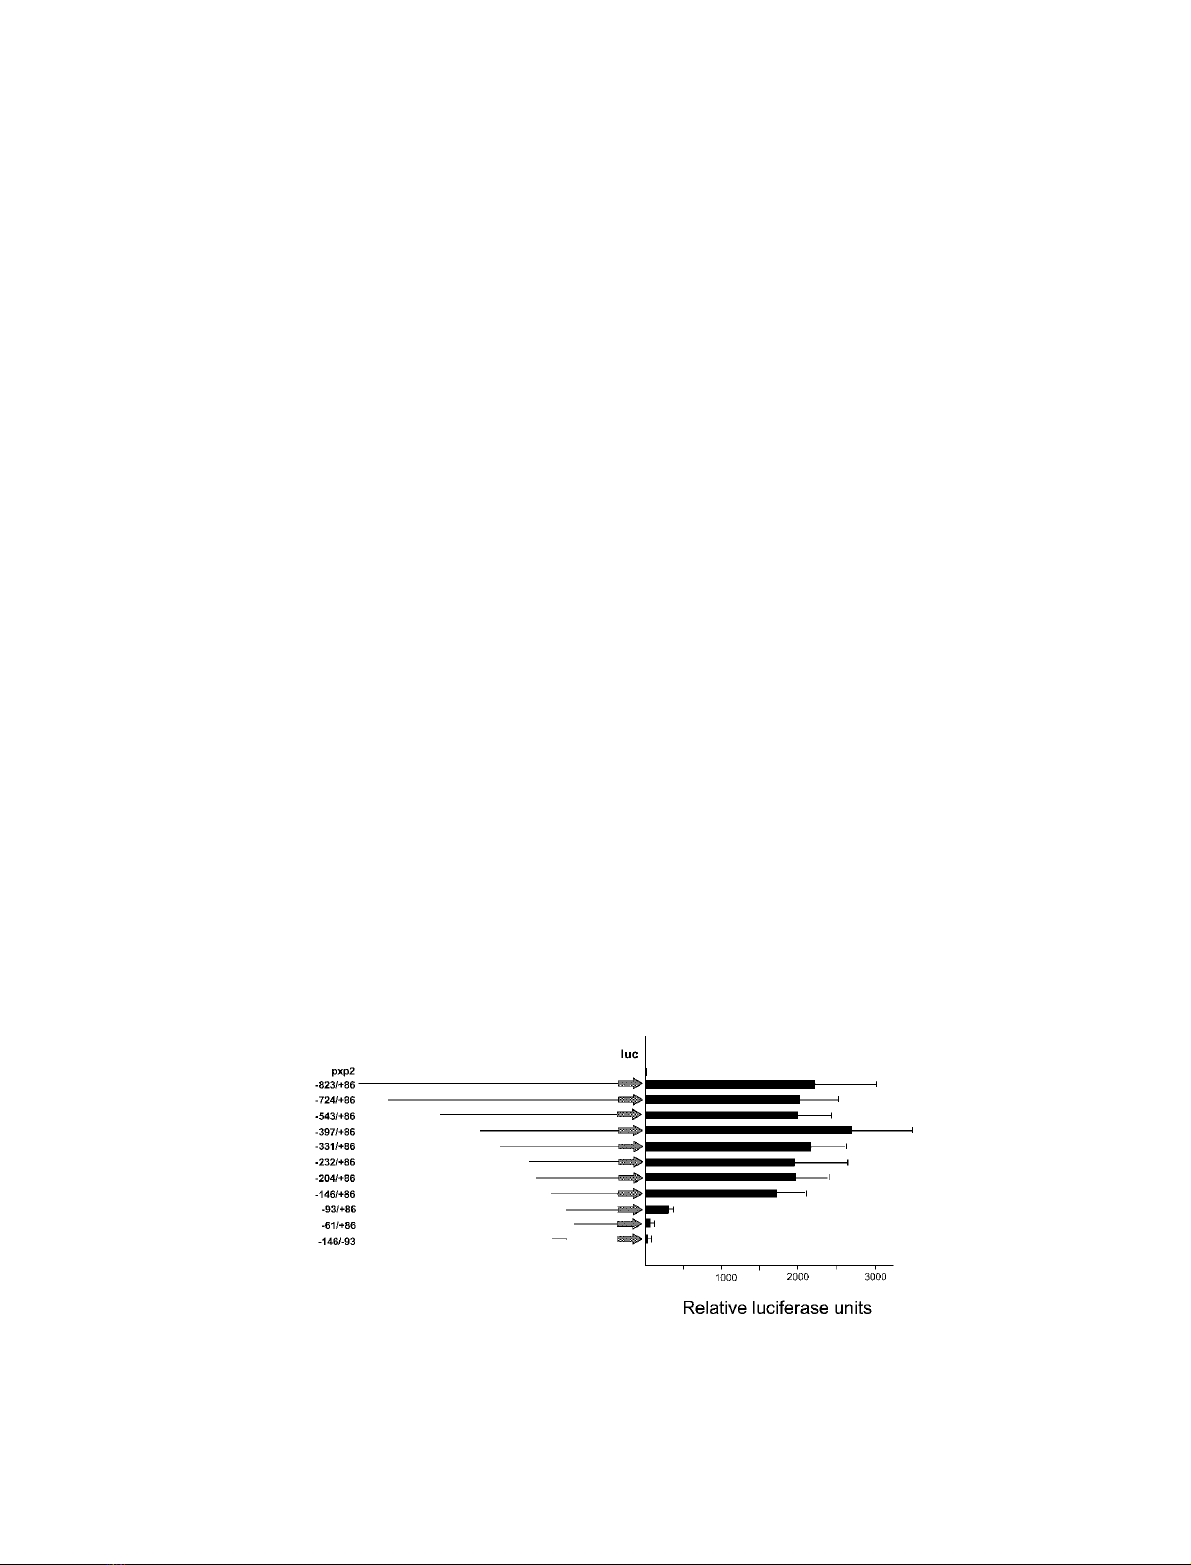
contains the luciferase reporter gene. A construct containing
the )823/+86 region (position +1 corresponds to the main
transcriptional initiation site located 91 nucleotides
upstream of the ATG initiation codon) promoted substan-
tial luciferase activity in Schneider cells, 2,300-fold higher
than the native pXP2 vector (Fig. 3). This activity was
orientation-dependent and indicates that the a-F1-ATPase
5¢proximal upstream region contains a strong promoter,
with similar activity in Schneider cells to the promoter of
the b-F1-ATPase gene [34] and 10-fold stronger than
the promoter of the gene encoding the catalytic subunit of
the mitochondrial DNA polymerase [25]. Similar luciferase
activity was maintained even when the upstream region was
reduced and contained only the )146/+86 region. In
contrast, a construct containing the )93/+86 region had
significantly lower promoter activity, reaching only 13% of
the maximal activity, while the )61/+86 construct directed
similar levels of luciferase activity as the pXp2 vector
(Fig. 3).
These results indicated that although the 53 bp DNA
region located between nucleotides )146/)93 does not
itself have promoter activity, it contains DNA elements
critical for the activation of the a-F1-ATPase promoter.
Computer analysis revealed the presence of two DNA
sequence motifs in this region potentially recognized by
the GAGA factor (GAF) and the alcohol dehydrogenase
distal factor (Adf-1), respectively (Fig. 4A). GAF is a
Drosophila regulatory protein that overcomes transcrip-
tional repression produced by histones at the chromatin
level [35]. Adf-1 was initially identified as an activator of
the alcohol dehydrogenase (Adh) promoter and was
subsequently shown to control the expression of several
Drosophila genes [36,37].Interestingly, it has been shown
that GAF and Adf-1 act together to remodel nucleosome
structure and activate transcription both in vitro and
in vivo [38].
To analyse the involvement of the potential GAF and
Adf-1 binding sites in activating the a-F1-ATPase
promoter, we eliminated the target sequences by site-
directed mutagenesis and examined the activity of the
mutated constructs in cell transfection assays. Mutating
the GAGA or Adf-1 elements individually significantly
reduced promoter activity by up to 40–60%, whereas
when both sites were abolished, the activity of the
promoter was reduced by 75% (Fig. 4B). In addition, we
carried out cotransfection studies in Schneider cells using
different a-F1-ATPase promoter constructs and a plasmid
that express GAF under the control of the actin 5C
promoter. The GAGA factor stimulated at least threefold
the activity of the promoter in constructs )397/+86 and
)146/+86, but had no effect on the activity of the
construct )93/+86, which does not contain the potential
GAF binding site (Fig. 4C).
The combination of GAF/Adf-1 has been shown to
activate transcription in a variety of promoter contexts.
Hence, we generated a construct containing a 56 bp
DNA fragment ()144/)89) that included the GAGA and
Adf-1 elements linked to the basal promoters of the
d-aminolevulinate synthase (ALAS)andb-F1-ATPase
genes [29,34]. In both constructs there was a substantial
Fig. 3. Functional analysis of the D. melanogaster a-F1-ATPase promoter. Scheme of the a-F1-ATPase promoter constructs used for transient
transfection assays in Schneider cells (see Materials and methods). The promoter regions are represented by solid lines and the luciferase reporter
gene is shown as a solid arrow. The numbers to the left of each construct indicate the limit of the promoter fragment with reference to the
transcription start point as established in this study. The relative promoter activities of the constructs measured in the luciferase assay are indicated
on the right by black boxes. The luciferase activity of the vector with no insert was defined as being equal to one. Luciferase activity was normalized
to the b-galactosidase activity of cotransfected control plasmid. Values are the means ± SD of at least five independent experiments.
FEBS 2004 Drosophila a-F
1
-ATPase gene expression (Eur. J. Biochem. 271) 4007


%20--%3e%3cdefs%3e%3cstyle%3e%20.st0%20{%20fill:%20%23fff;%20}%20.st1%20{%20fill:%20%237800fa;%20}%20%3c/style%3e%3c/defs%3e%3cpath%20class='st1'%20d='M117.78,12.18H43.11c2.9,3.47,4.65,7.94,4.65,12.82,0,5.6-2.3,10.66-6.01,14.29h76.02l7.22-13.56-7.22-13.56Z'/%3e%3cg%3e%3cpath%20class='st0'%20d='M53.58,26.17h-.59v-1.46h.59v-4.96h2.83c1.78,0,2.67.94,2.67,2.82v5.76c0,1.87-.89,2.81-2.67,2.81h-2.83v-4.96ZM55.36,21.37v3.34h1.1v1.46h-1.1v3.34h1.01c.61,0,.91-.37.91-1.1v-5.93c0-.74-.3-1.1-.91-1.1h-1.01Z'/%3e%3cpath%20class='st0'%20d='M65.99,31.14h-1.8l-.31-2.07h-2.19l-.31,2.07h-1.64l1.82-11.39h2.62l1.82,11.39ZM65.28,18.04c-.25.46-.51.77-.75.94-.21.15-.47.22-.79.22-.26,0-.57-.07-.92-.22l-.38-.15c-.14-.05-.26-.07-.37-.07-.3,0-.53.18-.71.54l-.91-.68c.25-.46.51-.77.75-.94.21-.14.48-.21.79-.21.26,0,.57.07.92.21l.38.15c.14.05.26.07.37.07.3,0,.53-.18.71-.54l.91.68ZM61.91,27.52h1.73l-.87-5.76-.87,5.76Z'/%3e%3cpath%20class='st0'%20d='M74.53,26.89v1.52c0,1.91-.89,2.86-2.67,2.86s-2.67-.95-2.67-2.86v-5.93c0-1.91.89-2.86,2.67-2.86s2.67.95,2.67,2.86v1.11h-1.69v-1.22c0-.75-.31-1.12-.93-1.12s-.93.37-.93,1.12v6.15c0,.74.31,1.11.93,1.11s.93-.37.93-1.11v-1.63h1.69Z'/%3e%3cpath%20class='st0'%20d='M81.4,31.14h-1.8l-.31-2.07h-2.19l-.31,2.07h-1.64l1.82-11.39h2.62l1.82,11.39ZM75.9,19.2l1.52-1.91h1.71l1.51,1.91h-1.61l-.76-.95-.75.95h-1.61ZM77.32,27.52h1.73l-.87-5.76-.87,5.76ZM83.1,15.99l-1.76,1.91h-1.26l1.17-1.91h1.86Z'/%3e%3cpath%20class='st0'%20d='M84.86,19.75c1.78,0,2.67.94,2.67,2.82v1.48c0,1.87-.89,2.81-2.67,2.81h-.85v4.28h-1.79v-11.39h2.64ZM84.01,21.37v3.86h.85c.58,0,.87-.36.87-1.08v-1.71c0-.71-.29-1.07-.87-1.07h-.85Z'/%3e%3cpath%20class='st0'%20d='M93.51,19.75c1.78,0,2.67.94,2.67,2.82v1.48c0,1.87-.89,2.81-2.67,2.81h-.85v4.28h-1.79v-11.39h2.64ZM92.66,21.37v3.86h.85c.58,0,.87-.36.87-1.08v-1.71c0-.71-.29-1.07-.87-1.07h-.85Z'/%3e%3cpath%20class='st0'%20d='M98.8,31.14h-1.79v-11.39h1.79v4.88h2.03v-4.88h1.83v11.39h-1.83v-4.88h-2.03v4.88Z'/%3e%3cpath%20class='st0'%20d='M105.36,24.55h2.46v1.62h-2.46v3.34h3.09v1.63h-4.88v-11.39h4.88v1.63h-3.09v3.18ZM108.17,17.29l-1.76,1.91h-1.26l1.17-1.91h1.86Z'/%3e%3cpath%20class='st0'%20d='M112.2,19.75c1.78,0,2.67.94,2.67,2.82v1.48c0,1.87-.89,2.81-2.67,2.81h-.85v4.28h-1.79v-11.39h2.64ZM111.35,21.37v3.86h.85c.58,0,.87-.36.87-1.08v-1.71c0-.71-.29-1.07-.87-1.07h-.85Z'/%3e%3c/g%3e%3ccircle%20class='st1'%20cx='25'%20cy='25'%20r='20'/%3e%3cpath%20class='st0'%20d='M32.78,19.27c2.92,0,4.43,2.55,5.28,5.33l.71,2.17c.14.38-.33.75-.71.75h-5.61c.19-.33.24-.71.09-1.08l-.75-2.45c-.43-1.32-.99-2.64-1.79-3.77.75-.57,1.65-.94,2.78-.94h0ZM25,18.38c3.25,0,4.9,2.78,5.89,5.89l.76,2.45c.14.42-.33.8-.8.8h-11.69c-.42,0-.94-.38-.8-.8l.75-2.45c.99-3.11,2.64-5.89,5.89-5.89h0ZM25,11.35c1.74,0,3.11,1.37,3.11,3.11s-1.37,3.11-3.11,3.11-3.11-1.41-3.11-3.11,1.41-3.11,3.11-3.11h0ZM17.27,19.27c1.08,0,1.98.38,2.73.94-.8,1.13-1.37,2.45-1.74,3.77l-.8,2.45c-.14.38-.05.75.09,1.08h-5.56c-.42,0-.9-.38-.75-.75l.71-2.17c.9-2.78,2.41-5.33,5.33-5.33h0ZM17.27,12.91c1.51,0,2.78,1.27,2.78,2.83s-1.27,2.83-2.78,2.83-2.83-1.27-2.83-2.83,1.27-2.83,2.83-2.83h0ZM32.78,12.91c1.56,0,2.78,1.27,2.78,2.83s-1.23,2.83-2.78,2.83-2.83-1.27-2.83-2.83,1.27-2.83,2.83-2.83h0ZM27.07,28.56v.09c0,.57-.24,1.08-.61,1.46h0v.05c-.38.33-.9.57-1.46.57s-1.08-.24-1.46-.61h0c-.38-.38-.61-.9-.61-1.46v-.09h1.41v.09c0,.19.05.38.19.47v.05c.09.09.28.19.47.19s.38-.09.47-.19v-.05c.14-.09.24-.28.24-.47t-.05-.09h1.41ZM30.99,28.56v.09c0,1.65-.66,3.16-1.74,4.24-1.08,1.08-2.59,1.79-4.24,1.79s-3.16-.71-4.24-1.79l-.05-.05c-1.04-1.08-1.7-2.55-1.7-4.2v-.09h1.41v.09c0,1.27.47,2.4,1.27,3.25h.05c.85.85,1.98,1.37,3.25,1.37s2.4-.52,3.25-1.37c.85-.8,1.37-1.98,1.37-3.25v-.09h1.37ZM34.99,28.56v.09c0,2.78-1.13,5.28-2.92,7.07-1.79,1.79-4.29,2.92-7.07,2.92s-5.23-1.13-7.07-2.92c-1.79-1.79-2.92-4.29-2.92-7.07v-.09h1.41v.09c0,2.4.94,4.53,2.5,6.08,1.56,1.56,3.72,2.5,6.08,2.5s4.52-.94,6.08-2.5c1.56-1.56,2.5-3.68,2.5-6.08v-.09h1.41Z'/%3e%3c/svg%3e)