
Research article
S
Seeaarrcchh ffoorr aa ‘‘TTrreeee ooff LLiiffee’’ iinn tthhee tthhiicckkeett ooff tthhee pphhyyllooggeenneettiicc ffoorreesstt
Pere Puigbò, Yuri I Wolf and Eugene V Koonin
Address: National Center for Biotechnology Information, National Library of Medicine, National Institutes of Health, Bethesda, MD 20894, USA.
Correspondence: Eugene V Koonin. Email: koonin@ncbi.nlm.nih.gov
AAbbssttrraacctt
B
Baacckkggrroouunndd::Comparative genomics has revealed extensive horizontal gene transfer among
prokaryotes, a development that is often considered to undermine the ‘tree of life’ concept.
However, the possibility remains that a statistical central trend still exists in the phylogenetic
‘forest of life’.
R
Reessuullttss::A comprehensive comparative analysis of a ‘forest’ of 6,901 phylogenetic trees for
prokaryotic genes revealed a consistent phylogenetic signal, particularly among 102 nearly
universal trees, despite high levels of topological inconsistency, probably due to horizontal
gene transfer. Horizontal transfers seemed to be distributed randomly and did not obscure
the central trend. The nearly universal trees were topologically similar to numerous other
trees. Thus, the nearly universal trees might reflect a significant central tendency, although
they cannot represent the forest completely. However, topological consistency was seen
mostly at shallow tree depths and abruptly dropped at the level of the radiation of archaeal
and bacterial phyla, suggesting that early phases of evolution could be non-tree-like (Biological
Big Bang). Simulations of evolution under compressed cladogenesis or Biological Big Bang
yielded a better fit to the observed dependence between tree inconsistency and phylogenetic
depth for the compressed cladogenesis model.
C
Coonncclluussiioonnss::Horizontal gene transfer is pervasive among prokaryotes: very few gene trees
are fully consistent, making the original tree of life concept obsolete. A central trend that
most probably represents vertical inheritance is discernible throughout the evolution of
archaea and bacteria, although compressed cladogenesis complicates unambiguous resolution
of the relationships between the major archaeal and bacterial clades.
BBaacckkggrroouunndd
The tree of life is, probably, the single dominating meta-
phor that permeates the discourse of evolutionary biology,
from the famous single illustration in Darwin’s On the
Origin of Species [1] to 21st-century textbooks. For about a
century, from the publication of the Origin to the founding
Journal of Biology
2009, 8
8::59
Open Access
Published: 13 July 2009
Journal of Biology
2009, 8
8::59 (doi:10.1186/jbiol159)
The electronic version of this article is the complete one and can be
found online at http://jbiol.com/content/8/6/59
Received: 25 April 2009
Revised: 19 May 2009
Accepted: 12 June 2009
© 2009 Puigbò
et al.
; licensee BioMed Central Ltd.
This is an Open Access article distributed under the terms of the Creative Commons Attribution License (http://creativecommons.org/licenses/by/2.0),
which permits unrestricted use, distribution, and reproduction in any medium, provided the original work is properly cited.

work in molecular evolution carried out by Zuckerkandl
and Pauling in the early 1960s [2,3], phylogenetic trees
were constructed on the basis of phenotypic differences
between organisms. Accordingly, every tree constructed
during that century was an ‘organismal’ or ‘species’ tree by
definition; that is, it was assumed to reflect the evolutionary
history of the corresponding species. Zuckerkandl and
Pauling introduced molecular phylogeny, but for the next
two decades or so it was viewed simply as another, perhaps
most powerful, approach to the construction of species trees
and, ultimately, the tree of life that would embody the
evolutionary relationships between all lineages of cellular
life forms. The introduction of rRNA as the molecule of
choice for the reconstruction of the phylogeny of
prokaryotes by Woese and co-workers [4,5], which was
accompanied by the discovery of a new domain of life - the
Archaea - boosted hopes that the detailed, definitive topo-
logy of the tree of life could be within sight.
Even before the advent of extensive genomic sequencing, it
had become clear that biologically important common
genes of prokaryotes had experienced multiple horizontal
gene transfers (HGTs), so the idea of a ‘net of life’
potentially replacing the tree of life was introduced [6,7].
Advances in comparative genomics revealed that different
genes very often had distinct tree topologies and, accordingly,
that HGT seemed to be extremely common among pro-
karyotes (bacteria and archaea) [8-17], and could also have
been important in the evolution of eukaryotes, especially as
a consequence of endosymbiotic events [18-21]. These
findings indicate that a true, perfect tree of life does not
exist because HGT prevents any single gene tree from being
an accurate representation of the evolution of entire
genomes. The nearly universal realization that HGT among
prokaryotes is common and extensive, rather than rare and
inconsequential, led to the idea of ‘uprooting’ the tree of
life, a development that is often viewed as a paradigm shift
in evolutionary biology [11,22,23].
Of course, no amount of inconsistency between gene phylo-
genies caused by HGT or other processes can alter the fact
that all cellular life forms are linked by a tree of cell
divisions (Omnis cellula e cellula, quoting the famous motto
of Rudolf Virchow - paradoxically, an anti-evolutionist [24])
that goes back to the earliest stages of evolution and is only
violated by endosymbiotic events that were key to the
evolution of eukaryotes but not prokaryotes [25]. Thus, the
travails of the tree of life concept in the era of comparative
genomics concern the tree as it can be derived by the phylo-
genetic (phylogenomic) analysis of genes and genomes. The
claim that HGT uproots the tree of life more accurately has
to be read to mean that extensive HGT has the potential to
result in the complete decoupling of molecular phylogenies
from the actual tree of cells. It should be kept in mind that
the evolutionary history of genes also describes the evolu-
tion of the encoded molecular functions, so the phylo-
genomic analyses have clear biological connotations. In this
article we discuss the phylogenomic tree of life with this
implicit understanding.
The views of evolutionary biologists on the changing status
of the tree of life (see [23] for a conceptual discussion) span
the entire range from persistent denial of the major
importance of HGT for evolutionary biology [26,27]; to
‘moderate’ overhaul of the tree of life concept [28-33]; to
radical uprooting whereby the representation of the evolu-
tion of organisms (or genomes) as a tree of life is declared
meaningless [34-36]. The moderate approach maintains
that all the differences between individual gene trees
notwithstanding, the tree of life concept still makes sense as
a representation of a central trend (consensus) that, at least
in principle, could be elucidated by comprehensive com-
parison of tree topologies. The radical view counters that
the reality of massive HGT renders illusory the very distinc-
tion between the vertical and horizontal transmission of
genetic information, so that the tree of life concept should
be abandoned altogether in favor of a (broadly defined)
network representation of evolution [17]. Perhaps the tree
of life conundrum is epitomized in the recent debate on the
tree that was generated from a concatenation of alignments
of 31 highly conserved proteins and touted as an auto-
matically constructed, highly resolved tree of life [37], only
to be dismissed with the label of a ‘tree of one percent’ (of
the genes in any given genome) [38].
Here we report an exhaustive comparison of approximately
7,000 phylogenetic trees for individual genes that collec-
tively comprise the ‘forest of life’ and show that this set of
trees does gravitate to a single tree topology, but that the
deep splits in this topology cannot be unambiguously
resolved, probably due to both extensive HGT and
methodological problems of tree reconstruction. Neverthe-
less, computer simulations indicate that the observed pattern
of evolution of archaea and bacteria better corresponds to a
compressed cladogenesis model [39,40] than to a ‘Big Bang’
model that includes non-tree-like phases of evolution [36].
Together, these findings seem to be compatible with the
‘tree of life as a central trend’ concept.
R
Reessuullttss aanndd ddiissccuussssiioonn
T
Thhee ffoorreesstt ooff lliiffee:: ffiinnddiinngg ppaatthhss iinn tthhee tthhiicckkeett
Altogether, we analyzed 6,901 maximum likelihood phylo-
genetic trees that were built for clusters of orthologous groups
of proteins (COGs) from the COG [41,42] and EggNOG [43]
databases that included a selected, representative set of 100
59.2
Journal of Biology
2009, Volume 8, Article 59 Puigbò
et al.
http://jbiol.com/content/8/6/59
Journal of Biology
2009, 8
8::59
prokaryotes (41 archaea and 59 bacteria; Additional data
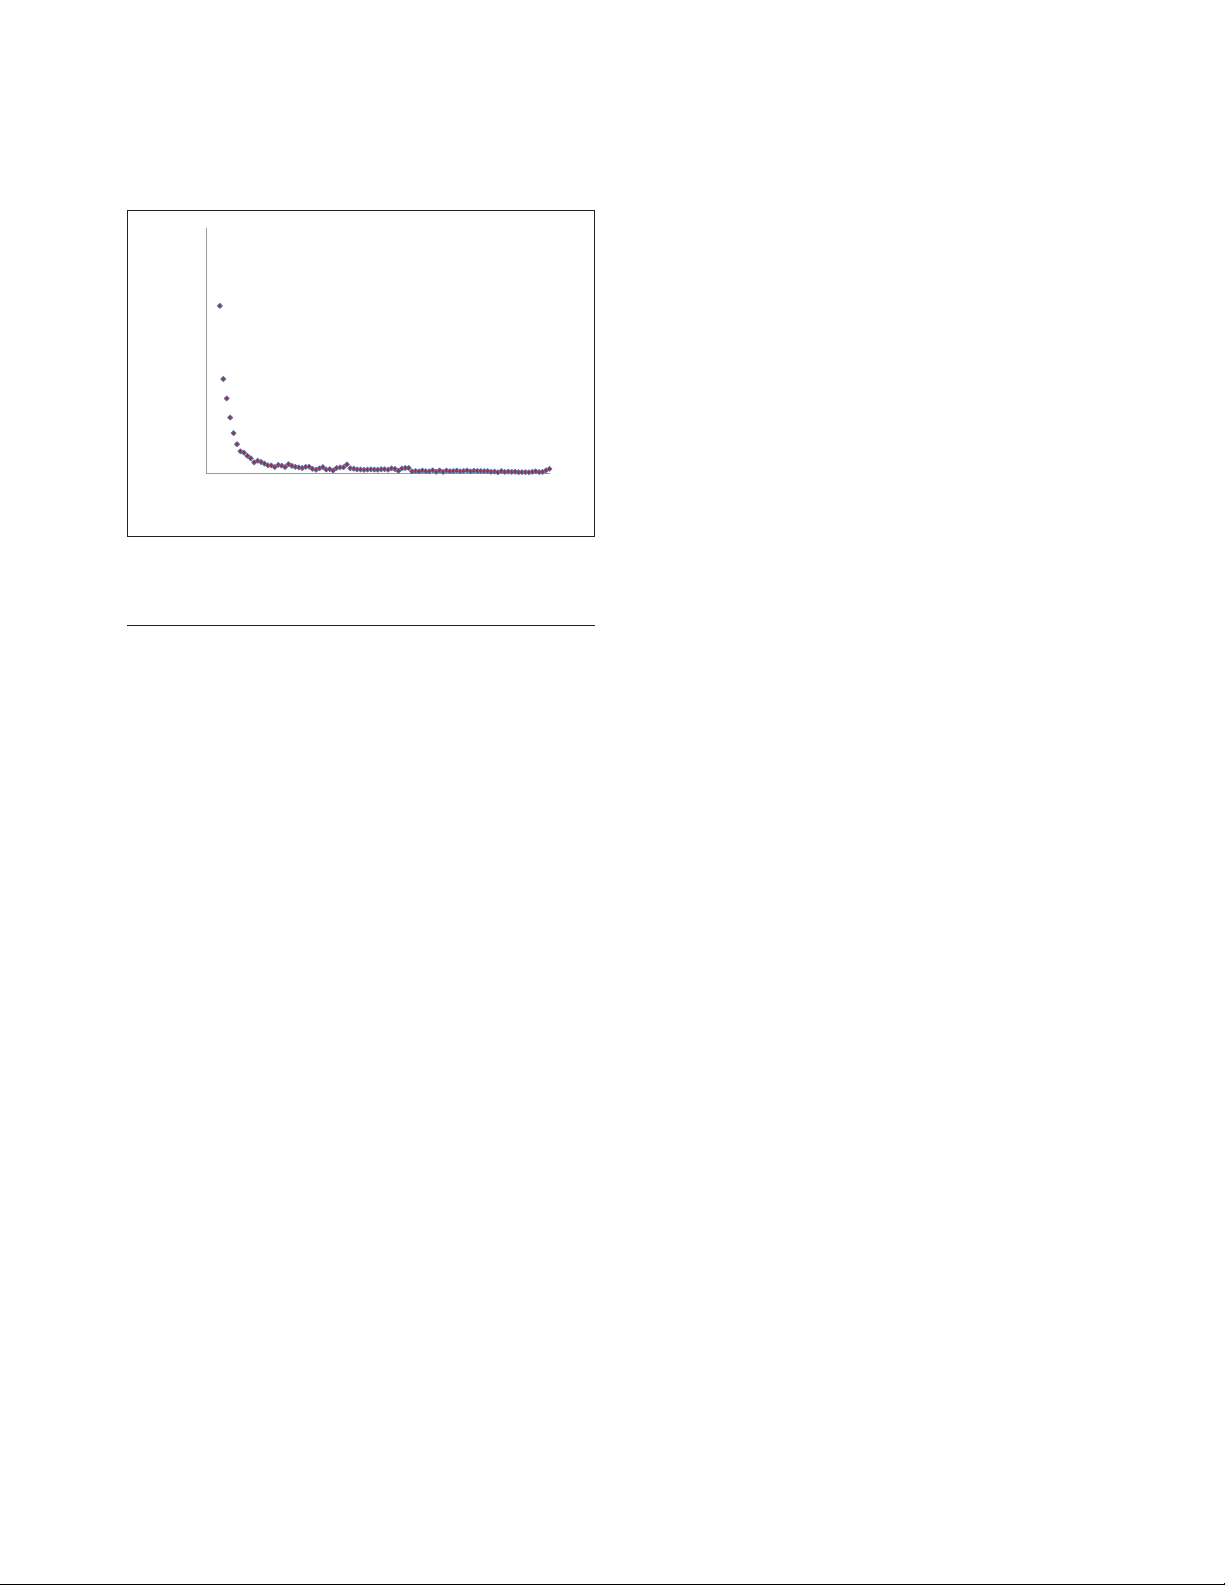
files 1 and 2). The majority of these trees include only a
small number of species (less than 20): the distribution of
the number of species in trees shows an exponential decay,
with only 2,040 trees including more than 20 species
(Figure 1). We attempted to identify patterns in this collec-
tion of trees (forest of life) and, in particular, to address the
question whether or not there exists a central trend among
the trees that, perhaps, could be considered an approxi-
mation of a tree of life. The principal object of this analysis
was a complete, all-against-all matrix of the topological
distances between the trees (see Materials and methods for
details). This matrix was represented as a network of trees
and was also subject to classical multidimensional scaling
(CMDS) analysis aimed at the detection of distinct clusters
of trees. We further introduced the inconsistency score (IS),
a measure of how representative the topology of the given
tree is of the entire forest of life (the IS is the fraction of the
times the splits from a given tree are found in all trees of the
forest). The key aspect of the tree analysis using the IS is that
we objectively examine trends in the forest of life, without
relying on the topology of a preselected ‘species tree’ such as
a supertree used in the most comprehensive previous study
of HGT [31] or a tree of concatenated highly conserved
proteins or rRNAs [17,37,44].
In general, trees consist of different sets of species, mostly
small numbers (Figure 1), so the comparison of the tree
topologies involves a pruning step where the trees are
reduced to the overlap in the species sets; in many cases, the
species sets do not overlap, so the distance between the
corresponding trees cannot be calculated (see Materials and
methods). To avoid the uncertainty associated with the
pruning procedure and to explore the properties of those
few trees that could be considered to represent the ‘core of
life’, we analyzed, along with the complete set of trees, a
subset of nearly universal trees (NUTs). As the strictly uni-
versal gene core of cellular life is very small and continues
to shrink (owing to the loss of generally ‘essential’ genes in
some organisms with small genomes, and to errors of
genome annotation) [45,46], we defined NUTs as trees for
those COGs that were represented in more than 90% of the
included prokaryotes; this definition yielded 102 NUTs. Not
surprisingly, the great majority of the NUTs are genes
encoding proteins involved in translation and the core
aspects of transcription (Additional data file 3). For most of
the analyses described below, we analyzed the NUTs in
parallel with the complete set of trees in the forest of life or
else traced the position of the NUTs in the results of the
global analysis; however, this approach does not amount to
using the NUTs as an a priori standard against which to
compare the rest of the trees.
T
Thhee NNUUTTss ccoonnttaaiinn aa ssttrroonngg,, ccoonnssiisstteenntt pphhyyllooggeenneettiicc ssiiggnnaall,,
w
wiitthh iinnddeeppeennddeenntt HHGGTT eevveennttss
We begin the systematic exploration of the forest of life with
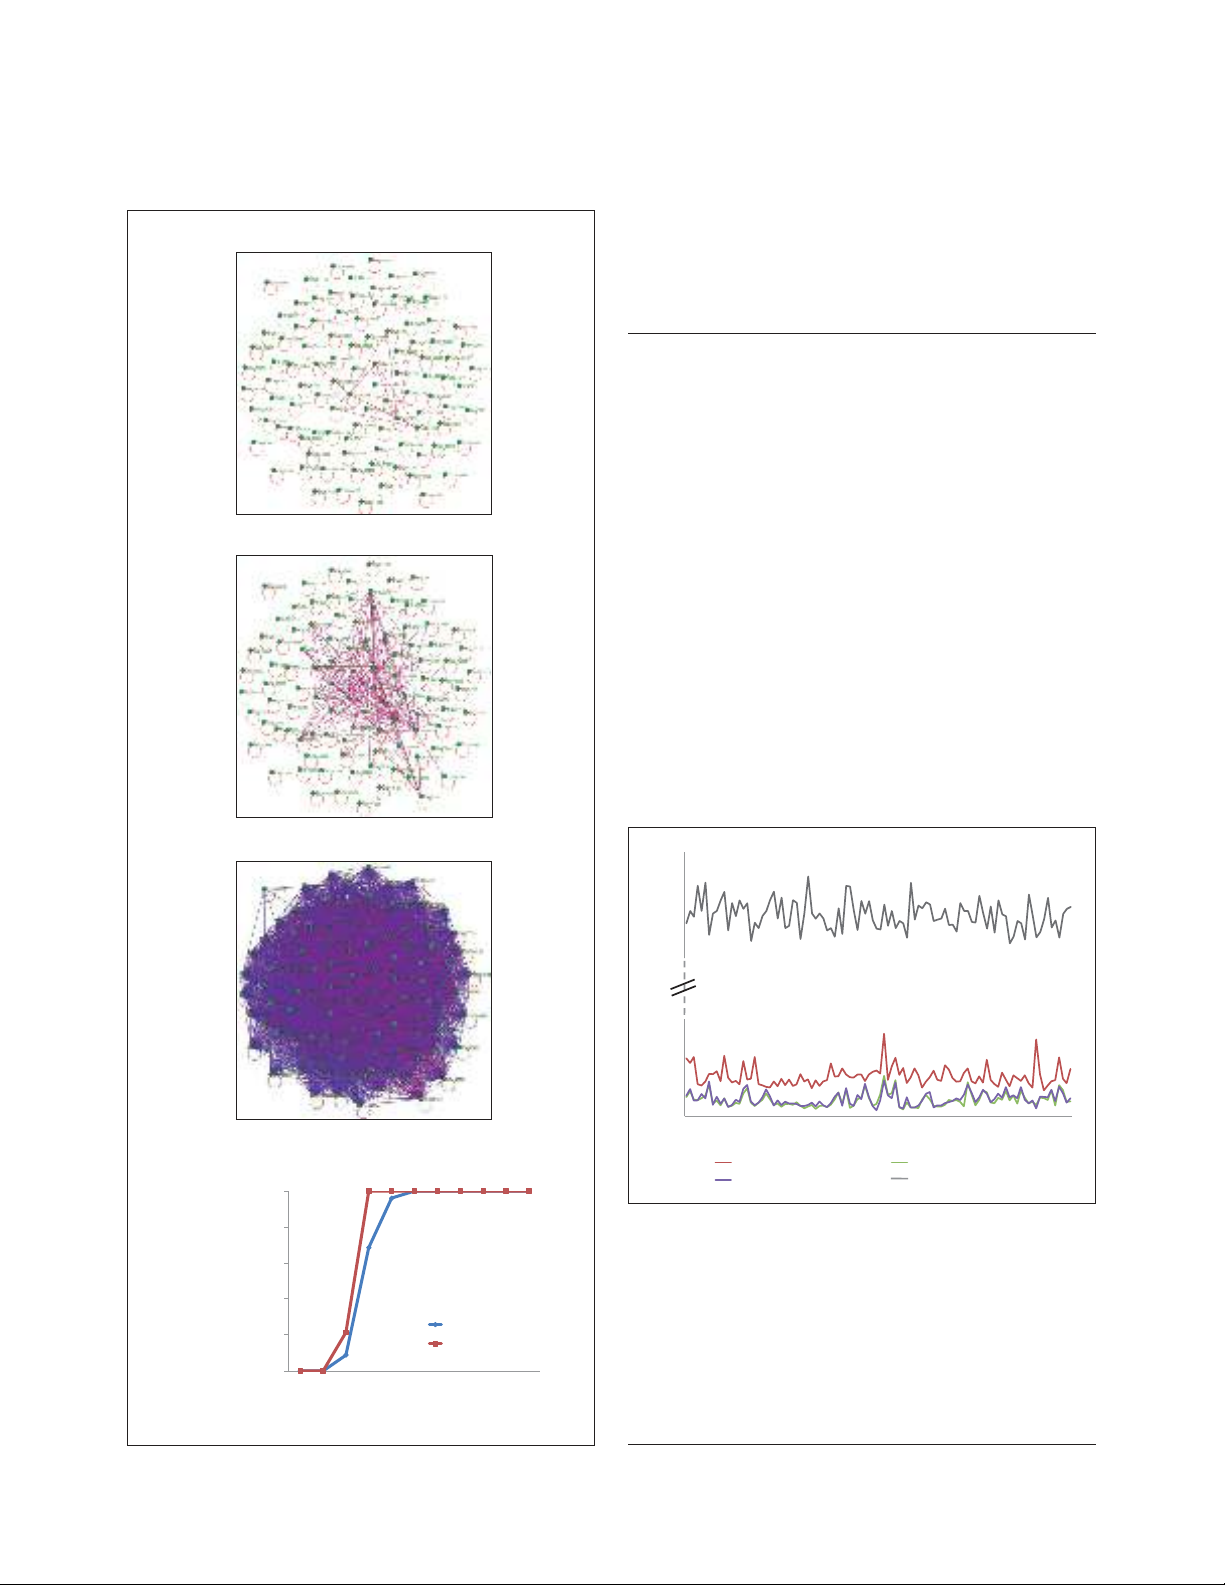
the grove of 102 NUTs. Figure 2a shows the network of
connections between the NUTs on the basis of topological
similarity. The results of this analysis indicated that the
topologies of the NUTs were, in general, highly coherent,
with a nearly full connectivity reached at 50% similarity
((1 - BSD) × 100) cutoff (BSD is boot split distance; see
Materials and methods for details; Figure 2b).
In 56% of the NUTs, archaea and bacteria were perfectly
separated, whereas the remaining 44% showed indications
of HGT between archaea and bacteria (13% from archaea to
bacteria, 23% from bacteria to archaea and 8% in both
directions; see Materials and methods for details and
Additional data file 3). In the rest of the NUTs, there was no
sign of such interdomain gene transfer but there were many
probable HGT events within one or both domains (data not
shown).
The inconsistency among the NUTs ranged from 1.4 to
4.3%, whereas the mean value of inconsistency for an
equal-sized set (102) of randomly generated trees with the
same number of species was approximately 80%
(Figure 3), indicating that the topologies of the NUTs are
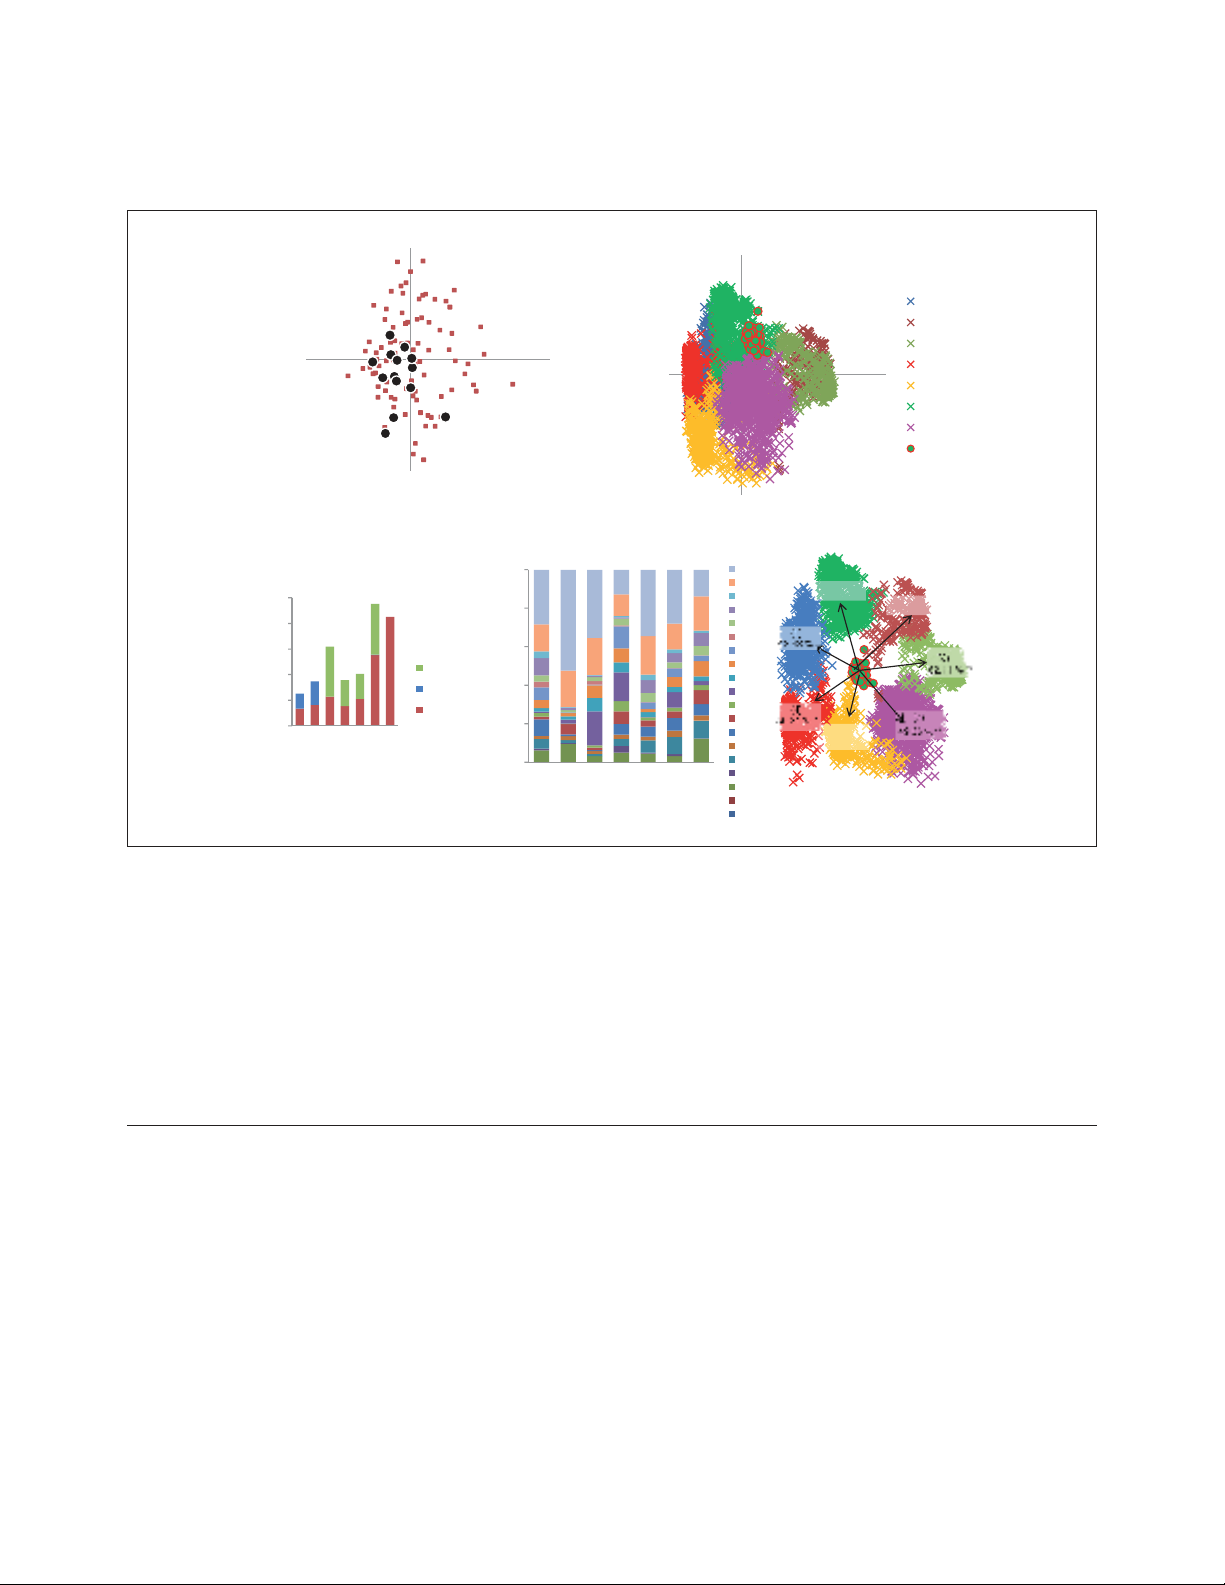
highly consistent and non-random. We explored the
relationships among the 102 NUTs by embedding them
into a 30-dimensional tree space using the CMDS proce-
dure [47,48] (see Materials and methods for details). The
gap statistics analysis [49] reveals a lack of significant
clustering among the NUTs in the tree space. Thus, all the
NUTs seem to belong to a single, unstructured cloud of
points scattered around a single centroid (Figure 4a). This
http://jbiol.com/content/8/6/59
Journal of Biology
2009, Volume 8, Article 59 Puigbò
et al.
59.3
Journal of Biology
2009, 8
8::59
FFiigguurree 11
The distribution of the trees in the forest of life by the number of
species.
0
1,000
2,000
0 20406080100
Number of trees
Number of species in tree
organization of the tree space is most compatible with
individual trees randomly deviating from a single,
dominant topology (the tree of life), apparently as a result
of HGT (but possibly also due to random errors in the tree-
construction procedure). To further assess the potential
contribution of phylogenetic analysis artifacts to observed
inconsistencies between the NUTs, we carried out a
comparative analysis of these trees with different bootstrap
support thresholds (that is, only splits supported by
bootstrap values above the respective threshold value were
compared). As shown in Figure 3, particularly low IS levels
were detected for splits with high-bootstrap support, but
the inconsistency was never eliminated completely, sug-
gesting that HGT is a significant contributor to the observed
inconsistency among the NUTs.
For most of the NUTs, the corresponding COGs included
paralogs in some organisms, so the most conserved paralog
59.4
Journal of Biology
2009, Volume 8, Article 59 Puigbò
et al.
http://jbiol.com/content/8/6/59
Journal of Biology
2009, 8
8::59
FFiigguurree 33
Topological inconsistency of the 102 NUTs compared with random
trees of the same size. The NUTs are shown by red lines and ordered
by increasing inconsistency score (IS) values. Grey lines show the IS
values for the random trees corresponding to each of the NUTs. Each
random tree had the same set of species as the corresponding NUT.
The IS of each NUT was calculated using as the reference all 102 NUTs
and the IS of each random tree was calculated using as the reference all
102 random trees. Also shown are the IS values obtained for those
partitions of each NUT that were supported by bootstrap values
greater than 70% or less than 90%.
0.0%
2.5%
5.0%
COG0006
COG0009
COG0013
COG0018
COG0024
COG0037
COG0049
COG0052
COG0060
COG0071
COG0081
COG0086
COG0088
COG0090
COG0092
COG0094
COG0097
COG0099
COG0102
COG0105
COG0124
COG0126
COG0130
COG0142
COG0148
COG0164
COG0171
COG0177
COG0185
COG0195
COG0198
COG0201
COG0231
COG0244
COG0256
COG0329
COG0358
COG0441
COG0452
COG0459
COG0462
COG0480
COG0495
COG0519
COG0525
COG0528
COG0537
COG0541
COG0621
COG1080
COG2812
IS IS (Bootstrap threshold ≥ 70)
IS (Bootstrap threshold ≥ 90)
70.0%
80.0%
90.0%
100.0%
IS (Random ‘NUTs’)
IS
0%
20%
40%
60%
80%
100%
100 90 80 70 60 50 40 30 20 10 0
Percentage of NUTs connected
to the network
Percentage of similarity
NUTs
NUTs (1:1)
(b)
(a)
≥ 80% of similarity
≥ 75% of similarity
≥ 50% of similarity
FFiigguurree 22
The network of similarities among the nearly universal trees (NUTs).
((aa)) Each node (green dot) denotes a NUT, and nodes are connected by
edges if the similarity between the respective edges exceeds the
indicated threshold. ((bb)) The connectivity of 102 NUTs and the 14 1:1
NUTs depending on the topological similarity threshold.
was used for tree construction (see Materials and methods
for details). However, 14 NUTs corresponded to COGs
consisting strictly of 1:1 orthologs (all of them ribosomal
proteins). These 1:1 NUTs were similar to others in terms of
connectivity in the networks of trees, although their
characteristic connectivity was somewhat greater than that
of the rest of the NUTs (Figure 2b) or their positions in the
single cluster of NUTs obtained using CMDS (Figure 4a),
indicating that the selection of conserved paralogs for tree
analysis in the other NUTs did not substantially affect the
results of topology comparison.
The NUTs include highly conserved genes whose phylogenies
have been extensively studied previously. It is not our aim
here to compare these phylogenies in detail and to discuss
the implications of particular tree topologies. Nevertheless,
it is worth noting, by way of a reality check, that the
putative HGT events between archaea and bacteria detected
here by the separation score analysis (see Materials and
methods for details) are compatible with previous observa-
tions (Additional data file 3). In particular, HGT was inferred
for 83% of the genes encoding aminoacyl-tRNA synthetases
(compared with the overall 44%), essential components of
http://jbiol.com/content/8/6/59
Journal of Biology
2009, Volume 8, Article 59 Puigbò
et al.
59.5
Journal of Biology
2009, 8
8::59
FFiigguurree 44
Clustering of the NUTs and the trees in the forest of life using the classical multidimensional scaling (CMDS) method. (
(aa)) The best two-dimensional
projection of the clustering of 102 NUTs (brown squares) in a 30-dimensional space. The 14 1:1 NUTs (corresponding to COGs consisting of 1:1
orthologs) are shown as black circles. V1, V2, variables 1 and 2, respectively. ((bb)) The best two-dimensional projection of the clustering of the 3,789
COG trees in a 669-dimensional space. The seven clusters are color-coded and the NUTs are shown by red circles. ((cc)) Partitioning of the trees in
each cluster between the two prokaryotic domains: blue, archaea-only (A); green, bacteria-only (B); brown, COGs including both archaea and
bacteria (A&B). ((dd)) Classification of the trees in each cluster by COG functional categories [41,42]: A, RNA processing and modification; B,
chromatin structure and dynamics; C, energy transformation; D, cell division and chromosome partitioning; E, amino acid metabolism and transport;
F, nucleotide metabolism and transport; G, carbohydrate metabolism and transport; H, coenzyme metabolism and transport; I, lipid metabolism; J,
translation and ribosome biogenesis; K, transcription; L, replication and repair; M, cell envelope and outer membrane biogenesis; N, cell motility and
secretion; O, post-translational modification, protein turnover, chaperones; P, inorganic ion transport and metabolism; Q, secondary metabolism; R,
general functional prediction only; S, uncharacterized. ((ee)) The mean similarity values between the 102 NUTs and each of the seven tree clusters in
the forest of life (colors as in (b)).
0
200
400
600
800
1000
2314567
Number of COGs
Clusters
B
A
A&B
-0.5
-0.4
-0.3
-0.2
-0.1
0
0.1
0.2
0.3
0.4
0.5
-0.5 0 0.5 1
1
2
3
4
5
6
7
NUTs
(6)
48.6 % **
(1)
42.43 % *
(4)
56.21 % **
(5)
50.17 % **
(7)
49.66 % **
(2)
63.34 % *
(3)
62.11 % **
* p = 0.0014
** p < 0.000001
(a) (b)
(c) (d) (e)
-0.15
-0.1
-0.05
0
0.05
0.1
0.15
-0.3 -0.2 -0.1 0 0.1 0.2 0.3 0.4
V2
V1
0%
20%
40%
60%
80%
100%
1234567
Percentage of trees
CMDS clusters
S
R
Q
P
O
N
M
L
K
J
I
H
G
F
E
D
C
B
A


%20--%3e%3cdefs%3e%3cstyle%3e%20.st0%20{%20fill:%20%23fff;%20}%20.st1%20{%20fill:%20%237800fa;%20}%20%3c/style%3e%3c/defs%3e%3cpath%20class='st1'%20d='M117.78,12.18H43.11c2.9,3.47,4.65,7.94,4.65,12.82,0,5.6-2.3,10.66-6.01,14.29h76.02l7.22-13.56-7.22-13.56Z'/%3e%3cg%3e%3cpath%20class='st0'%20d='M53.58,26.17h-.59v-1.46h.59v-4.96h2.83c1.78,0,2.67.94,2.67,2.82v5.76c0,1.87-.89,2.81-2.67,2.81h-2.83v-4.96ZM55.36,21.37v3.34h1.1v1.46h-1.1v3.34h1.01c.61,0,.91-.37.91-1.1v-5.93c0-.74-.3-1.1-.91-1.1h-1.01Z'/%3e%3cpath%20class='st0'%20d='M65.99,31.14h-1.8l-.31-2.07h-2.19l-.31,2.07h-1.64l1.82-11.39h2.62l1.82,11.39ZM65.28,18.04c-.25.46-.51.77-.75.94-.21.15-.47.22-.79.22-.26,0-.57-.07-.92-.22l-.38-.15c-.14-.05-.26-.07-.37-.07-.3,0-.53.18-.71.54l-.91-.68c.25-.46.51-.77.75-.94.21-.14.48-.21.79-.21.26,0,.57.07.92.21l.38.15c.14.05.26.07.37.07.3,0,.53-.18.71-.54l.91.68ZM61.91,27.52h1.73l-.87-5.76-.87,5.76Z'/%3e%3cpath%20class='st0'%20d='M74.53,26.89v1.52c0,1.91-.89,2.86-2.67,2.86s-2.67-.95-2.67-2.86v-5.93c0-1.91.89-2.86,2.67-2.86s2.67.95,2.67,2.86v1.11h-1.69v-1.22c0-.75-.31-1.12-.93-1.12s-.93.37-.93,1.12v6.15c0,.74.31,1.11.93,1.11s.93-.37.93-1.11v-1.63h1.69Z'/%3e%3cpath%20class='st0'%20d='M81.4,31.14h-1.8l-.31-2.07h-2.19l-.31,2.07h-1.64l1.82-11.39h2.62l1.82,11.39ZM75.9,19.2l1.52-1.91h1.71l1.51,1.91h-1.61l-.76-.95-.75.95h-1.61ZM77.32,27.52h1.73l-.87-5.76-.87,5.76ZM83.1,15.99l-1.76,1.91h-1.26l1.17-1.91h1.86Z'/%3e%3cpath%20class='st0'%20d='M84.86,19.75c1.78,0,2.67.94,2.67,2.82v1.48c0,1.87-.89,2.81-2.67,2.81h-.85v4.28h-1.79v-11.39h2.64ZM84.01,21.37v3.86h.85c.58,0,.87-.36.87-1.08v-1.71c0-.71-.29-1.07-.87-1.07h-.85Z'/%3e%3cpath%20class='st0'%20d='M93.51,19.75c1.78,0,2.67.94,2.67,2.82v1.48c0,1.87-.89,2.81-2.67,2.81h-.85v4.28h-1.79v-11.39h2.64ZM92.66,21.37v3.86h.85c.58,0,.87-.36.87-1.08v-1.71c0-.71-.29-1.07-.87-1.07h-.85Z'/%3e%3cpath%20class='st0'%20d='M98.8,31.14h-1.79v-11.39h1.79v4.88h2.03v-4.88h1.83v11.39h-1.83v-4.88h-2.03v4.88Z'/%3e%3cpath%20class='st0'%20d='M105.36,24.55h2.46v1.62h-2.46v3.34h3.09v1.63h-4.88v-11.39h4.88v1.63h-3.09v3.18ZM108.17,17.29l-1.76,1.91h-1.26l1.17-1.91h1.86Z'/%3e%3cpath%20class='st0'%20d='M112.2,19.75c1.78,0,2.67.94,2.67,2.82v1.48c0,1.87-.89,2.81-2.67,2.81h-.85v4.28h-1.79v-11.39h2.64ZM111.35,21.37v3.86h.85c.58,0,.87-.36.87-1.08v-1.71c0-.71-.29-1.07-.87-1.07h-.85Z'/%3e%3c/g%3e%3ccircle%20class='st1'%20cx='25'%20cy='25'%20r='20'/%3e%3cpath%20class='st0'%20d='M32.78,19.27c2.92,0,4.43,2.55,5.28,5.33l.71,2.17c.14.38-.33.75-.71.75h-5.61c.19-.33.24-.71.09-1.08l-.75-2.45c-.43-1.32-.99-2.64-1.79-3.77.75-.57,1.65-.94,2.78-.94h0ZM25,18.38c3.25,0,4.9,2.78,5.89,5.89l.76,2.45c.14.42-.33.8-.8.8h-11.69c-.42,0-.94-.38-.8-.8l.75-2.45c.99-3.11,2.64-5.89,5.89-5.89h0ZM25,11.35c1.74,0,3.11,1.37,3.11,3.11s-1.37,3.11-3.11,3.11-3.11-1.41-3.11-3.11,1.41-3.11,3.11-3.11h0ZM17.27,19.27c1.08,0,1.98.38,2.73.94-.8,1.13-1.37,2.45-1.74,3.77l-.8,2.45c-.14.38-.05.75.09,1.08h-5.56c-.42,0-.9-.38-.75-.75l.71-2.17c.9-2.78,2.41-5.33,5.33-5.33h0ZM17.27,12.91c1.51,0,2.78,1.27,2.78,2.83s-1.27,2.83-2.78,2.83-2.83-1.27-2.83-2.83,1.27-2.83,2.83-2.83h0ZM32.78,12.91c1.56,0,2.78,1.27,2.78,2.83s-1.23,2.83-2.78,2.83-2.83-1.27-2.83-2.83,1.27-2.83,2.83-2.83h0ZM27.07,28.56v.09c0,.57-.24,1.08-.61,1.46h0v.05c-.38.33-.9.57-1.46.57s-1.08-.24-1.46-.61h0c-.38-.38-.61-.9-.61-1.46v-.09h1.41v.09c0,.19.05.38.19.47v.05c.09.09.28.19.47.19s.38-.09.47-.19v-.05c.14-.09.24-.28.24-.47t-.05-.09h1.41ZM30.99,28.56v.09c0,1.65-.66,3.16-1.74,4.24-1.08,1.08-2.59,1.79-4.24,1.79s-3.16-.71-4.24-1.79l-.05-.05c-1.04-1.08-1.7-2.55-1.7-4.2v-.09h1.41v.09c0,1.27.47,2.4,1.27,3.25h.05c.85.85,1.98,1.37,3.25,1.37s2.4-.52,3.25-1.37c.85-.8,1.37-1.98,1.37-3.25v-.09h1.37ZM34.99,28.56v.09c0,2.78-1.13,5.28-2.92,7.07-1.79,1.79-4.29,2.92-7.07,2.92s-5.23-1.13-7.07-2.92c-1.79-1.79-2.92-4.29-2.92-7.07v-.09h1.41v.09c0,2.4.94,4.53,2.5,6.08,1.56,1.56,3.72,2.5,6.08,2.5s4.52-.94,6.08-2.5c1.56-1.56,2.5-3.68,2.5-6.08v-.09h1.41Z'/%3e%3c/svg%3e)