
BioMed Central
Page 1 of 7
(page number not for citation purposes)
Cough
Open Access
Methodology
Evaluation of an ambulatory system for the quantification of cough
frequency in patients with chronic obstructive pulmonary disease
Michael A Coyle*1, Desmond B Keenan2, Linda S Henderson3,
Michael L Watkins3, Brett K Haumann4, David W Mayleben5 and
Michael G Wilson6
Address: 1Physiology Program, Harvard School of Public Health, Boston, MA, USA, 2VivoMetrics, Inc., Ventura, CA, USA, 3GlaxoSmithKline,
Respiratory and Inflammation Centre of Excellence for Drug Discovery Research Triangle Park, NC, USA, 4GlaxoSmithKline, Respiratory and
Inflammation Centre of Excellence for Drug Discovery Stevenage, UK, 5Community Research, Inc., Cincinnati, OH, USA and 6Department of
Psychiatry, Indiana University School of Medicine, Indianapolis, IN, USA
Email: Michael A Coyle* - mcoyle@hsph.harvard.edu; Desmond B Keenan - barry2312002@yahoo.com;
Linda S Henderson - linda.s.henderson@gsk.com; Michael L Watkins - michael.l.watkins@gsk.com;
Brett K Haumann - brett.k.haumann@gsk.com; David W Mayleben - dmayleben@zoomtown.com;
Michael G Wilson - michael.g.wilson@insightbb.com
* Corresponding author
Abstract
Background: To date, methods used to assess cough have been primarily subjective, and only broadly reflect
the impact of chronic cough and/or chronic cough therapies on quality of life. Objective assessment of cough has
been attempted, but early techniques were neither ambulatory nor feasible for long-term data collection. We
evaluated a novel ambulatory cardio-respiratory monitoring system with an integrated unidirectional, contact
microphone, and report here the results from a study of patients with COPD who were videotaped in a quasi-
controlled environment for 24 continuous hours while wearing the ambulatory system.
Methods: Eight patients with a documented history of COPD with ten or more years of smoking (6 women; age
57.4 ± 11.8 yrs.; percent predicted FEV1 49.6 ± 13.7%) who complained of cough were evaluated in a clinical
research unit equipped with video and sound recording capabilities. All patients wore the LifeShirt® system (LS)
while undergoing simultaneous video (with sound) surveillance. Video data were visually inspected and annotated
to indicate all cough events. Raw physiologic data records were visually inspected by technicians who remained
blinded to the video data. Cough events from LS were analyzed quantitatively with a specialized software
algorithm to identify cough. The output of the software algorithm was compared to video records on a per event
basis in order to determine the validity of the LS system to detect cough in COPD patients.
Results: Video surveillance identified a total of 3,645 coughs, while LS identified 3,363 coughs during the same
period. The median cough rate per patient was 21.3 coughs·hr-1 (Range: 10.1 cghs·hr-1 – 59.9 cghs·hr-1). The
overall accuracy of the LS system was 99.0%. Overall sensitivity and specificity of LS, when compared to video
surveillance, were 0.781 and 0.996, respectively, while positive- and negative-predictive values were 0.846 and
0.994. There was very good agreement between the LS system and video (kappa = 0.807).
Conclusion: The LS system demonstrated a high level of accuracy and agreement when compared to video
surveillance for the measurement of cough in patients with COPD.
Published: 04 August 2005
Cough 2005, 1:3 doi:10.1186/1745-9974-1-3
Received: 25 April 2005
Accepted: 04 August 2005
This article is available from: http://www.coughjournal.com/content/1/1/3
© 2005 Coyle et al; licensee BioMed Central Ltd.
This is an Open Access article distributed under the terms of the Creative Commons Attribution License (http://creativecommons.org/licenses/by/2.0),
which permits unrestricted use, distribution, and reproduction in any medium, provided the original work is properly cited.

Cough 2005, 1:3 http://www.coughjournal.com/content/1/1/3
Page 2 of 7
(page number not for citation purposes)
Background
The most frequent complaint for which patients seek
treatment from primary care physicians in the United
States is cough [1]. Type, frequency and diurnal changes of
cough may be criteria for differential diagnosis, therapeu-
tic efficacy, and a gauge for the progression of chronic dis-
ease. Historically, cough evaluation has been difficult and
of limited clinical value due to a lack of surveillance tools
to assess cough frequency completely and its impact on
health-related quality of life (HRQL).
To date, methods used to assess cough have been prima-
rily subjective, and only broadly reflect the impact of
chronic cough and/or chronic cough therapies on quality
of life [2-5]. These methods have been unable to offer sub-
stantial information related to the minimal reduction in
cough frequency necessary to achieve a significant
improvement in HQRL. Objective assessment of cough
has been attempted, but these techniques were neither
ambulatory nor feasible for long-term data collection [6-
8]. Other systems have evaluated sound to quantify cough
frequency and intensity with moderate success [9,10], but
have been limited in their effectiveness outside the labo-
ratory and requires labor intensive analysis and interpre-
tation [11-15].
We evaluated a novel ambulatory cardio-respiratory mon-
itoring system with an integrated unidirectional, contact
microphone, and report here the results from a study of
patients with COPD who were videotaped in a quasi-con-
trolled environment for 24 continuous hours while wear-
ing the ambulatory system.
Methods
Subjects
Eight subjects with chronic obstructive pulmonary disease
(COPD) who complained of cough as a prominent symp-
tom (e.g., ten or greater self reported bouts of cough per
day) were recruited for the study. Subjects were men and
women over the age of 40 who had a documented medi-
cal history of COPD and a smoking history of ≥ 10 years
with chronic productive cough. Patient characteristics can
be found in Table 1. Patients were excluded from the
study if, upon screening, (1) it was determined from
patient medical history that cough could be due to other
known causes such as gastro-esophageal reflux, asthma, or
any anatomical abnormalities of the upper respiratory
tract, and/or (2) if patients were using prescribed or over
the counter anti-tussive medications within 24-hours of
the start of the study.
The protocol was approved by an independent ethical
review board (Western IRB, 3535 7th Avenue SW, Olym-
pia, WA, USA, 98502) and all patients received a verbal
and written description of the study and gave informed
consent prior to participation. All data were collected
under the medical supervision of board certified
pulmonologists.
Instrumentation and monitoring
LifeShirt® System
Patients were fitted with the wearable LifeShirt® system
(LS, VivoMetrics, Inc., Ventura, CA, USA), which incorpo-
rates respiratory inductance plethysmography (RIP) for
the non-invasive measurement of volume and timing ven-
tilatory variables and has been described elsewhere [15-
22]. The system also incorporates a unidirectional contact
microphone, a single channel ECG, and a centrally
located, 3-axis accelerometer. Data were processed and
stored on a compact flash card that was housed within the
recorder unit. Patients were invited to wear the LS system
for a maximum of 24 hours.
Video surveillance
Patients spent the testing period in an assigned room
where the video monitoring equipment was installed.
Patients were monitored via video recorder camera (low-
lux) with unidirectional free-air microphone for the dura-
tion of the testing period. The video data stream was syn-
chronized to the LS data stream by the coordination of the
device clocks. The LS recorder has an on-board electronic
diary which creates an event time stamp in the LS software
data stream which was referenced to the video data time
display to determine the beginning of the recording
period. Patients were allowed free range of the research
facility and were permitted to watch television, use the tel-
ephone, dine, take breaks and sleep.
Data analysis and statistics
Raw physiologic data records were uploaded to a central-
ized data center and were visually inspected for quality by
technicians. 94.1% of the data were interpretable and
available for comparison to video. Specialized software
(VivoLogic®, VivoMetrics, Inc., Ventura, CA, USA) was
used to view the LS data and a proprietary algorithm
housed within the software was used to identify cough
Table 1: Patient characteristics. Values are means ± SD; Ht =
height; Wt = weight; BMI = Body mass index; %FEV1 = %
predicted forced expiratory volume in one second; n = 8 (6
women)
Variable
Age (yrs) 57.4 ± 11.8
Ht (cm) 165.4 ± 7.2
Wt (kg) 76.1 ± 14.4
BMI (kg/m2) 27.8 ± 4.7
%FEV149.6 ± 13.7
Cough 2005, 1:3 http://www.coughjournal.com/content/1/1/3
Page 3 of 7
(page number not for citation purposes)
from the physiologic recordings. LS data were visually
inspected by two independent reviewers who remained
blinded to the video data. Each noted the time (hour,
minute and second) of each cough. These data were cap-
tured into a spreadsheet. Cough events (hour, minute,
second, millisecond) identified by the LS software were
exported into a separate spreadsheet. A practical extrac-
tion and report language (PERL) script was written to tem-
porally align the two data streams so that the output from
each device could be compared for agreement on an event
by event basis.
To summarize the validity and reliability of the ambula-
tory system to detect cough under several conditions, six
validation and agreement measures were used including,
sensitivity (SN), specificity (SP), positive predictive value
(PPV), negative predictive value (NPV), accuracy and
kappa [23] were calculated relative to video rating. The
PPV is the probability that a patient coughed, if the system
judged the respiratory event as a cough. Likewise, the NPV
is the probability that the patient did not cough, given
that the system did not judge the event as a cough. Accu-
racy is the proportion of all correct tests. The method used
to calculate the confidence intervals was the Wilson score
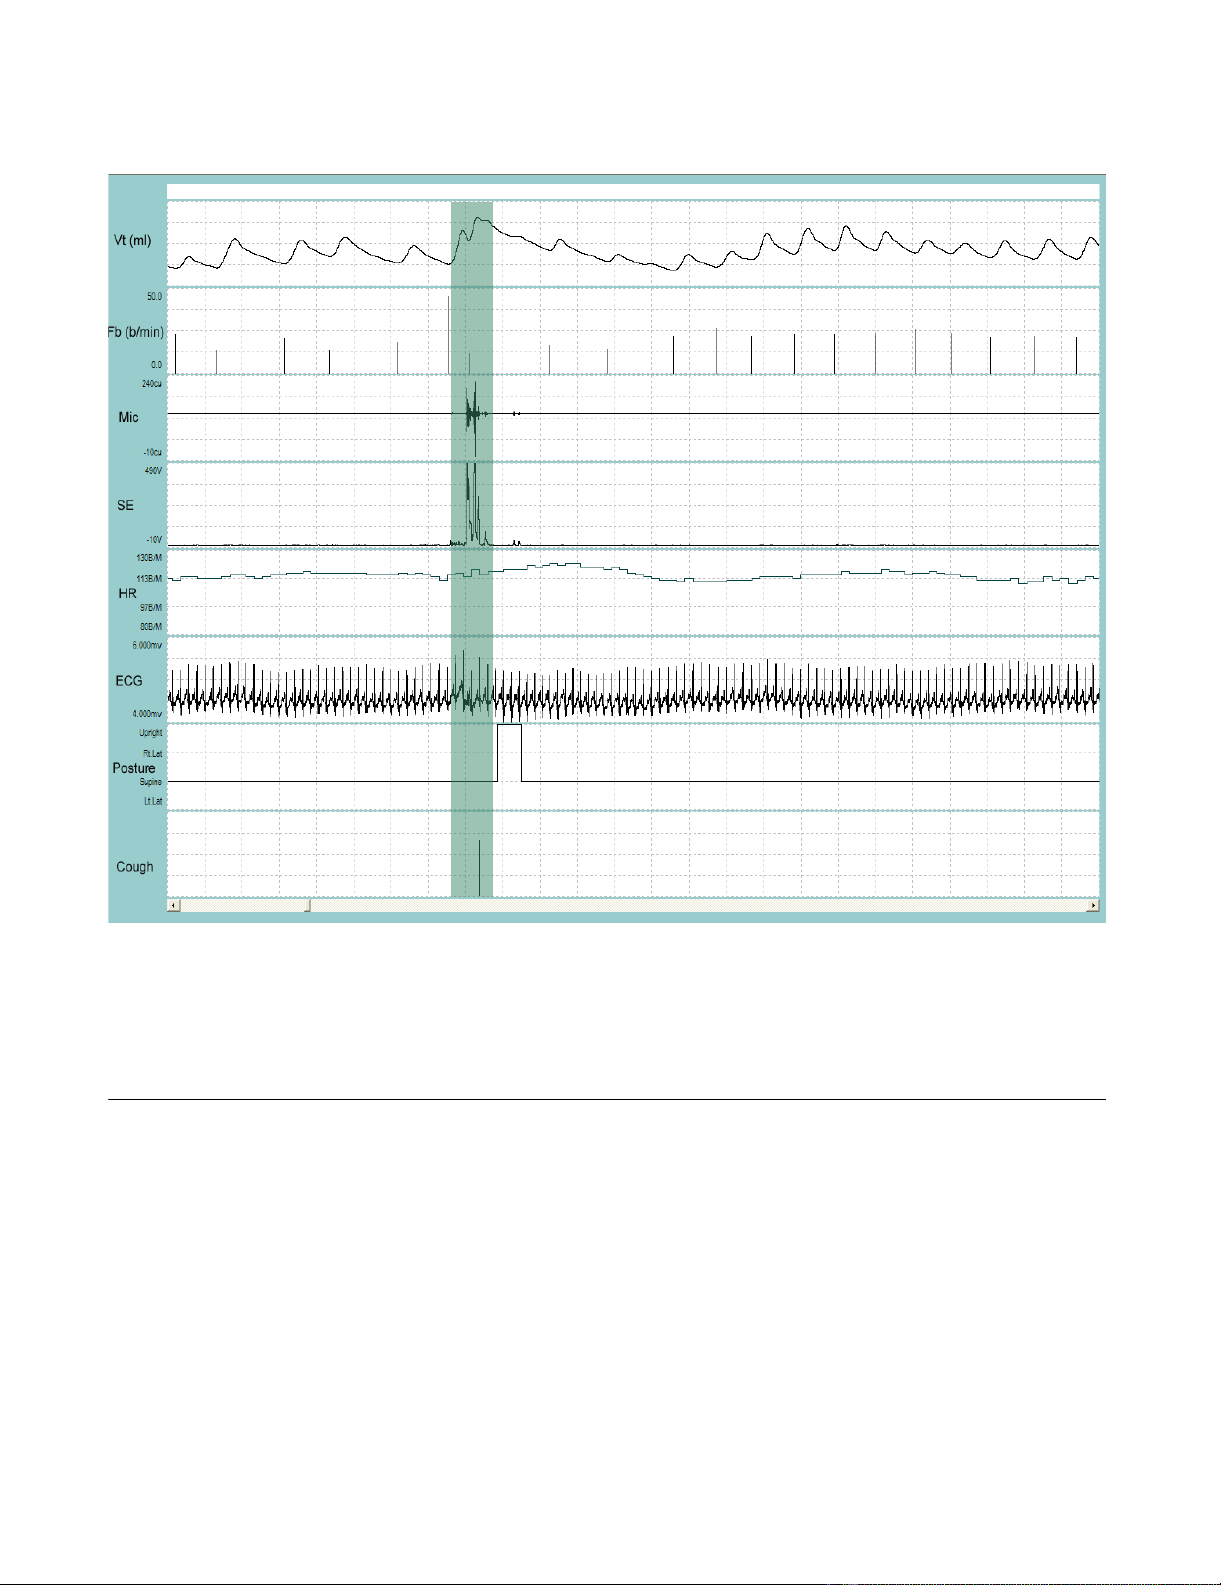
Representative recording of a single cough followed by a throat clear during quiet breathingFigure 1
Representative recording of a single cough followed by a throat clear during quiet breathing. VT = tidal volume; Fb
= breathing frequency; Mic = contact microphone output; SE = sound envelope; HR = heart rate; ECG = electrocardiograph
tracing; Posture = body position defined as upright, supine, right decubitis and left decubitis; Cough = cough output from algo-
rithm. The shaded bar contains the cough event. Cough is indicated by a single solid line at the end of the breath that contains
the cough. Note the change in the posture from supine to upright to supine immediately following the cough. Entire duration
of depicted recording is 1-min and 1-sec.
Cough 2005, 1:3 http://www.coughjournal.com/content/1/1/3
Page 4 of 7
(page number not for citation purposes)
method without continuity correction [24], which has
been previously shown to exhibit a logit scale symmetry
property with consequent log scale symmetry for certain
derived intervals [25].
Results
A satisfactory fit of the available standard sizes of the res-
piratory inductance plethysmography (RIP) garment was
achieved in all patients and the system was well tolerated
during the recording period. Figure 1 and Figure 2 depict
a representative recording of a single cough during quiet
breathing and during a series of coughs close together,
respectively. Figure 3 is a representative recording of
speech.
Patients were invited to be observed for a maximum of 24
hours. A total of 109 hours of simultaneous recordings of
video and LS were obtained. Of that time, 73.9 hours were
observed during the day and 34.7 hours were observed
during the night. During the recording period, the total
number of coughs documented by video surveillance was
3,645. The LS system reported 3,363 coughs during the
same time period. The median cough rate per patient was
21.3 coughs·hr-1 (Range: 10.1 cghs·hr-1 – 59.9 cghs·hr-1).
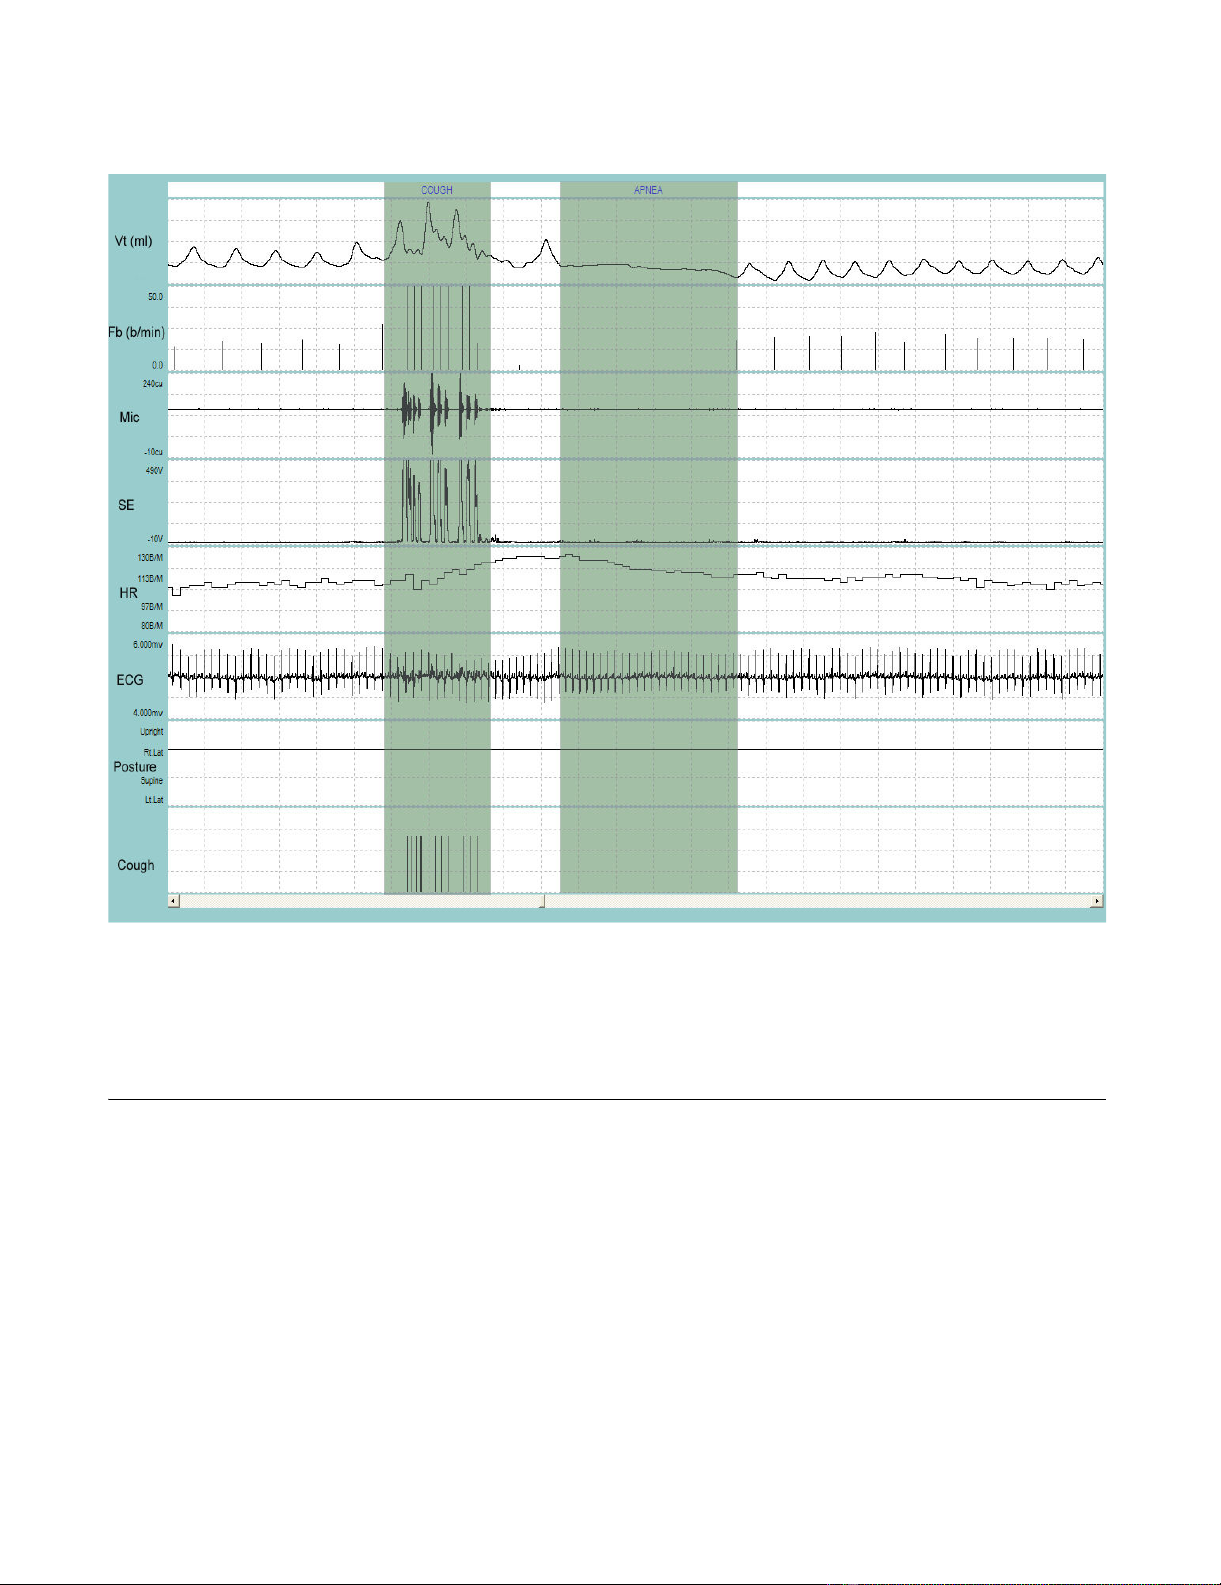
Representative recording of coughing during sleepFigure 2
Representative recording of coughing during sleep. VT = tidal volume; Fb = breathing frequency; Mic = contact micro-
phone output; SE = sound envelope; HR = heart rate; ECG = electrocardiograph tracing; Posture = body position defined as
upright, supine, right decubitis and left decubitis; Cough = cough output from LS algorithm. The first shaded bar contains the
cough bout. Ten coughs occurred during the 9-sec bout. Each cough is indicated by a single solid line at the end of the breath
that contains the cough. Note that the cough bout was followed by a 15-sec apnea (second shaded bar). Entire duration of
depicted recording is 1-min and 23-sec.
Cough 2005, 1:3 http://www.coughjournal.com/content/1/1/3
Page 5 of 7
(page number not for citation purposes)
Table 2 provides performance summaries for the LS sys-
tem to detect cough during for night vs. day and for low
and high respiration rates, respectively. Patients were
assigned to low vs. high respiratory rate depending on
whether the rate was below or above the median breath-
ing frequency (median Fb = 21 br·min-1). The system was
highly accurate in identifying cough as a respiratory event
during night or day. Accuracy during the night was 99.4%,
while accuracy during the day was 98.8% for a difference
= 0.53%. The specificities and negative predictive values
are considered 'excellent' by the criteria proposed by Byrt
(1996)[26]. Sensitivities, positive predictive values and
kappa can be considered 'very good' by the same criteria.
Likewise, the performance summaries for the system
between high or low respiration rates were remarkably
similar. Accuracy, specificities, and negative predictive val-
ues were 'excellent' and sensitivities, positive predictive
values and kappa were 'very good' [26].
Discussion
We report validity and reliability statistics for a novel
ambulatory system to evaluate its capability to detect
cough and demonstrate a high level of agreement and
accuracy when compared to video surveillance for cough
over an extended period. The system was well-tolerated
and allowed for free movement throughout the monitor-
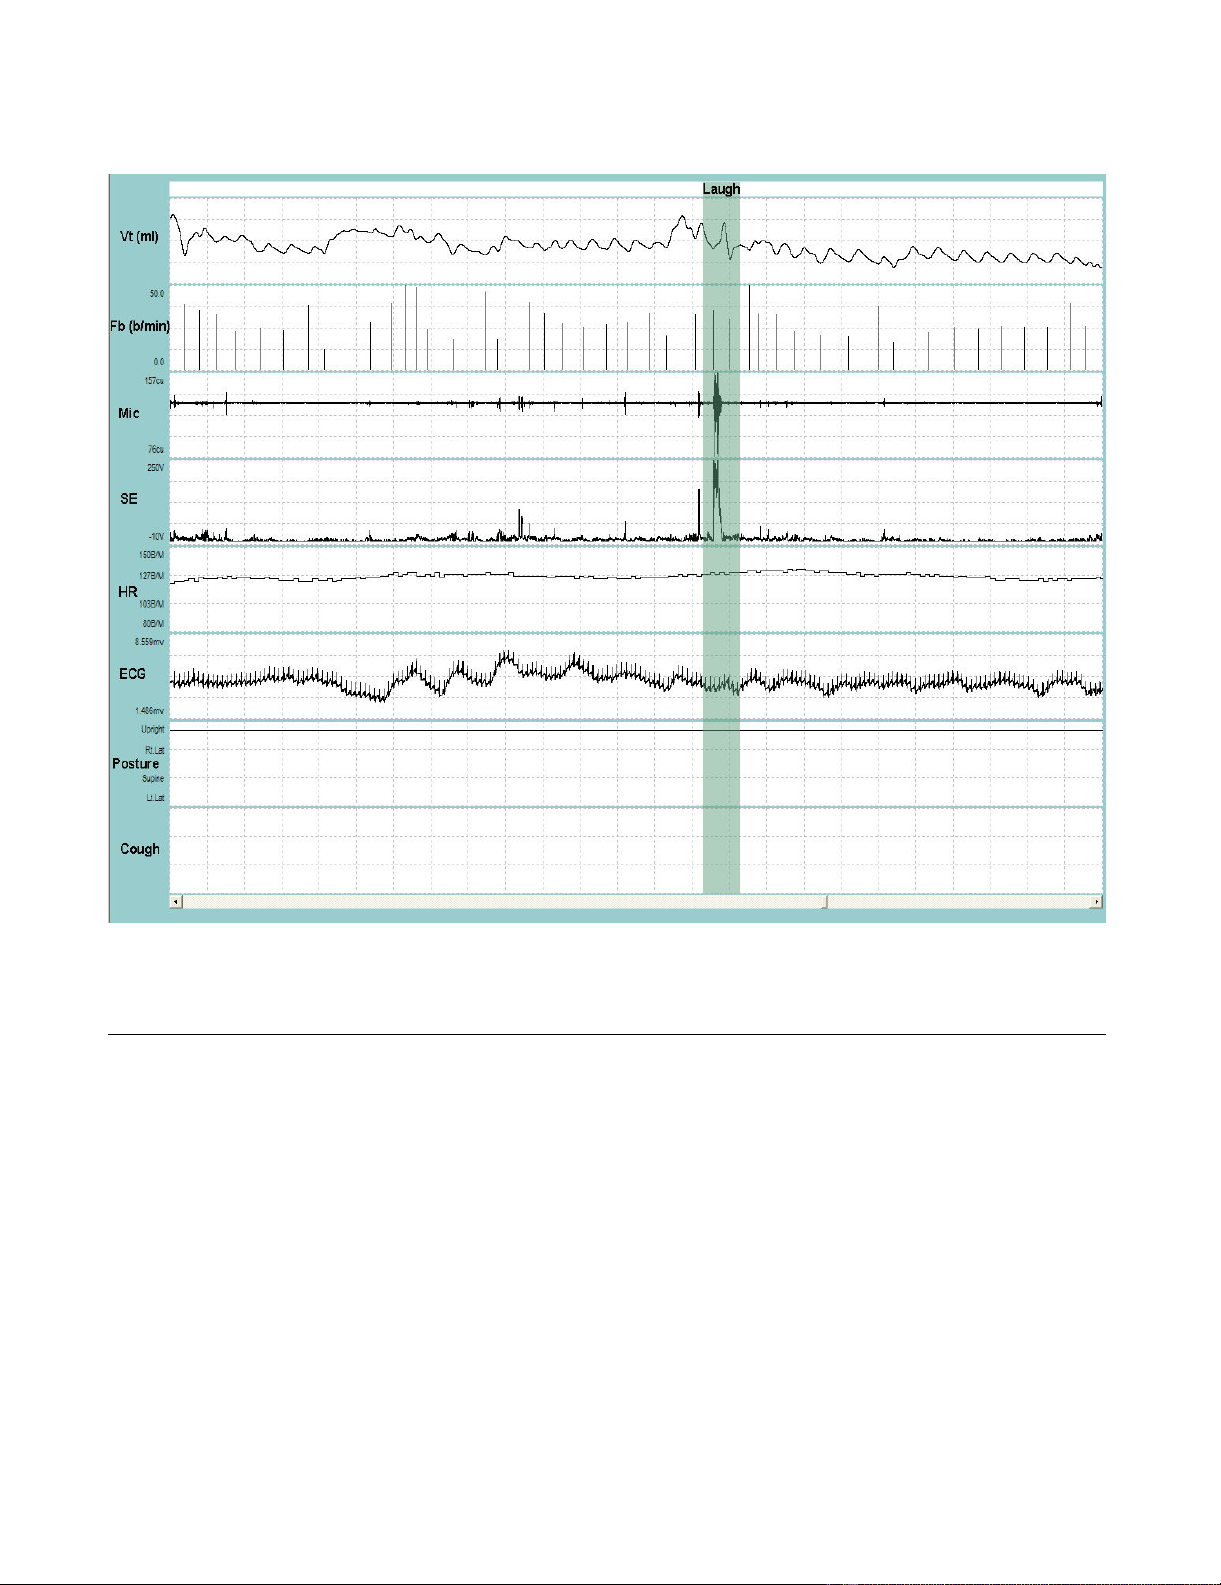
Representative recording of talking and laughingFigure 3
Representative recording of talking and laughing. VT = tidal volume; Fb = breathing frequency; Mic = contact micro-
phone output; SE = sound envelope; HR = heart rate; ECG = electrocardiograph tracing; Posture = upright. The shaded bar
contains a burst of laughing. Entire duration of depicted recording is 1-min and 37-sec.


![Báo cáo seminar chuyên ngành Công nghệ hóa học và thực phẩm [Mới nhất]](https://cdn.tailieu.vn/images/document/thumbnail/2025/20250711/hienkelvinzoi@gmail.com/135x160/47051752458701.jpg)


