
BioMed Central
Page 1 of 9
(page number not for citation purposes)
Journal of Immune Based Therapies
and Vaccines
Open Access
Original research
Immunostimulatory effects of three classes of CpG
oligodeoxynucleotides on PBMC from HCV chronic carriers
Curtis L Cooper1, Navneet K Ahluwalia2, Susan M Efler2, Jörg Vollmer3,
Arthur M Krieg4 and Heather L Davis*2
Address: 1Division of Infectious Diseases, University of Ottawa at The Ottawa Hospital and Ottawa Health Research Institute, Ottawa, Canada,
2Coley Pharmaceutical Canada, Ottawa, Canada, 3Coley Pharmaceutical GmbH, Langenfeld, Germany and 4Coley Pharmaceutical Group,
Wellesley MA, USA
Email: Curtis L Cooper - ccooper@ottawahospital.on.ca; Navneet K Ahluwalia - nahluwalia@coleypharma.com;
Susan M Efler - sefler@coleypharma.com; Jörg Vollmer - jvollmer@coleypharma.com; Arthur M Krieg - akrieg@coleypharma.com;
Heather L Davis* - hdavis@coleypharma.com
* Corresponding author
Abstract
Background: Chronic hepatitis C virus (HCV) infection results from weak or absent T cell
responses. Pegylated-interferon-alpha (IFN-α) and ribavirin, the standard of care for chronic HCV,
have numerous immune effects but are not potent T cell activators. A potent immune activator
such as TLR9 agonist CpG oligodeoxynucleotide (CpG) may complement current treatment
approaches.
Methods: Peripheral blood mononuclear cells (PBMC) obtained from HCV chronic carriers who
failed previous treatment and from healthy donors were incubated in vitro with the three main CpG
classes (A, B or C), recombinant IFN-α-2b (IntronA) and/or ribavirin. Proliferation and cytokine
secretion (IFN-α, IL-10 and IP-10) were evaluated.
Results: CpG induced proliferation and cytokine secretion in patterns expected for each CpG
class with similar group means for HCV and healthy donors. IntronA and ribavirin, alone or
together, had no detectable effects. IntronA and C-Class CpG together induced more IFN-α than
CpG alone in most subjects. IFN-α secretion was proportional to the number of plasmacytoid
dendritic cells in PBMC from healthy donors but not HCV donors in whom responses were highly
heterogeneous.
Conclusion: The strong immune stimulatory effect of CpG on PBMC isolated from treatment-
failed HCV patients suggests possible utility alone or in combination with current HCV antiviral
treatment.
Background
Hepatitis C virus (HCV)-induced liver disease is an impor-
tant health issue [1,2]. Acute infection usually is not spon-
taneously cleared in part due to immune escape by
emerging quasispecies [3] and virus-induced immune
dysfunction. HCV-specific Th1-type immune responses,
which are considered essential for longterm viral control
and eradication [4,5] are stronger and broader in those
Published: 9 June 2008
Journal of Immune Based Therapies and Vaccines 2008, 6:3 doi:10.1186/1476-8518-6-3
Received: 15 March 2008
Accepted: 9 June 2008
This article is available from: http://www.jibtherapies.com/content/6/1/3
© 2008 Cooper et al; licensee BioMed Central Ltd.
This is an Open Access article distributed under the terms of the Creative Commons Attribution License (http://creativecommons.org/licenses/by/2.0),
which permits unrestricted use, distribution, and reproduction in any medium, provided the original work is properly cited.

Journal of Immune Based Therapies and Vaccines 2008, 6:3 http://www.jibtherapies.com/content/6/1/3
Page 2 of 9
(page number not for citation purposes)
with self-resolving acute infection in comparison to those
who go on to develop chronic disease [6-9]. These
responses improve during therapy but remain much
weaker than with self-resolving infection [10-12]. This
suggests that the relatively poor response (< 50% for gen-
otype 1) achieved with pegylated-interferon-alpha (PEG-
IFN-α) and ribavirin[13] may be due to inadequate
immune stimulation. PEG-IFN-α and ribavirin both
appear to possess anti-viral and some immune modula-
tory activities [14,15]. Although the mechanism of ribavi-
rin activity remains unresolved this medication may
enhance virological and biochemical responses that are
associated with faster second phase viral decay with con-
sequent accelerated reduction in the pool of infected cells
[16-19]. Ribavirin activity may be mediated by reduced T
cell production of IL-10 [20-22]. IL-10 has been proposed
to promote the formation of regulatory T cells (Treg) in
chronic HCV that inhibit the generation of desirable Th1
type T cell responses [23]. However, neither PEG-IFN-α
nor ribavirin appear to be a potent immune stimulators
[24,25]. As such, HCV treatments may benefit from more
potent immune modulators used alone or in combination
with current treatment regimes.
Toll-like receptors (TLR) expressed by immune cells recog-
nize specific pathogen-associated patterns, and play a crit-
ical role in regulating innate and adaptive immunity
[26,27]. Synthetic oligodeoxynucleotides (ODN) contain-
ing immunostimulatory CpG motifs (CpG) directly acti-
vate human B cells and plasmacytoid dendritic cells
(pDC) through TLR9 [28]. Other immune cells are indi-
rectly activated. CpG has potential utility in HCV via mul-
tiple mechanisms of viral control. These include
activation of natural killer (NK) cells which clear virus
from infected hepatocytes during acute infection [29-31],
pDC maturation for improved antigen presentation, and
enhanced Th1 cytokine profiles (IL-12, IFN-γ and many
IFN-α subtypes) that have known antiviral properties and
promote Th1-biased lytic and non-lytic T cell responses
[32]. This former property is observed even in the pres-
ence of pre-existing Th2 responses [33].
CpG properties vary depending on length, sequence,
backbone and formation of secondary or tertiary struc-
tures. Three main classes of stimulatory CpG are described
[34]. A-Class CpG is synthesized with a chimeric back-
bone with nuclease resistant phosphorothioate 5' and 3'
ends and a native phosphodiester central CpG motif
region. These molecules form higher ordered structures
and are characterized by strong NK cell and pDC activa-
tion, high levels of IFN-α production, and limited B cell
activation [35-38]. B-Class CpG are phosphorothioate
throughout and do not form secondary structures. They
are characterized by strong B cell activation [39], moder-
ate NK activation [29], and pDC activation with moderate
IL-12 and limited IFN-α production. C-Class CpG are
phosphorothioate molecules with a 3' palindrome region
that permits stem-loops and duplexes. They have proper-
ties intermediate to A- and B-Classes with good B cells and
NK cells activation, and induce DC IFN-α secretion
[38,40,41]. The higher order structures of A- and C-
Classes appear to affect intracellular localization and facil-
itate cross-linking of TLR9 receptors, which may be asso-
ciated with IFN-α induction.
A B-Class CpG has entered clinical testing and has demon-
strated efficacy together with doublet chemotherapy in a
Phase II study in non-small cell lung cancer [manuscript
submitted] and as a hepatitis B vaccine adjuvant [42] in
healthy volunteers [43,44] and vaccine hyporesponsive
HIV-infected patients [45]. Based on this knowledge, we
evaluate the ability of different CpG classes to stimulate
immune cells from healthy or HCV-infected donors to
proliferate and secrete key cytokines.
Methods
Human PBMC
Peripheral blood mononuclear cells (PBMC) were recov-
ered from 27 adult volunteers (12 healthy, 15 HCV treat-
ment refractory) at The Ottawa Hospital, Ottawa, Canada
under informed consent and IRB approval. Subjects with
other chronic infections or who had received HCV therapy
within 3 months were excluded. Viral genotypes for the 15
HCV-infected subjects was: 1b (n = 6), 1a (n = 5), 3a (n =
3) and 4c (n = 1). PBMC were purified from whole blood
(200 ml, venous puncture, heparinized vacutainers) by
centrifugation over Ficoll-Pacque (Amersham Pharmacia
Biotech, Uppsala, Sweden) at 400 × g for 35 min. Cells
were resuspended in RPMI complete media containing
10% normal human AB serum (heat inactivated) and 1%
penicillin/streptomycin at 10 × 106/ml and used fresh to
assay cytokine secretion and proliferation.
Reagents
ODN sequences were: A-Class CpG (2336;
GGG*G*A*C*G*A*C*G*T*C*G*T*C*GGGGGG), B-
Class CpG (2006; TCGTCGTTTTGTCGTTTTGTCGTT), C-
Class CpG (2429; TCGTCGTTTTCGGCGGCCGCCG) and
non-CpG control (4010 ; TGCTGCTTTTTGCT-
GGCTTTTT). B- and C-Class CpG had entire nuclease
resistant phosphorothioate backbones. A-Class CpG had
chimeric backbone with central phosphodiester region
(indicated by *) and phosphorothioate ends. All ODN,
verified to be endotoxin-free (Coley Pharmaceutical
GmbH; Langenfeld, Germany), were resuspended in TE
buffer at pH 8.0 (OmniPur®; EM Science, Gibbstown,
USA) and diluted in RPMI 1640 complete media (Gibco-
BRL, Grand Island, USA) containing 10% heat inacti-
vated, normal human AB serum (Wisent, St. Bruno,
Journal of Immune Based Therapies and Vaccines 2008, 6:3 http://www.jibtherapies.com/content/6/1/3
Page 3 of 9
(page number not for citation purposes)
Canada) and 1% penicillin/streptomycin (GibcoBRL) just
prior to use in cell assays.
Phytohemagglutinin (Sigma-Aldrich, Oakville, Canada),
positive control in cell stimulation assays, was diluted in
media then added to cells for final concentration of 10 μg/
ml.
IntronA (Schering, Pointe-Claire, Canada) was added to
the culture media for final concentrations of 125 or 1000
IU/ml. Ribavirin (CN Biosciences, La Jolla, USA) was
reconstituted to 500 μM with sterile distilled water then
diluted in media and added to cells for final concentration
of 5 μM.
Immune assays
Cytokine Assays
Freshly isolated PBMC (1 × 10⁶ in 200 μl complete RPMI
media) were incubated at 37°C with 5% CO2 in 96-well
flat-bottom plates with ODN at 3 or 6 μg/ml (approxi-
mately 0.5 and 1 μM). Cell supernatants collected after 48
hrs were stored at -80°C until assayed. Media alone and
PHA were negative and positive controls respectively.
Commercial ELISA kits were used according to manufac-
turer instructions to measure IP-10, IL-10 (R&D Systems,
Minneapolis, USA) and multi-species human-IFN-α (PBL
Biomedical Laboratories, Piscataway, USA). The kit speci-
fied detection limits were used for ELISA values below
these limits (16, 23 and 31 pg/ml for IP-10, IL-10 and
IFN-α respectively).
Preliminary dose-response data for CpG on PBMC from 3
healthy donors cultured with C-Class (1, 3, 6, 9 and 12
μg/ml final concentration) and B-Class (1, 3, and 6 μg/
ml) CpG showed maximum responses 3 μg/ml for IFN-α
and at 6 μg/ml (B-Class) or 12 μg/ml (C-Class) for IP-10
and BCP levels. Due to blood volume limitations, CpG
was tested only at 3 and 6 μg/ml for B- and C-Classes
(approximately 0.5 and 1 μM respectively) and 6 μg/ml
for the A-Class.
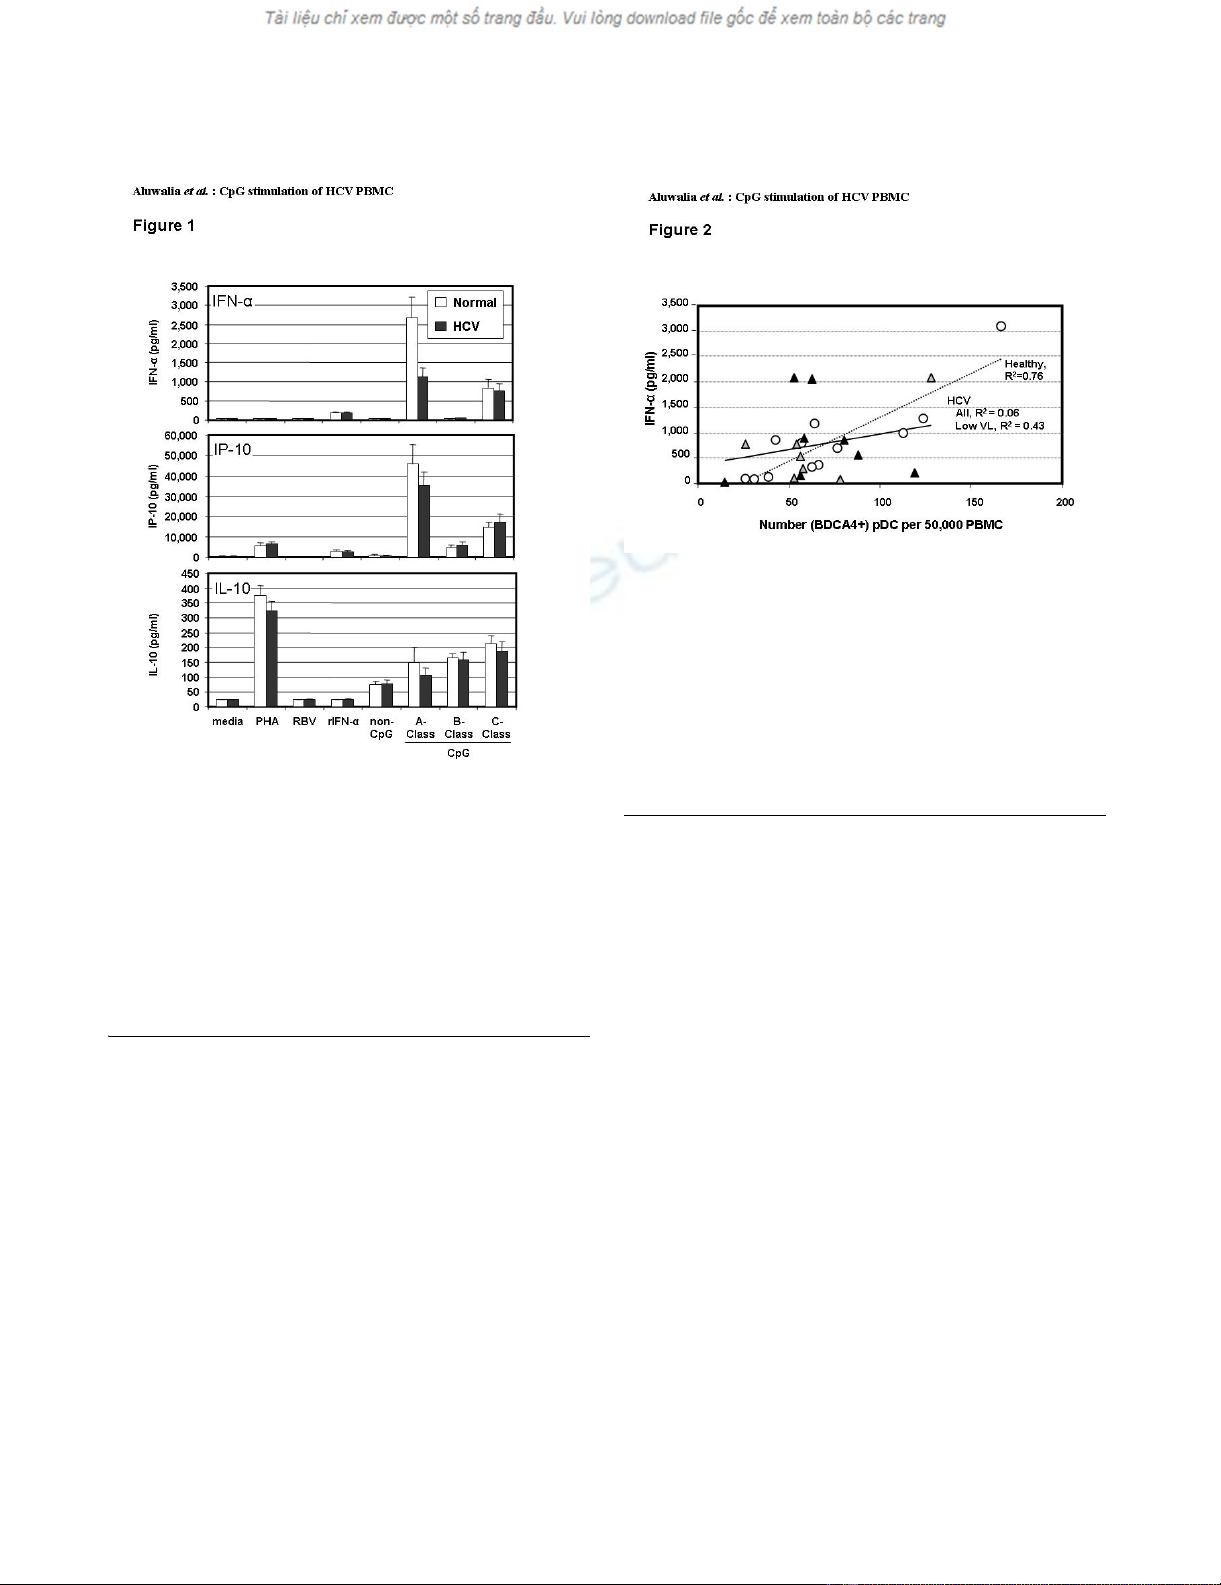
Flow cytometric analysis of pDC in freshly isolated PBMC from healthy (open circles, n = 12) and HCV-infected (grey or black triangles, n = 15) donors; HCV donors with low viral load at baseline (< 600,000 IU/ml) are indicated by grey trianglesFigure 2
Flow cytometric analysis of pDC in freshly isolated PBMC
from healthy (open circles, n = 12) and HCV-infected (grey
or black triangles, n = 15) donors; HCV donors with low
viral load at baseline (< 600,000 IU/ml) are indicated by grey
triangles. Numbers of pDC counted among 50,000 events by
flow cytometry of lineage negative, CD11c negative, HLA-
DR+, BDCA4+ cells are plotted against the amount of IFN-α
secreted by 1× 10⁶ cells cultured for 48 hrs in the presence
of the C-Class CpG at 6 μg/ml. Each point represents the
results for an individual subject (average of duplicate assays).
Levels of cytokines secreted by PBMC from healthy (n = 9 to 12) or HCV-infected (n = 13 to 15) donors after 48 hr cul-ture with media, recombinant IFN-alpha (rIFN-α, 125 IU/ml), ribavirin (RBV, 5 μM), non-CpG control ODN, A-Class, B-Class or C-Class CpG (all ODN at 6 μg/ml)Figure 1
Levels of cytokines secreted by PBMC from healthy (n = 9 to
12) or HCV-infected (n = 13 to 15) donors after 48 hr cul-
ture with media, recombinant IFN-alpha (rIFN-α, 125 IU/ml),
ribavirin (RBV, 5 μM), non-CpG control ODN, A-Class, B-
Class or C-Class CpG (all ODN at 6 μg/ml). White bars
(Healthy) and black bars (HCV), show mean values and
standard error of the means for each group of subjects. The
lowest limit of quantification for each of the parameters was
as follows: IFN-α, 31.2 pg/ml, IL-10, 23.4 pg/ml and IP-10, 7.8
pg/ml.
Journal of Immune Based Therapies and Vaccines 2008, 6:3 http://www.jibtherapies.com/content/6/1/3
Page 4 of 9
(page number not for citation purposes)
PBMC proliferation
ODN solutions (100 μl) were added to 96 well plates to
give final concentrations of 3 or 6 μg/ml. Isolated PBMC
were resuspended at 1 × 10⁶/ml in complete RPMI media
and 100 μl of cells were added to each well and cultured
for 5 days at 37°C with 5% CO2. Cells were pulsed with
3H-thymidine (1 μCi/well) for 18 h then harvested onto
filter paper; radioactivity was measured and reported as a
stimulation index (SI) relative to untreated media control.
Identification of pDC by flow cytometry
Three-colour immunofluorescent flow cytometric analysis
was used to quantify pDC. 3 × 10⁶ PBMC were resus-
pended in 300 μl of complete RPMI media and divided
among three tubes, one as negative control (autofluores-
cence), and two for pDC detection of lineage negative,
CD11c negative, HLA-DR positive, and either BDCA-4
positive or CD123 positive. Monoclonal antibodies were:
Mouse IgG1 Anti-Human BDCA-4-PE (Miltenyi Biotech,
Auburn, USA), Mouse IgG1 Anti-Human CD123-PE (BD
Biosciences-Pharmingen, San Diego, USA). Mouse Anti-
Human CD11c-PC5 (BeckmanCoulter, Fullerton, USA),
Mouse IgG1 Anti-Human HLA-DR-ECD (BeckmanCoul-
ter) and a FITC-conjugated mouse IgG1, IgG2b anti-
human lineage cocktail including CD3, CD14, CD16,
CD19, CD20, CD56 (BD Biosciences-Pharmingen). Stain-
ing was per manufacturer recommendations; analysis by
flow cytometry counted 50,000 events per sample (Beck-
man Coulter Epics XL-MCL, Expo32 software).
Epstein Barr Virus immortalized B-cell lines
Healthy PBMC from 5 donors were resuspended in 2.5 ml
of RPMI media (5 × 10⁶ cells) containing 10% fetal bovine
serum (GibcoBRL) and 1% penicillin/streptomycin.
Epstein-Barr virus (EBV)-containing supernatant (2.5 ml)
previously collected from a EBV transformed B cell line
(B95-8, ATCC, Manassas, USA) per manufacturer instruc-
tions was mixed with PBMC and incubated 2 hr at 37°C
with 5% CO2. Cyclosporin A (Sigma-Aldrich) at 1 μg/ml
in RPMI complete media was added to a final volume of
10 ml and cells were grown 4 wk in flasks at 37°C with 5%
CO2.
Statistical analysis
Data were expressed as group means ± standard errors of
the means (SEM) for absolute data. Student's t test was
used to compare two groups and one-factor analysis of
variance (ANOVA) followed by the Mann Whitney Test
for three groups or more.
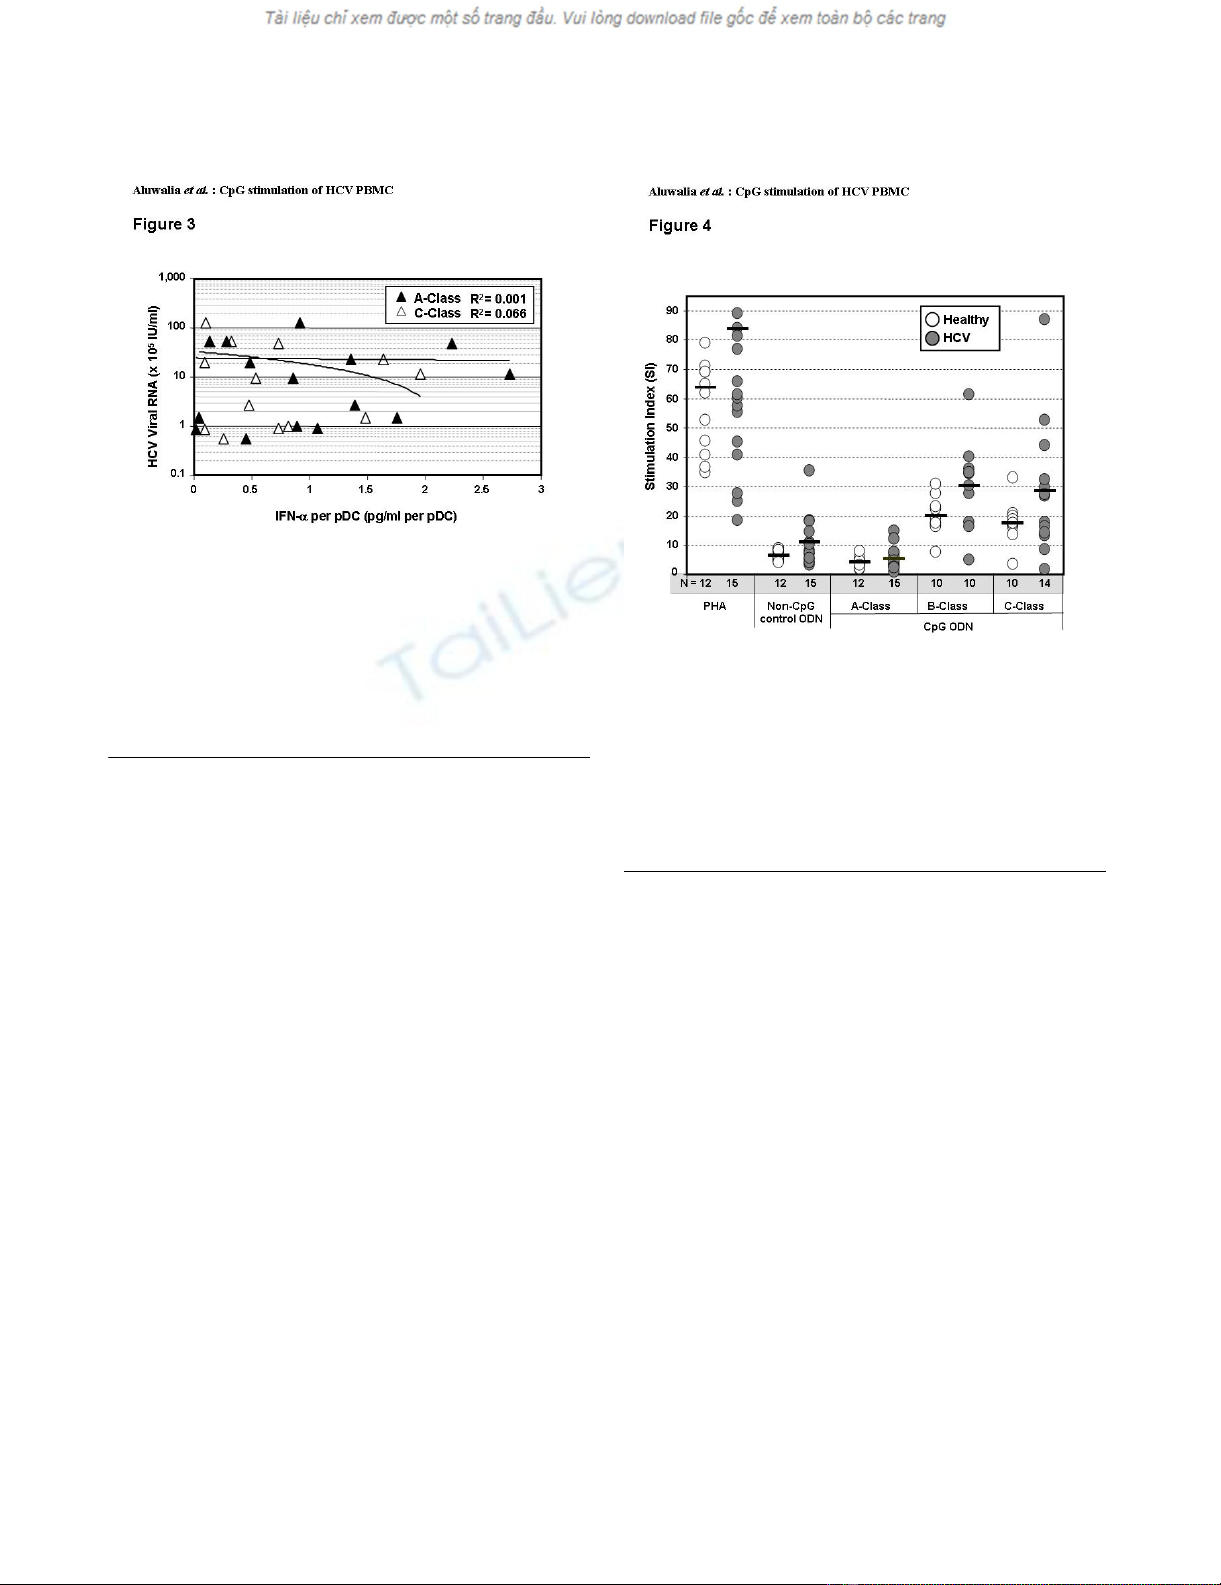
Proliferative responses in PBMC from healthy (open circles, n = 10 to 12) or HCV-infected (filled circles, n = 10 to 15) donors after incubation with A-, B- or C-Class CpG (6 μg/ml), positive control PHA (10 μg/ml) or non-CpG control ODN (6 μg/ml) for 5 days, then pulsing with 3H-thymidine for 16 to 18 hoursFigure 4
Proliferative responses in PBMC from healthy (open circles,
n = 10 to 12) or HCV-infected (filled circles, n = 10 to 15)
donors after incubation with A-, B- or C-Class CpG (6 μg/
ml), positive control PHA (10 μg/ml) or non-CpG control
ODN (6 μg/ml) for 5 days, then pulsing with 3H-thymidine
for 16 to 18 hours. Horizontal bars represent the group
means for stimulation indices (SI = cpm with PHA or ODN/
cpm with media alone).
Correlation of blood levels of HCV RNA and levels of IFN-α secreted per pDC from individual HCV-infected donors (n = 15)Figure 3
Correlation of blood levels of HCV RNA and levels of IFN-α
secreted per pDC from individual HCV-infected donors (n =
15). The amount of IFN-α secreted by 1 × 10⁶ cells cultured
for 48 hrs with A-Class (black symbols) or C-Class (white
symbols) CpG (6 μg/ml) was divided by the number of pDC
(lineage negative, CD11c negative, HLA-DR+ and BDCA4+),
counted among 50,000 events by flow cytometry and plotted
against HCV RNA levels for the same subjects.
Journal of Immune Based Therapies and Vaccines 2008, 6:3 http://www.jibtherapies.com/content/6/1/3
Page 5 of 9
(page number not for citation purposes)
Results
Cytokine secretion
Healthy donor PBMC secreted the highest levels of IFN-α
and IP-10 (Figure 1). Consistent with a previous report,
secretion was greatest with A-Class, less with C-Class, and
least with B-Class CpG [38]. HCV PBMC yielded results
similar to that of healthy PBMC for B- and C-Classes but
produced significantly less IFN-α (p = 0.02) and a trend to
less IP-10 with A-Class CpG. All CpG classes induced sim-
ilar IL-10 levels in healthy and HCV PBMC (Figure 1).
Two methods were used to quantify pDC in CD11c nega-
tive, HLA-DR positive cells: (i) BDCA-4 detection, which
is specific to pDC but may be down-regulated upon pDC
activation leading to concerns regarding undercounting,
and (ii) CD123 detection, which is also expressed on
basophils [46] [N.B. basophils are negative for HLA-DR].
Both methods yielded similar numbers of pDC from
healthy (73 ± 42 and 56 ± 27 respectively, mean ± SD of
50,000 events) and HCV-infected (66 ± 30 and 58 ± 23)
donors. Linear regression demonstrated a good correla-
tion between number of pDC (BDCA-4 analysis) and
amount of IFN-α secreted in response to C-Class CpG for
normal donors (R2 = 0.76). This was not identified in
HCV donors (R2 = 0.06) although a better correlation (R2
= 0.43) was observed for HCV subjects with low blood
levels of HCV RNA (< 600,000 IU/ml) (Figure 2). Simi-
larly, A- and B-Class CpG stimulated IFN-α secretion that
was well correlated with the number of pDC in normal
(R2 = 0.50 or 0.51 respectively) but not HCV (R2 = 0.04 or
0.09) PBMC (not shown). The amount of IFN-α produced
per pDC varied widely with HCV PBMC and did not cor-
relate with viral RNA blood levels (Figure 3).
PBMC proliferation
Under the culture conditions used, CpG-induced PBMC
proliferation is thought to be mostly B cell related [47]. As
previously reported [38], proliferation of PBMC from
healthy donors was weak with A-Class but strong with B-
and C-Class CpG. B- and C-Classes had similar effects at
high concentration (~1 μM) (Figure 4) but at low concen-
tration (~0.5 μM) the B-Class was more potent (p < 0.03,
not shown). The non-CpG control ODN caused some
proliferation, which is attributed to the weak TLR9-
dependent stimulation of cells by the phosphorothioate
backbone [48]. This was greater than that seen with the A-
Class chimeric backbone (p = 0.0023). There were no sig-
nificant differences in the proliferative responses between
PBMC from healthy and HCV-infected subjects with any
of the three classes of CpG (p > 0.05).
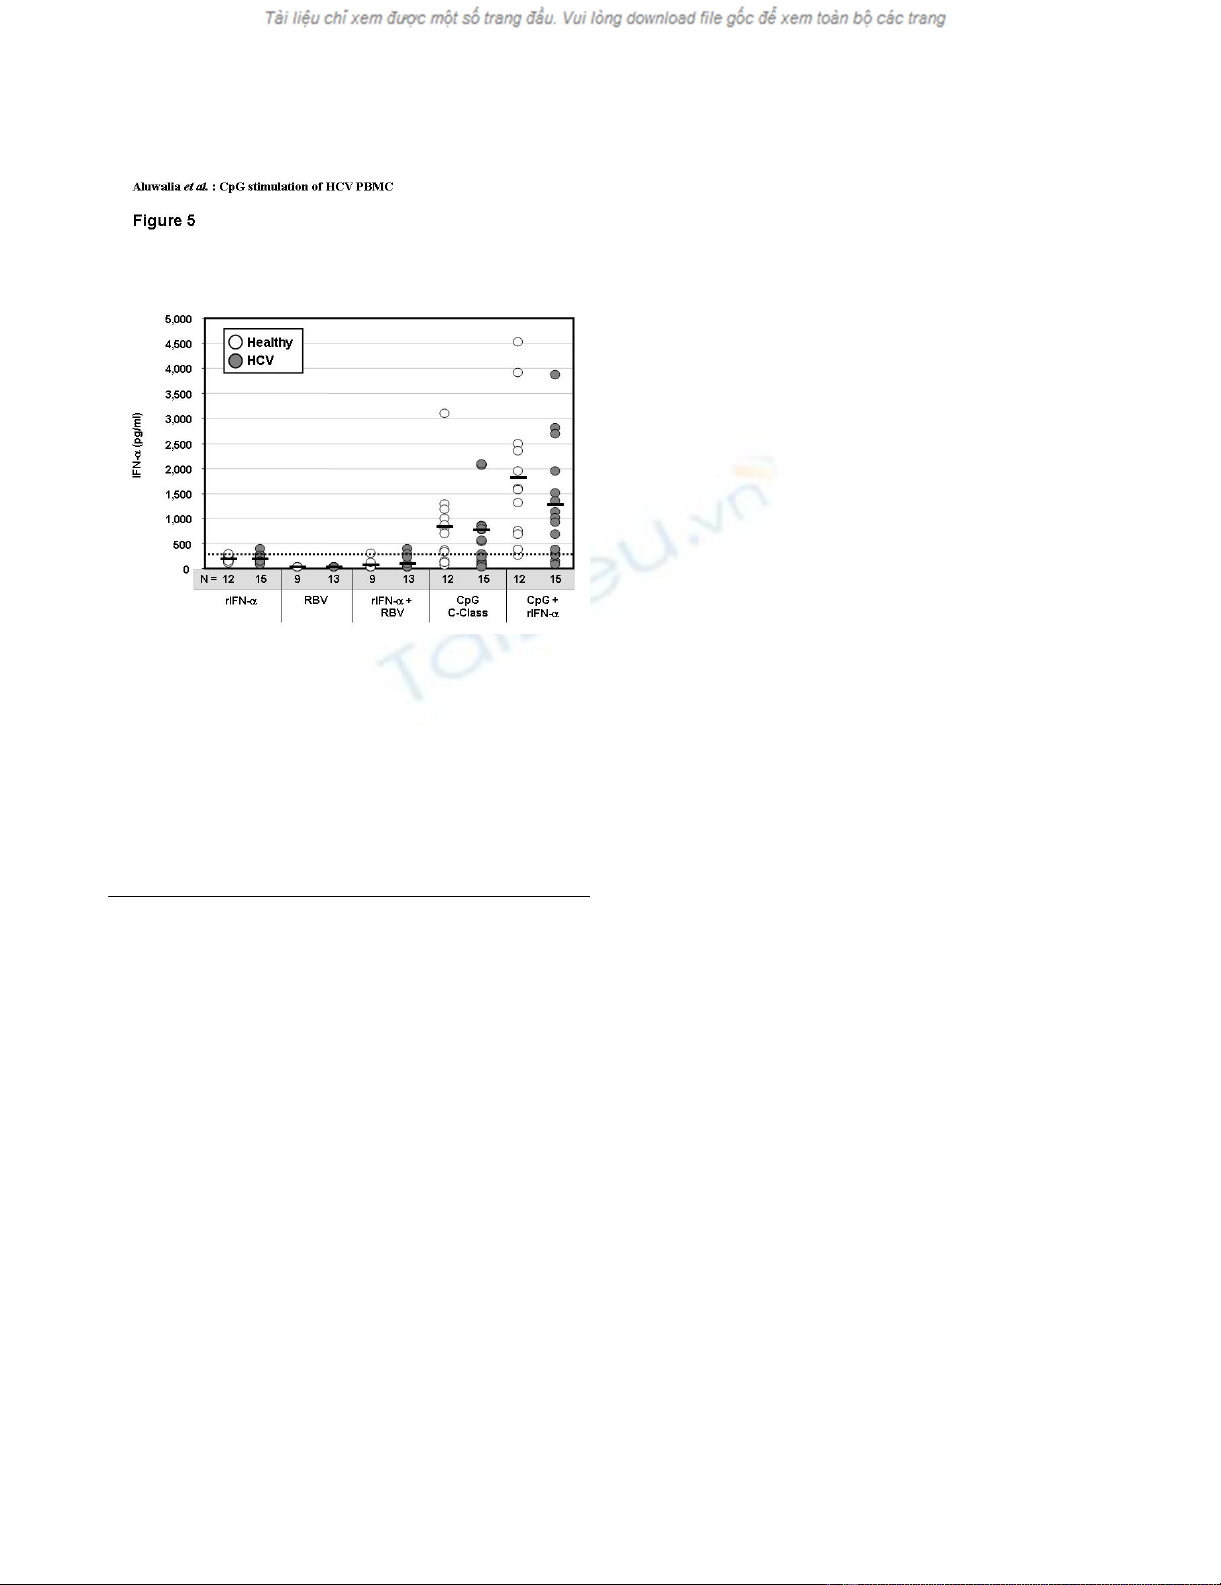
Effects of IntronA and ribavirin
As expected, IP-10 was induced by IntronA (Figure 1). The
amount was similar to that with B-Class but significantly
less than with A- or C-Class CpG (p < 0.002). IntronA did
not induce proliferative responses (data not shown) or IL-
10 secretion (Figure 1).
The IFN-α ELISA assay does not differentiate between
exogenous and endogenous forms. To determine whether
IntronA induced IFN-α secretion from pDC we used EBV-
immortalized B cell lines. These cells have IFN-α receptors
but do not produce IFN-α which allows for the amount of
IntronA remaining after 48 hr culture to be estimated. Sev-
enteen experiments adding IntronA (125 IU/ml) to five
different B-cell lines for 48 hr gave a mean level over
media background of 172 ± 81 pg/ml. This was deemed to
be a better estimate than measuring IFN-α after spiking
media with IntronA (319 ± 112 pg/ml, n = 13) since met-
abolic degradation by cultured cells was expected.
Amounts of IFN-α in supernatants of HCV or healthy
PBMC and B-cell lines cultured with IntronA were similar
(p < 0.05) indicating IntronA does not induce significant
IFN-α secretion (Figure 5).
Ribavirin alone or in combination with IntronA did not
induce significant IFN-α secretion (Figure 5). Ribavirin
Levels of IFN-α secreted by PBMC from healthy (n = 9 to 12) or HCV-infected (n = 13 to 15) donors after 48 hr culture with recombinant IFN-α (rIFN-α, 125 IU/ml), ribavirin (RBV, 5 μM), rIFN-α plus ribavirin, C-Class CpG (6 μg/ml) or CpG plus rIFN-αFigure 5
Levels of IFN-α secreted by PBMC from healthy (n = 9 to 12)
or HCV-infected (n = 13 to 15) donors after 48 hr culture
with recombinant IFN-α (rIFN-α, 125 IU/ml), ribavirin (RBV,
5 μM), rIFN-α plus ribavirin, C-Class CpG (6 μg/ml) or CpG
plus rIFN-α. Horizontal black bars show group mean values,
and numbers of subjects (n) in each group are indicated
below the X-axis. The background level of IFN-α deemed to
be contributed by the added rIFN-α alone, as measured in
control B-cell line experiments (334 pg/ml), is shown by the
hatched line.


![Vaccine và ứng dụng: Bài tiểu luận [chuẩn SEO]](https://cdn.tailieu.vn/images/document/thumbnail/2016/20160519/3008140018/135x160/652005293.jpg)


%20--%3e%3cdefs%3e%3cstyle%3e%20.st0%20{%20fill:%20%23fff;%20}%20.st1%20{%20fill:%20%237800fa;%20}%20%3c/style%3e%3c/defs%3e%3cpath%20class='st1'%20d='M117.78,12.18H43.11c2.9,3.47,4.65,7.94,4.65,12.82,0,5.6-2.3,10.66-6.01,14.29h76.02l7.22-13.56-7.22-13.56Z'/%3e%3cg%3e%3cpath%20class='st0'%20d='M53.58,26.17h-.59v-1.46h.59v-4.96h2.83c1.78,0,2.67.94,2.67,2.82v5.76c0,1.87-.89,2.81-2.67,2.81h-2.83v-4.96ZM55.36,21.37v3.34h1.1v1.46h-1.1v3.34h1.01c.61,0,.91-.37.91-1.1v-5.93c0-.74-.3-1.1-.91-1.1h-1.01Z'/%3e%3cpath%20class='st0'%20d='M65.99,31.14h-1.8l-.31-2.07h-2.19l-.31,2.07h-1.64l1.82-11.39h2.62l1.82,11.39ZM65.28,18.04c-.25.46-.51.77-.75.94-.21.15-.47.22-.79.22-.26,0-.57-.07-.92-.22l-.38-.15c-.14-.05-.26-.07-.37-.07-.3,0-.53.18-.71.54l-.91-.68c.25-.46.51-.77.75-.94.21-.14.48-.21.79-.21.26,0,.57.07.92.21l.38.15c.14.05.26.07.37.07.3,0,.53-.18.71-.54l.91.68ZM61.91,27.52h1.73l-.87-5.76-.87,5.76Z'/%3e%3cpath%20class='st0'%20d='M74.53,26.89v1.52c0,1.91-.89,2.86-2.67,2.86s-2.67-.95-2.67-2.86v-5.93c0-1.91.89-2.86,2.67-2.86s2.67.95,2.67,2.86v1.11h-1.69v-1.22c0-.75-.31-1.12-.93-1.12s-.93.37-.93,1.12v6.15c0,.74.31,1.11.93,1.11s.93-.37.93-1.11v-1.63h1.69Z'/%3e%3cpath%20class='st0'%20d='M81.4,31.14h-1.8l-.31-2.07h-2.19l-.31,2.07h-1.64l1.82-11.39h2.62l1.82,11.39ZM75.9,19.2l1.52-1.91h1.71l1.51,1.91h-1.61l-.76-.95-.75.95h-1.61ZM77.32,27.52h1.73l-.87-5.76-.87,5.76ZM83.1,15.99l-1.76,1.91h-1.26l1.17-1.91h1.86Z'/%3e%3cpath%20class='st0'%20d='M84.86,19.75c1.78,0,2.67.94,2.67,2.82v1.48c0,1.87-.89,2.81-2.67,2.81h-.85v4.28h-1.79v-11.39h2.64ZM84.01,21.37v3.86h.85c.58,0,.87-.36.87-1.08v-1.71c0-.71-.29-1.07-.87-1.07h-.85Z'/%3e%3cpath%20class='st0'%20d='M93.51,19.75c1.78,0,2.67.94,2.67,2.82v1.48c0,1.87-.89,2.81-2.67,2.81h-.85v4.28h-1.79v-11.39h2.64ZM92.66,21.37v3.86h.85c.58,0,.87-.36.87-1.08v-1.71c0-.71-.29-1.07-.87-1.07h-.85Z'/%3e%3cpath%20class='st0'%20d='M98.8,31.14h-1.79v-11.39h1.79v4.88h2.03v-4.88h1.83v11.39h-1.83v-4.88h-2.03v4.88Z'/%3e%3cpath%20class='st0'%20d='M105.36,24.55h2.46v1.62h-2.46v3.34h3.09v1.63h-4.88v-11.39h4.88v1.63h-3.09v3.18ZM108.17,17.29l-1.76,1.91h-1.26l1.17-1.91h1.86Z'/%3e%3cpath%20class='st0'%20d='M112.2,19.75c1.78,0,2.67.94,2.67,2.82v1.48c0,1.87-.89,2.81-2.67,2.81h-.85v4.28h-1.79v-11.39h2.64ZM111.35,21.37v3.86h.85c.58,0,.87-.36.87-1.08v-1.71c0-.71-.29-1.07-.87-1.07h-.85Z'/%3e%3c/g%3e%3ccircle%20class='st1'%20cx='25'%20cy='25'%20r='20'/%3e%3cpath%20class='st0'%20d='M32.78,19.27c2.92,0,4.43,2.55,5.28,5.33l.71,2.17c.14.38-.33.75-.71.75h-5.61c.19-.33.24-.71.09-1.08l-.75-2.45c-.43-1.32-.99-2.64-1.79-3.77.75-.57,1.65-.94,2.78-.94h0ZM25,18.38c3.25,0,4.9,2.78,5.89,5.89l.76,2.45c.14.42-.33.8-.8.8h-11.69c-.42,0-.94-.38-.8-.8l.75-2.45c.99-3.11,2.64-5.89,5.89-5.89h0ZM25,11.35c1.74,0,3.11,1.37,3.11,3.11s-1.37,3.11-3.11,3.11-3.11-1.41-3.11-3.11,1.41-3.11,3.11-3.11h0ZM17.27,19.27c1.08,0,1.98.38,2.73.94-.8,1.13-1.37,2.45-1.74,3.77l-.8,2.45c-.14.38-.05.75.09,1.08h-5.56c-.42,0-.9-.38-.75-.75l.71-2.17c.9-2.78,2.41-5.33,5.33-5.33h0ZM17.27,12.91c1.51,0,2.78,1.27,2.78,2.83s-1.27,2.83-2.78,2.83-2.83-1.27-2.83-2.83,1.27-2.83,2.83-2.83h0ZM32.78,12.91c1.56,0,2.78,1.27,2.78,2.83s-1.23,2.83-2.78,2.83-2.83-1.27-2.83-2.83,1.27-2.83,2.83-2.83h0ZM27.07,28.56v.09c0,.57-.24,1.08-.61,1.46h0v.05c-.38.33-.9.57-1.46.57s-1.08-.24-1.46-.61h0c-.38-.38-.61-.9-.61-1.46v-.09h1.41v.09c0,.19.05.38.19.47v.05c.09.09.28.19.47.19s.38-.09.47-.19v-.05c.14-.09.24-.28.24-.47t-.05-.09h1.41ZM30.99,28.56v.09c0,1.65-.66,3.16-1.74,4.24-1.08,1.08-2.59,1.79-4.24,1.79s-3.16-.71-4.24-1.79l-.05-.05c-1.04-1.08-1.7-2.55-1.7-4.2v-.09h1.41v.09c0,1.27.47,2.4,1.27,3.25h.05c.85.85,1.98,1.37,3.25,1.37s2.4-.52,3.25-1.37c.85-.8,1.37-1.98,1.37-3.25v-.09h1.37ZM34.99,28.56v.09c0,2.78-1.13,5.28-2.92,7.07-1.79,1.79-4.29,2.92-7.07,2.92s-5.23-1.13-7.07-2.92c-1.79-1.79-2.92-4.29-2.92-7.07v-.09h1.41v.09c0,2.4.94,4.53,2.5,6.08,1.56,1.56,3.72,2.5,6.08,2.5s4.52-.94,6.08-2.5c1.56-1.56,2.5-3.68,2.5-6.08v-.09h1.41Z'/%3e%3c/svg%3e)