
RESEARC H Open Access
TCMGIS-II based prediction of medicinal plant
distribution for conservation planning:
a case study of Rheum tanguticum
Hua Yu
1†
, Caixiang Xie
1†
, Jingyuan Song
1
, Yingqun Zhou
1,3
, Shilin Chen
1,2*
Abstract
Background: Many medicinal plants are increasingly endangered due to overexploitation and habitat destruction.
To provide reliable references for conservation planning and regional management, this study focuses on large-
scale distribution prediction of Rheum tanguticum Maxim. ex Balf (Dahuang).
Methods: Native habitats were determined by specimen examination. An improved version of GIS-based program
for the distribution prediction of traditional Chinese medicine (TCMGIS-II) was employed to integrate national
geographic, climate and soil type databases of China. Grid-based distance analysis of climate factors was based on
the Mikowski distance and the analysis of soil types was based on grade division. The database of resource survey
was employed to assess the reliability of prediction result.
Results: A total of 660 counties of 17 provinces in China, covering a land area of 3.63 × 10
6
km
2
, shared similar
ecological factors with those of native habitats appropriate for R. tanguticum growth.
Conclusion: TCMGIS-II modeling found the potential habitats of target medicinal plants for their conservation
planning. This technology is useful in conservation planning and regional management of medicinal plant
resources.
Background
More than one-tenth of plant species are used in drugs
and health products [1]. The demand for herbal drugs
and health products is steadily growing [2]. Thus, many
medicinal herbs are threatened by overexploitation,
habitat destruction and lack of proper cultivation prac-
tices. Some wild species are disappearing at alarming
rates [3,4]. Rheum tanguticum Maxim. ex Balf
(Dahuang) is one of those species. R. tanguticum
belongs to the family Polygonaceae and is a high-alti-
tude perennial herb sensitive to high temperature,
mainly found in the alpine regions of temperate and
subtropical Asia, especially in Southwest and Northwest
China (e.g. Sichuan, Gansu and Qinghai) [5,6]. As a
source for rhubarb according to the Chinese Pharmaco-
poeia and a purgative and anti-inflammatory agent [7],
R. tanguticum has been overexploited, suffering from
replant diseases, inadequate seed dispersal, low repro-
ductive efficiency and narrow distribution and habitat
fragmentation, leading to its declines in the wild
resources [6,8].
In-situ conservation, which considered as the method
of conserving endangered species in their wild habitats,
is promising in protecting indigenous species and main-
taining natural communities along with their intricate
network of relationships [9]. As habitat degradation and
destruction is increasing, ex-situ conservation regarded
as the process of cultivating and naturalizing endangered
species outside of their original habitats, has become a
practical alternative [10-12], especially for those over-
exploited and endangered medicinal plants with slow
growth, small abundance and replant diseases [10,13],
e.g. Paris species in family Trilliaceae and Panax species
in family Araliaceae [14]. Ex-situ cultivation becomes an
immediate action to sustain medicinal plant resources
[11,12].
* Correspondence: slchen@implad.ac.cn
†Contributed equally
1
Institute of Medicinal Plant Development, Chinese Academy of Medical
Sciences, Peking Union Medical College, Beijing 100193, China
Full list of author information is available at the end of the article
Yu et al.Chinese Medicine 2010, 5:31
http://www.cmjournal.org/content/5/1/31
© 2010 Yu et al; licensee BioMed Central Ltd. This is an Open Access article distributed under the terms of the Creative Commons
Attribution License (http://creativecommons.org/licenses/by/2.0), which permits unrestricted use, distribution, and reproduction in
any medium, provided the original work is properly cited.

Understanding the geographical distribution of plant
speciesisessentialfortheirex-situ conservation activ-
ities [1,15]. Although many plant species can be success-
fully introduced, cultivated and naturalized in a wide
range of habitats across countries and continents [16],
their growth and distribution in different habitats are
based on local indicators [17], e.g. soil properties, cli-
mate conditions and environmental features [18]. Agui-
lar-Stoen and Moe (2007) found that many medicinal
plants thriving in harsh habitats and disturbed areas are
of high medicinal efficacy because rocky and dry habi-
tats stimulate their secondary metabolites [19]. Many
plants are only found in places where the habitat is con-
gruent with their growth [18], e.g. the propagation and
quality of Banksia serrata varied among habitats [20].
Variations in growth and metabolites of medicinal plants
among niches make ex-situ conservation habitat-specific.
Geographical prediction of plant distribution is impor-
tant to resource conservation planning and regional
management decisions [21]. Geographic Information
System (GIS) is useful in predicting the spatial distribu-
tion of target species [22]. GIS assesses multiple interde-
pendent abiotic factors, e.g. solar radiation, air
temperature, precipitation and soil properties [23],
affecting plant distribution, models the environmental
niches of target plants [24] and refines their distribution
maps for conservation planning [25].
A GIS-based computer program (TCMGIS-I) was
developed specially for the distribution prediction of Chi-
nese medicine (CM) [25,26]. Integrating national geo-
graphic, climate and soil type databases of China,
TCMGIS-I was able to determine the impacts of environ-
mental gradients and predict the large-scale distribution
of target medicinal plants [26]. Tests with some common
medicinal plants (e.g. Panax ginseng,Panax quinquefo-
lium,Glycyrrhiza uralensis and Artemisia annua)
demonstrated that TCMGIS-I prediction was consistent
with the actual plants’distribution patterns [27-30].
While TCMGIS-I captures data from literature,
TCMGIS-II can perform more precise variable extrac-
tion from the native habitats of target medicinal plants.
Factors such as elevation, air temperature, solar radia-
tion, precipitation and soil properties are considered by
TCMGIS-II. Moreover, TCMGIS-II defines the native
habitats of a target plant through specimen examination
and extracts the target variables of native habitats from
its databases.
The present study aims to determine (1) the most
important ecological factor(s) on the distribution of
R. tanguticum, (2) whether the prediction results are
consistent with survey data and (3) the implications of
the prediction results for the conservation planning of
R. tanguticum.
Methods
Database descriptions
Based on a spatially referenced GIS model, TCMGIS-II
integrated four databases, including the national geo-
graphic, climate and soil type databases of China which
were used to generate distribution models and the data-
base of resource survey which was used to assess the
quality of a model.
The geographic database of China was a digital chart
(scale 1:1,000,000) at national, provincial, regional and
county levels, including a series of vector maps of layers,
i.e. manuals on roads, contours, geology and administra-
tive boundaries, with all points covered with a geographic
coordinate system (e.g. latitude, longitude and elevation).
The climate database of China was derived from the
national climate data coving from the period of 1971 to
2000 extracted from the climate records of the state
meteorological administration of China. The database
included climate attributes related to plant growth, e.g.
sunshine duration, relative humidity, annual precipitation,
accumulated temperature, mean annual temperature,
mean March temperature, annual maximum/minimum
temperature and annual mean maximum/minimum tem-
perature. The climate data were available in GIS along
with data of latitude, longitude and elevation.
The soil type database of China covered a total of
2,444 counties, containing a series of vector soil maps
(scale 1:1,000,000) and soil attributes and mapping unit
boundaries. The soil data were classified into 12 orders,
29 suborders, 61 groups, 235 subgroups and 909 families
as the basic elements of the map layers [31].
Thedatabaseofresourcesurveywasgeneratedwith
the third national resource survey of CM in China, cov-
ering a total of 11,118 plant species in 2312 genera of
385 families, including 298 fungi, 114 algae, 43 mosses,
55 lichens, 455 ferns, 126 gymnosperms and 10,027
angiosperms [32], as well as descriptions on the abun-
dance and distribution patterns of 138 rare and endan-
gered medicinal plants, 126 of which were converted
into digital charts (scale 1:1,000,000).
Model descriptions
TCMGIS-II identified, analyzed and displayed geogra-
phically referenced information, using two major data
models (i.e. raster and vector). Raster model in 1.0 ×
1.0 km
2
grids detected the grids sharing similar ecologi-
cal factors with those of the native habitats of a target
medicinal plant. Vector model stacked the layers of those
factors to determine the distribution areas and ranges.
Extraction of ecological factors from native habitats
Based on 75 type specimens of wild R. tanguticum
from Chinese Virtual Herbarium, we set up 206 plots
Yu et al.Chinese Medicine 2010, 5:31
http://www.cmjournal.org/content/5/1/31
Page 2 of 9

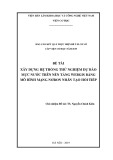
in 26 towns of nine counties in the provinces of
Gansu, Qinghai and Sichuan (Figure 1), the native
habitats of R. tanguticum. The ecological factors of the
plots were extracted by TCMGIS-II, including eleva-
tion, soil type, sunshine duration, relative humidity,
annual precipitation, accumulated temperature,
mean annual temperature, mean March temperature,
annual maximum/minimum temperature and
annual mean maximum/minimum temperature (Table
1). The variables extracted from the native habitats
weresetastargetvariablesfor distance analysis with
grids.
Figure 1 Native habitats of Rheum tanguticum Maxim. ex Balf Blue plotsin 26 towns were set up for the extraction of target variables.
Table 1 Variables extracted from the native habitats of Rheum tanguticum Maxim. ex Balf based on TCMGIS-II
combined geographic, climate and soil type databases
Variable Unit Range Mean ± SE F-value C
v
(%)
Elevation m 1980, 4550 3630 ± 44 191.2*** 17.4
Relative humidity % 54.8, 69.0 63.7 ± 2.2 219.3*** 49.6
Sunshine duration hr/yr 1897, 2704 2450 ± 13 301.7*** 7.6
Annual precipitation mm 331, 839 574 ± 7 233.2*** 17.5
Accumulated temperature °C 3193, 22451 9517 ± 951 277.1*** 143.4
Mean annual temperature °C 5.1, 13.1 8.6 ± 0.1 92.6*** 16.7
Mean March temperature °C -8.0, -2.0 -4.5 ± 0.2 42.3*** 63.8
Minimum temperature °C -24.8, -10.6 -19.1 ± 0.2 165.8*** 15.0
Maximum temperature °C 12.9, 24.4 17.2 ± 0.2 119.5*** 16.7
Mean minimum temperature °C -15.6, -5.1 -11.2 ± 0.2 129.8*** 25.6
Mean maximum temperature °C 6.0, 18.2 10.4 ± 0.2 103.3*** 27.6
Soil type* pH 5.9, 8.5 6.8 ± 0.1 112.4*** 21.1
* Soil type was assigned according to soil grade division in TCMGIS-II program.
Values of pH were employed as an indicator of soil types for statistical analysis.
F-value indicates the difference in target variable extracted from different native habitats (*** P< 0.001, ** P<0.01,and*P< 0.05).
SE: standard error of means
C
v
: coefficient of variation
Yu et al.Chinese Medicine 2010, 5:31
http://www.cmjournal.org/content/5/1/31
Page 3 of 9

Data normalization and distance analysis
As there were variations in factors (e.g. climate factors
and soil type), TCMGIS-II normalized data by joining
the mean absolute deviation of each pair of factors. To
determine the similarity rate between grids and target
variables from native habitats, we conducted distance
measurement based on grid-based analysis. Distance
analysis of soil was conducted according to grade divi-
sion, while the distance analysis of elevation and climate
factors was conducted based on Mikowski distance [33],
in TCMGIS-II as follows:
dq x y
ij ij ij
q
i
nq
()
/
=−
⎛
⎝
⎜
⎜
⎞
⎠
⎟
⎟
=
∑
1
1
Where x
ij
is the grid value and y
ij
is a target variable.
When q= 1, it is Manhattan distance.
When q= 2, it is Euclidean distance.
Long distance indicates low similarity rates while short
distance indicates high similarity rates.
Spatial distribution division and model quality
assessment
Division on spatial distribution of R. tanguticum was
established according to the grid-based clustering. The
areas sharing similar ecological factors with those of
native habitats were favorable for R. tanguticum distri-
bution. The spatially predicted areas were divided into
three types, namely the favorable (with similarity rate
≥95%), suitable (with similarity rate 90-95%), and slightly
appropriate (with similarity rate < 90%) for R. tanguti-
cum distribution.
To assess the reliability of the spatial prediction on
R. tanguticum distribution, we employed the database of
resource survey as a measure. The overlapping part
between distribution range predicted by TCMGIS-II and
that recorded by resource survey indicates the con-
gruency, the part with prediction result without survey
data suggests the potential distribution of R. tanguticum,
and the rest part with survey data beyond prediction
result indicates the contradiction between prediction
result and survey data.
Statistical analyses
To detect the variations in the abiotic factors (e.g. eleva-
tion, air temperature, solar radiation, precipitation and
soil properties in Table 1) of different native habitats,
we employed the coefficient of variation (C
v
) as a mea-
sure [34]. It is defined as the follows:
Cv=×
100%
Where sis the standard deviation and μis the mean.
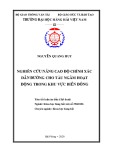
We employed one-way analysis of variance (one-way
ANOVA) to analyze the differences in the abiotic factors
responding to different native habitats (Table 1), and
principal components analysis (PCA) to evaluate the
contributions of the abiotic factors to R. tanguticum dis-
tribution (Figure 2).
Figure 2 Plot of component scores determined by principal component analysis on target variables from the native habitats of
Rheum tanguticum Maxim. ex Balf PC indicates a principal component.
Yu et al.Chinese Medicine 2010, 5:31
http://www.cmjournal.org/content/5/1/31
Page 4 of 9

Results
Target variables extracted from native habitats
TCMGIS-II extracted the target variables from 206 plots
in the native habitats of R. tanguticum (Figure 1, Table
1). The results showed that the target variables varied
significantly among different native habitats (Table 1, P
< 0.001), with coefficient of variation ranging from 7.6%
in sunshine duration to 143.4% in accumulated
temperature, and the native habitats exhibited high ele-
vation and abundant sunshine with moderate cool and
dry climate in mild acid and basic soils (Table 1). Using
PCA, we extracted two principal components (PCs)
which accounted for 93.8% of the contribution of target
variables in terms of R. tanguticum distribution (Figure
2). The PC
1
(PC
1
= 60.3%) was mainly related to tem-
peratures (e.g. annual maximum, annual mean
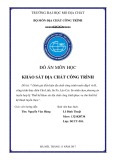
Figure 3 Spatial distribution of Rheum tanguticum Maxim. ex Balf predicted by TCMGIS-II. (a) Favorable area with similarity rate ≥95% and
(b) suitable area with similarity rate 90-95%. Longitude (°E) and latitude (°N) are given.
Yu et al.Chinese Medicine 2010, 5:31
http://www.cmjournal.org/content/5/1/31
Page 5 of 9


![Thuyết minh tính toán kết cấu đồ án Bê tông cốt thép 1: [Mô tả/Hướng dẫn/Chi tiết]](https://cdn.tailieu.vn/images/document/thumbnail/2016/20160531/quoccuong1992/135x160/1628195322.jpg)


![Bộ Thí Nghiệm Vi Điều Khiển: Nghiên Cứu và Ứng Dụng [A-Z]](https://cdn.tailieu.vn/images/document/thumbnail/2025/20250429/kexauxi8/135x160/10301767836127.jpg)
![Nghiên Cứu TikTok: Tác Động và Hành Vi Giới Trẻ [Mới Nhất]](https://cdn.tailieu.vn/images/document/thumbnail/2025/20250429/kexauxi8/135x160/24371767836128.jpg)


