
BioMed Central
Page 1 of 12
(page number not for citation purposes)
Journal of Translational Medicine
Open Access
Research
Identification of a biomarker panel using a multiplex proximity
ligation assay improves accuracy of pancreatic cancer diagnosis
Stephanie T Chang†1, Jacob M Zahn†2,3, Joe Horecka2,3, Pamela L Kunz5,
JamesMFord
4,5, George A Fisher5, Quynh T Le1, Daniel T Chang1,
Hanlee Ji2,5 and Albert C Koong*1
Address: 1Department of Radiation Oncology, Stanford University School of Medicine, Stanford University, Stanford, CA, USA, 2Stanford Genome
Technology Center, Stanford University School of Medicine, Stanford University, Stanford, CA, USA, 3Department of Biochemistry, Stanford
University School of Medicine, Stanford University, Stanford, CA, USA, 4Department of Genetics, Stanford University School of Medicine, Stanford
University, Stanford, CA, USA and 5Department of Medicine, Division of Medical Oncology, Stanford University School of Medicine, Stanford
University, Stanford, CA, USA
Email: Stephanie T Chang - stephanietchang@gmail.com; Jacob M Zahn - jzahn@stanford.edu; Joe Horecka - jhorecka@stanford.edu;
Pamela L Kunz - pkunz@stanford.edu; James M Ford - jmf@stanford.edu; George A Fisher - georgeaf@stanford.edu;
Quynh T Le - qle@stanford.edu; Daniel T Chang - dtchang@stanford.edu; Hanlee Ji - genomics_ji@stanford.edu;
Albert C Koong* - akoong@stanford.edu
* Corresponding author †Equal contributors
Abstract
Background: Pancreatic cancer continues to prove difficult to clinically diagnose. Multiple
simultaneous measurements of plasma biomarkers can increase sensitivity and selectivity of
diagnosis. Proximity ligation assay (PLA) is a highly sensitive technique for multiplex detection of
biomarkers in plasma with little or no interfering background signal.
Methods: We examined the plasma levels of 21 biomarkers in a clinically defined cohort of 52
locally advanced (Stage II/III) pancreatic ductal adenocarcinoma cases and 43 age-matched controls
using a multiplex proximity ligation assay. The optimal biomarker panel for diagnosis was computed
using a combination of the PAM algorithm and logistic regression modeling. Biomarkers that were
significantly prognostic for survival in combination were determined using univariate and
multivariate Cox survival models.
Results: Three markers, CA19-9, OPN and CHI3L1, measured in multiplex were found to have
superior sensitivity for pancreatic cancer vs. CA19-9 alone (93% vs. 80%). In addition, we identified
two markers, CEA and CA125, that when measured simultaneously have prognostic significance
for survival for this clinical stage of pancreatic cancer (p < 0.003).
Conclusions: A multiplex panel assaying CA19-9, OPN and CHI3L1 in plasma improves accuracy
of pancreatic cancer diagnosis. A panel assaying CEA and CA125 in plasma can predict survival for
this clinical cohort of pancreatic cancer patients.
Published: 11 December 2009
Journal of Translational Medicine 2009, 7:105 doi:10.1186/1479-5876-7-105
Received: 5 September 2009
Accepted: 11 December 2009
This article is available from: http://www.translational-medicine.com/content/7/1/105
© 2009 Chang et al; licensee BioMed Central Ltd.
This is an Open Access article distributed under the terms of the Creative Commons Attribution License (http://creativecommons.org/licenses/by/2.0),
which permits unrestricted use, distribution, and reproduction in any medium, provided the original work is properly cited.

Journal of Translational Medicine 2009, 7:105 http://www.translational-medicine.com/content/7/1/105
Page 2 of 12
(page number not for citation purposes)
Background
In 2008, the incidence of pancreatic cancer in the United
States was estimated to be more than 38,000, resulting in
more than 34,000 deaths per year [1]. Despite being a rel-
atively rare disease, pancreatic cancer is nevertheless the
fourth leading cause of cancer death in the United States
[2].
Despite the widespread use of aggressive combined
modality therapies, the overall 5-year survival for this dis-
ease remains less than 5%. Contributing to this high mor-
tality rate is the often late onset of clinical symptoms. The
majority of pancreatic cancer is diagnosed when metas-
tases have already occurred (microscopic and gross dis-
ease). Since surgical resection is the only therapy
associated with long-term survival, there is an urgent need
to diagnose patients at an earlier stage of disease when
removal of the primary tumor still has curative potential.
Issues complicating early diagnosis of pancreatic cancer
include the physical location of the pancreas, localized
deep within the abdominal cavity, and oftentimes non-
specific clinical symptoms such as general abdominal
pain, weight loss, and jaundice. Chronic pancreatitis, a
common disease encompassing inflammation of the pan-
creas, can present with identical symptoms. A blood-
based diagnostic test has the potential for circumventing
these confounding issues, thus enabling earlier detection
and increasing the probability of curative surgical treat-
ment.
Currently, carbohydrate antigen 19-9 (CA19-9) is the only
plasma marker routinely measured to make clinical deci-
sions pertaining to pancreatic cancer [3]. CA19-9 is most
often used to monitor recurrence in resected pancreatic
cancer patients as well as to gauge efficacy of chemother-
apy and radiotherapy in advanced cases. However, CA19-
9 is neither adequately sensitive nor specific enough to
make accurate diagnoses of pancreatic cancer based on the
results of a serological screening test [4]. CA19-9 is the sia-
lylated Lewis blood group antigen, and as such is not syn-
thesized in approximately 10% of the population [5].
Although a high plasma level of CA19-9 is suggestive of
pancreatic cancer in combination with clinical symptoms,
imaging studies are usually indicated before any biopsies
are undertaken. No other independently measured
plasma tumor marker has been shown to exceed CA19-9
in clinical utility.
A panel-based approach simultaneously measuring in
multiplex a combination of tumor markers that individu-
ally lack optimal sensitivity and specificity has the poten-
tial for yielding a diagnostic test with superior
characteristics. Previously, we used a multiplex biomar-
ker-measuring technique referred to as proximity ligation
assay (PLA) to identify a panel of human plasma biomar-
kers for pancreatic cancer [6,7]. PLA was initially devel-
oped as a technique to improve the sensitivity and
specificity of protein detection in a solution-phase, "liq-
uid sandwich ELISA" format [8,9]. As described, this
method employs pairs of antibodies coupled to DNA oli-
gonucleotides such that when the antibody pairs bind to
the target protein, the local concentration of DNA oligo-
nucleotides increases to allow for enzymatic ligation of
the two strands. The resulting amplicons are unique for
each specific protein detected and can be measured in a
highly quanititative manner by qPCR. Furthermore, PLA
can be multiplexed for simultaneous detection of multi-
ple proteins.
PLA has several advantages when compared to current
solid-phase approaches. This method of antigen quantifi-
cation is highly precise; antibody cross-reactivity signal is
not observed because of the dual-probe nucleic acid assay
design. Also, scalability of the multiplexing is superior to
existing methods, since PLA has no upper limit to single-
well multiplexing. Bead-based platforms such as Luminex
are currently limited to 200-plex assays, although in prac-
tice only up to 10 may be used simultaneously due to anti-
body crossreactivity [10]. Finally, quantification of a PLA
is versatile and can be executed on a number of platforms
including real-time PCR, mass spectrometry, next-genera-
tion sequencing and DNA microarrays. Ultimately, using
techniques such as PLA, diagnosis and staging may be
improved by detecting a unique pattern of biomarkers
that are increased as well as those that are decreased in the
plasma of patients displaying clinical symptoms of pan-
creatic cancer.
In this study, we assembled a cohort of 52 cases of locally
advanced, unresectable pancreatic ductal adenocarci-
noma (Stage II/III) and 43 healthy, age-matched controls.
To date, this dataset represents the largest cohort of pan-
creatic patients with PLA profiling of putative pancreatic
cancer biomarkers. After applying advanced statistical
methods to this dataset, we identified a panel of three
biomarkers that exceed the diagnostic accuracy of CA19-9
alone. In addition, we identified two biomarkers whose
combination are significantly prognostic for survival in
advanced, unresectable cancer, as determined by both
univariate and multivariate models.
Materials and methods
Proximity Ligation Assay
This study probes 21 putative tumor markers for relevance
in pancreatic cancer using a proximity ligation assay
(PLA). Multiplex PLA was performed on 95 frozen plasma
samples as described (3) with the following modifica-
tions. Samples were thawed and mixed in a 1:1 ratio with
buffer (Olink AB) for undiluted assays or in a 1:50 ratio
for diluted assays before incubation for 10 minutes at

Journal of Translational Medicine 2009, 7:105 http://www.translational-medicine.com/content/7/1/105
Page 3 of 12
(page number not for citation purposes)
room temperature. No PDGF-BB spike was added as in
previous studies. For probing, we mixed 2 μL of the buff-
ered plasma sample with 2 μL of any one of four probe
detection panels validated in the pilot study and incu-
bated the 4 μL mixture for 2 hours at 37°C to allow the
probes to bind analytes. Ligation was achieved by incubat-
ing 120 μL of reaction mixture with the 4 μL probed sam-
ples for 15 minutes at 30°C to dilute and separate any free
probes. To stop ligation, 2 μL of uracil-DNA excision mix
(Epicentre) was added and incubated for 15 minutes at
room temperature.
Preamplification of bar-coded amplicons required mixing
25 μL of ligation reaction mixture with 25 μL of pooled
PCR mix (Platinum Taq kit, Invitrogen). After 13 cycles at
95°C for 30 seconds and a 4-minute extension at 60°C,
the preamplification products were diluted 10-fold in TE.
For each protein assayed, a separate qPCR reaction was
required in a 384-well plate with 2 μL of diluted preampli-
cation product sample, 5 μL of iTaq mix (iTaq SYBR Green
Supermix with ROX, Bio-Rad), 2 μL qPCR primer mix,
and 1 μL water. Protein-specific qPCR detection primers
were not dried at the bottom of each well. Real-time qPCR
was performed with a sample volume of 10 μL per well for
40 cycles at 95°C for 15 seconds and 60°C for 1 minute.
To ensure standardization of values for each biomarker
investigated, all 95 samples were simultaneously probed
and evaluated on a single 384-well plate with a PBS-BSA
blank well.
Data Processing
Cycle threshold (Ct) values resulting from qPCR were
converted into estimated number of starting amplicons,
or PLA units, by calculating 10(-0.301 × Ct+11.439) as previ-
ously reported (7). After calculating PLA units, data were
subsequently transformed into log2 space in order to
increase normality in the distribution of the data while
retaining the magnitude of differences between different
tumor markers.
Human Plasma Samples
This study includes 52 human EDTA blood plasma sam-
ples collected between July 2002 and May 2007 from
identically staged patients with locally advanced pancre-
atic ductal adenocarcinoma (Stage II/III) treated at Stan-
ford University Medical Center under an institutional
review board-approved protocol. All plasma samples were
collected from untreated (de novo) patients with biopsy-
proven pancreatic adenocarcinomas. Median age at blood
collection was 68 years (range 37-84 years). All patients
were treated with gemcitabine based chemotherapy and
the majority also received radiotherapy. At the end of the
study, 41 patients were deceased. As a control group, 43
additional plasma samples were collected from age-
matched, healthy volunteers under an IRB-approved pro-
tocol. Immediately after acquisition, blood samples were
centrifuged and aliquots of plasma stored at -80°C.
Biomarker Panel Selection and Modeling
All statistical analyses completed in this study were exe-
cuted using the R statistical computing environment. To
select the discrete set of biomarkers used to fit models of
pancreatic cancer diagnosis, we used the R distribution of
the Prediction Analysis of Microarrays statistical tech-
nique, PAMR. Logistic regression models were fit using
the generalized linear model function in R.
Survival Analysis and Modeling
Survival data were fit to a right-censored model using the
Survival function in the R statistical computing environ-
ment. Univariate and multivariate Cox proportional haz-
ards models were fit onto survival data using the coxph
function. Hazard ratios were calculated as the ratios of risk
by the increase or decrease of 1 log2 PLA unit (2-fold
increase or decrease in plasma concentration of a biomar-
ker).
Results and Discussion
We used a proximity ligation assay (PLA) to measure the
levels of 21 tumor markers in the plasma of a cohort of 52
patients with unresectable, advanced pancreatic cancer as
well as a cohort of 43 healthy, age-matched volunteers.
After calculating log2 PLA units for each tumor marker
within each sample (Materials and Methods), we initially
determined whether any of these tumor markers are sig-
nificantly elevated or reduced in the plasma of unresecta-
ble pancreatic cancer patients compared to healthy
controls. To make this comparison, we used the Welch-
Satterthwaite modification of Student's t-test to determine
statistical significance and adjust for unequal variances
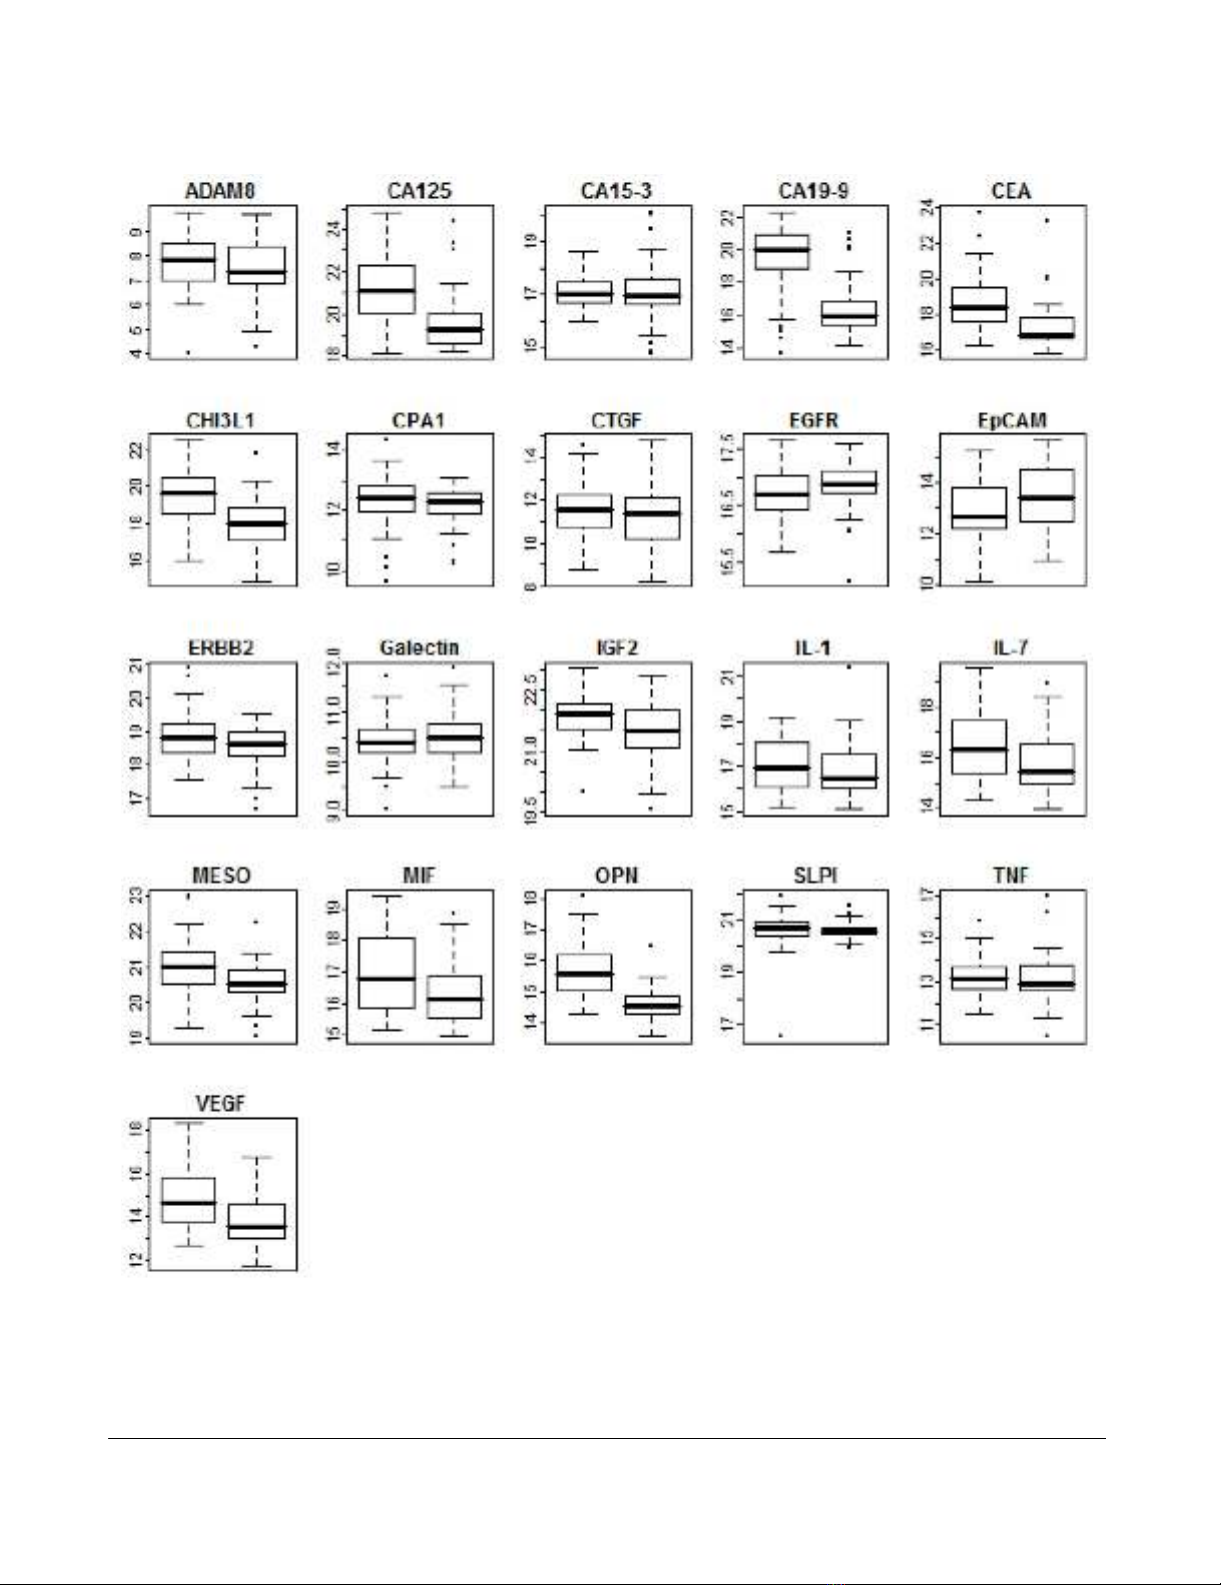
between cases and controls. Of the 21 tumor markers
assayed, we found that 11 were significantly elevated in
unresectable pancreatic cancer (p < 0.05) (Table 1). One
tumor marker, EpCAM, was significant to p < 0.04; we
would expect approximately 1 tumor marker at this level
of significance by random chance given that we assayed
21 tumor markers. We therefore did not consider EpCAM
significantly different in cases versus controls. These 11
significant tumor markers were uniformly elevated in
pancreatic cancer compared to controls (Figure 1). None
of the 21 tumor markers were significantly reduced in
pancreatic cancer compared to controls. The tumor
marker with the greatest significance of difference was
Osteopontin (OPN; p < 1.2 × 10⁻¹²), while the largest mag-
nitude of difference between cases and controls was
CA19-9 (approximately 8-fold). Six tumor markers had a
greater than 2-fold median elevation in pancreatic cancer
compared to controls.

Journal of Translational Medicine 2009, 7:105 http://www.translational-medicine.com/content/7/1/105
Page 4 of 12
(page number not for citation purposes)
In addition to identifying tumor markers that are signifi-
cantly elevated in the plasma of pancreatic cancer
patients, we investigated whether a panel of tumor mark-
ers could diagnose the presence of pancreatic cancer more
accurately than the current standard tumor marker for
pancreatic cancer, CA19-9. Currently, CA19-9 cannot be
used as a practical diagnostic marker because of approxi-
mately 80% sensitivity and selectivity rates, as well as an
overall 20% error rate. A panel consisting of CA19-9 com-
bined with additional tumor markers could potentially
increase the sensitivity and selectivity of tumor marker
diagnosis to clinically acceptable levels. To identify an
optimal combination of tumor markers that could accu-
rately identify and classify pancreatic cancer cases versus
healthy controls on the basis of PLA data, we used an anal-
ysis scheme whereby we divided the set of samples ran-
domly into three sets: a discovery set, a modeling set, and
a test set. The purpose of the discovery set is to identify the
Table 1: Proximity ligation assay reveals 11 tumor markers that are significantly elevated in pancreatic cancer cases compared to
healthy controls.
Tumor Marker p * < Fold Difference†Lower 95% CI Upper 95% CI
OPN 1.20 × 10⁻¹² 2.04 14.99 15.38
CA19-9 6.82 × 10⁻¹² 16.41 17.57 18.55
CHI3L1 8.60 × 10⁻⁸ 3.13 18.42 19.06
CA125 4.86 × 10⁻⁷ 3.54 20.20 20.89
CEA 1.35 × 10⁻⁵ 3 17.70 18.35
VEGF 3.22 × 10⁻⁴ 2.17 14.04 14.65
MESO 0.0014 1.39 20.63 20.92
IGF2 0.0022 1.35 21.45 21.78
IL-7 0.01 1.83 15.88 16.41
MIF 0.01 1.58 16.35 16.88
ERBB2 0.02 1.18 18.57 18.84
EpCam 0.04 0.63 12.85 13.35
EGFR 0.07 0.89 16.58 16.85
IL-1 0.28 1.36 16.72 17.18
ADAM8 0.29 1.35 7.41 7.85
Galectin 0.3 0.94 10.34 10.54
CTGF 0.4 1.12 11.07 11.60
CPA1 0.46 1.07 12.06 12.38
TNF 0.49 1.22 13.03 13.44
SLPI 0.68 1.08 20.41 20.73
CA15-3 0.82 1.02 16.88 17.24
* - p-values calculated using Welch-Satterthwaite Student's t-test and a two-sided distribution
† - Fold differences calculated comparing cases to controls using log2 medians in PLA units
Journal of Translational Medicine 2009, 7:105 http://www.translational-medicine.com/content/7/1/105
Page 5 of 12
(page number not for citation purposes)
Plasma levels of 21 tumor markers in pancreatic cancer patients and healthy controls measured by proximity ligation assayFigure 1
Plasma levels of 21 tumor markers in pancreatic cancer patients and healthy controls measured by proximity
ligation assay. Each boxplot corresponds to a single tumor marker measured in 95 samples by proximity ligation assay. Pan-
creatic cancer cases (52) are depicted at left, healthy controls (43) at right. Y-axis corresponds to log2 PLA units. Central bars
show the median for each cohort, boxes represent the interquartile 50th percentile (IQ50). Whiskers represent 1.5 times the
IQ50.


![Vaccine và ứng dụng: Bài tiểu luận [chuẩn SEO]](https://cdn.tailieu.vn/images/document/thumbnail/2016/20160519/3008140018/135x160/652005293.jpg)


%20--%3e%3cdefs%3e%3cstyle%3e%20.st0%20{%20fill:%20%23fff;%20}%20.st1%20{%20fill:%20%237800fa;%20}%20%3c/style%3e%3c/defs%3e%3cpath%20class='st1'%20d='M117.78,12.18H43.11c2.9,3.47,4.65,7.94,4.65,12.82,0,5.6-2.3,10.66-6.01,14.29h76.02l7.22-13.56-7.22-13.56Z'/%3e%3cg%3e%3cpath%20class='st0'%20d='M53.58,26.17h-.59v-1.46h.59v-4.96h2.83c1.78,0,2.67.94,2.67,2.82v5.76c0,1.87-.89,2.81-2.67,2.81h-2.83v-4.96ZM55.36,21.37v3.34h1.1v1.46h-1.1v3.34h1.01c.61,0,.91-.37.91-1.1v-5.93c0-.74-.3-1.1-.91-1.1h-1.01Z'/%3e%3cpath%20class='st0'%20d='M65.99,31.14h-1.8l-.31-2.07h-2.19l-.31,2.07h-1.64l1.82-11.39h2.62l1.82,11.39ZM65.28,18.04c-.25.46-.51.77-.75.94-.21.15-.47.22-.79.22-.26,0-.57-.07-.92-.22l-.38-.15c-.14-.05-.26-.07-.37-.07-.3,0-.53.18-.71.54l-.91-.68c.25-.46.51-.77.75-.94.21-.14.48-.21.79-.21.26,0,.57.07.92.21l.38.15c.14.05.26.07.37.07.3,0,.53-.18.71-.54l.91.68ZM61.91,27.52h1.73l-.87-5.76-.87,5.76Z'/%3e%3cpath%20class='st0'%20d='M74.53,26.89v1.52c0,1.91-.89,2.86-2.67,2.86s-2.67-.95-2.67-2.86v-5.93c0-1.91.89-2.86,2.67-2.86s2.67.95,2.67,2.86v1.11h-1.69v-1.22c0-.75-.31-1.12-.93-1.12s-.93.37-.93,1.12v6.15c0,.74.31,1.11.93,1.11s.93-.37.93-1.11v-1.63h1.69Z'/%3e%3cpath%20class='st0'%20d='M81.4,31.14h-1.8l-.31-2.07h-2.19l-.31,2.07h-1.64l1.82-11.39h2.62l1.82,11.39ZM75.9,19.2l1.52-1.91h1.71l1.51,1.91h-1.61l-.76-.95-.75.95h-1.61ZM77.32,27.52h1.73l-.87-5.76-.87,5.76ZM83.1,15.99l-1.76,1.91h-1.26l1.17-1.91h1.86Z'/%3e%3cpath%20class='st0'%20d='M84.86,19.75c1.78,0,2.67.94,2.67,2.82v1.48c0,1.87-.89,2.81-2.67,2.81h-.85v4.28h-1.79v-11.39h2.64ZM84.01,21.37v3.86h.85c.58,0,.87-.36.87-1.08v-1.71c0-.71-.29-1.07-.87-1.07h-.85Z'/%3e%3cpath%20class='st0'%20d='M93.51,19.75c1.78,0,2.67.94,2.67,2.82v1.48c0,1.87-.89,2.81-2.67,2.81h-.85v4.28h-1.79v-11.39h2.64ZM92.66,21.37v3.86h.85c.58,0,.87-.36.87-1.08v-1.71c0-.71-.29-1.07-.87-1.07h-.85Z'/%3e%3cpath%20class='st0'%20d='M98.8,31.14h-1.79v-11.39h1.79v4.88h2.03v-4.88h1.83v11.39h-1.83v-4.88h-2.03v4.88Z'/%3e%3cpath%20class='st0'%20d='M105.36,24.55h2.46v1.62h-2.46v3.34h3.09v1.63h-4.88v-11.39h4.88v1.63h-3.09v3.18ZM108.17,17.29l-1.76,1.91h-1.26l1.17-1.91h1.86Z'/%3e%3cpath%20class='st0'%20d='M112.2,19.75c1.78,0,2.67.94,2.67,2.82v1.48c0,1.87-.89,2.81-2.67,2.81h-.85v4.28h-1.79v-11.39h2.64ZM111.35,21.37v3.86h.85c.58,0,.87-.36.87-1.08v-1.71c0-.71-.29-1.07-.87-1.07h-.85Z'/%3e%3c/g%3e%3ccircle%20class='st1'%20cx='25'%20cy='25'%20r='20'/%3e%3cpath%20class='st0'%20d='M32.78,19.27c2.92,0,4.43,2.55,5.28,5.33l.71,2.17c.14.38-.33.75-.71.75h-5.61c.19-.33.24-.71.09-1.08l-.75-2.45c-.43-1.32-.99-2.64-1.79-3.77.75-.57,1.65-.94,2.78-.94h0ZM25,18.38c3.25,0,4.9,2.78,5.89,5.89l.76,2.45c.14.42-.33.8-.8.8h-11.69c-.42,0-.94-.38-.8-.8l.75-2.45c.99-3.11,2.64-5.89,5.89-5.89h0ZM25,11.35c1.74,0,3.11,1.37,3.11,3.11s-1.37,3.11-3.11,3.11-3.11-1.41-3.11-3.11,1.41-3.11,3.11-3.11h0ZM17.27,19.27c1.08,0,1.98.38,2.73.94-.8,1.13-1.37,2.45-1.74,3.77l-.8,2.45c-.14.38-.05.75.09,1.08h-5.56c-.42,0-.9-.38-.75-.75l.71-2.17c.9-2.78,2.41-5.33,5.33-5.33h0ZM17.27,12.91c1.51,0,2.78,1.27,2.78,2.83s-1.27,2.83-2.78,2.83-2.83-1.27-2.83-2.83,1.27-2.83,2.83-2.83h0ZM32.78,12.91c1.56,0,2.78,1.27,2.78,2.83s-1.23,2.83-2.78,2.83-2.83-1.27-2.83-2.83,1.27-2.83,2.83-2.83h0ZM27.07,28.56v.09c0,.57-.24,1.08-.61,1.46h0v.05c-.38.33-.9.57-1.46.57s-1.08-.24-1.46-.61h0c-.38-.38-.61-.9-.61-1.46v-.09h1.41v.09c0,.19.05.38.19.47v.05c.09.09.28.19.47.19s.38-.09.47-.19v-.05c.14-.09.24-.28.24-.47t-.05-.09h1.41ZM30.99,28.56v.09c0,1.65-.66,3.16-1.74,4.24-1.08,1.08-2.59,1.79-4.24,1.79s-3.16-.71-4.24-1.79l-.05-.05c-1.04-1.08-1.7-2.55-1.7-4.2v-.09h1.41v.09c0,1.27.47,2.4,1.27,3.25h.05c.85.85,1.98,1.37,3.25,1.37s2.4-.52,3.25-1.37c.85-.8,1.37-1.98,1.37-3.25v-.09h1.37ZM34.99,28.56v.09c0,2.78-1.13,5.28-2.92,7.07-1.79,1.79-4.29,2.92-7.07,2.92s-5.23-1.13-7.07-2.92c-1.79-1.79-2.92-4.29-2.92-7.07v-.09h1.41v.09c0,2.4.94,4.53,2.5,6.08,1.56,1.56,3.72,2.5,6.08,2.5s4.52-.94,6.08-2.5c1.56-1.56,2.5-3.68,2.5-6.08v-.09h1.41Z'/%3e%3c/svg%3e)