Original
article
Branchiness
of
Norway
spruce
in
north-eastern
France:
modelling
vertical
trends
in
maximum
nodal
branch
size
F Colin
F
Houllier
1
INRA,
Centre
de
Recherches
Forestières
de
Nancy,
Station
de
Recherches
sur
la
Qualité
des
Bois,
54280
Champenoux;
2
ENGREF,
Laboratoire
ENGREF/INRA
de
Recherches
en
Sciences
Forestières,
Unité
Dynamique
des
Systèmes
Forestiers,
14,
rue
Girardet,
54042
Nancy
Cedex,
France
(Received
13
March
1991;
accepted
12
September
1991)
Summary —
This
paper
is
part
of
a
study
which
aims
at
proposing
a
new
method
for
assessing
the
wood
quality
of
Norway
spruce
from
northeastern
France.
One
component
of
this
method
is
a
wood
quality
simulation
software
that
requires
detailed
inputs
describing
tree
branchiness
and
morpholo-
gy.
The
specific
purpose
of
this
paper
is
to
present
a
model
that
predicts
maximum
limbsize at
vari-
ous
points
along
the
stem.
The
dependent
variable
of
the
model
is
the
maximum
diameter
per
annu-
al
growth
unit.
The
independent
variables
are
the
relative
distance
from
the
growth
unit
to
the
top
of
the
stem
and
some
combinations
of
standard
whole-tree
measurements
and
general
crown
descrip-
tors.
The
equation
is
a
segmented
polynomial
with
a
join
point
at
the
height
of
the
largest
branch
di-
ameter
for
each
tree.
First,
individual
models
are
fitted
to
each
sample
tree.
Then
a
general
equation
is
derived
by
exploring
the
behaviour
of
the
individual
tree
parameters
of
the
polynomial
model
as
functions
of
other
individual
tree
attributes.
Finally
the
model
is
validated
on
an
independent
data
set
and
is
discussed
with
respect
to
biological
and
methodological
aspects
and
to
possible
applications.
branchiness
/
crown
ratio
/
modelling
/
wood
resource
/
wood
quality
/
Picea
abies
Résumé —
Branchaison
de
l’épicéa
commun
dans
le
Nord-Est
de
la
France :
modélisation
du
diamètre
maximal
des
branches
verticillaires
le
long
de
la
tige.
Cet
article
s’insère
dans
un
pro-
jet
qui
vise
à
proposer
une
méthode
d’évaluation
de
la
qualité
de
la
ressource
en
épicéa
commun
du
Nord-Est
de
la
France.
Ce
projet
s’appuie
notamment
sur
un
logiciel
de
simulation
de
la
qualité
des
sciages
(Leban
et
Duchanois,
1990)
qui
nécessite
une
description
détaillée
de
la
morphologie
et
de
la
branchaison
de
chaque
arbre.
Cet
article
a
pour
but
de
proposer
un
modèle
de
prédiction
de
la
distribution
du
diamètre
des
branches
le
long
de
la
tige.
La
variable
prédite
est
le
diamètre
maximal
de
branche
par
unité
annuelle
de
croissance.
Les
variables
indépendantes
du
modèle
sont
la
dis-
tance
de
l’unité
de
croissance
à
l’apex
ainsi
que
des
combinaisons
des
variables
dendrométriques
usuelles
et
des
descripteurs
globaux
du
houppier.
L’équation
est
non
linéaire
et
segmentée
autour
d’une
valeur
critique
qui
correspond
à
la
position
de
la
plus
grosse
branche
de
l’arbre.
On
ajuste
d’abord
un
modèle
individuel
pour
chaque
arbre
échantillonné.
Puis
on
construit
un
modèle
global
à
partir
d’une
analyse
du
comportement
des
paramètres
du
modèle
individuel
en
fonction
d’autres
ca-
ractéristiques
dendrométriques.
Ce
modèle
est
ensuite
validé
sur
un jeu
de données
indépendantes.
On
discute
finalement
des
propriétés
de
ce
modèle
tant
au
plan
méthodologique
et
biologique
qu’au
plan
de
ses
possibilités
d’utilisation.
branchaison
/
houppier
/
modélisation
/
ressource
en
bols
/
qualité
du
bols
/
Picea
abies
INTRODUCTION
Description
and
modelling
of
tree
branchi-
ness
may
be
carried
out
in
various
con-
texts:
growth
and
yield
investigations,
silvi-
cultural
and
genetic
experiments,
logging
and
wood
quality
studies.
The
analysis
and
the
prediction
of
branch
size
(ie
branch
diameter)
is
obviously
one
of
the
most
important
features
of
branchiness
studies.
Several
authors
have
already
con-
sidered
the
limbsize
at
various
heights:
Madsen
et
al
(1978),
at
2.5,
5
and
7.5
m
from
ground
level;
Hakkila
et
al
(1972),
at
70%
of
the
total
height,
De
Champs
(1989),
at
the
fourth
and
eighth
whorl
counted
from
tree
base;
Maguire
and
Hann
(1987),
at
the
point
where
the
radial
extension
of
the
crown
is
at
its
maximum.
Other
authors
(Ager
et
al
(1964)
and
Western
(1971)
in
Kärkkaïnen
(1972)
op
cit;
Kärkkäinen
(1972),
Uusvaara
(1985))
observed
the
relationship
between
limb
size
and
the
distance
from
the
top
of
the
stem.
However,
few
studies
have
tried
to
model
this
vertical
trend
and
predict
the
maximum
limbsize
anywhere
along
the
stem
(Maguire
et al,
1990,
on
Douglas
fir).
This
study
aims
to
develop
a
limbsize
model
that
links
standard
whole-tree
measurements
(age,
total
height,
diameter
at
breast
height)
to
the
required
inputs
of
a
wood
quality
simulation
software
(Simqua;
Leban
and
Duchanois,
1990).
This
soft-
ware
requires
information
on
stem
taper,
ring
width
patterns
and
branching
structure
(insertion
angle,
diameter,
number
of
no-
dal
and
internodal
branches).
It
can
then
simulate
the
sawing
process
for
any
board
sawn
from
any
stem
for
which
this
detailed
information
is
available.
It
can
further
sim-
ulate
lumber
grading
by
examination
of
the
4
faces
of
each
board
and
application
of
grading
rules
(for
instance,
French
grading
rules
for
softwood
lumber).
This
sofware
and
the
results
of
the
present
study
will
be
integrated
into
a
sys-
tem
for
predicting
the
quality
of
the
conifer-
ous
wood
resources
from
the
data
record-
ed
by
regional
or
national
forest
inventories.
This
project
deals
specifically
with
Norway
spruce
in
northeastern
France
(ENGREF,
INRA,
UCBL,
1990).
Until
now
the
project
has
focused
on
mid-size
with
a
diameter
at
breast
height
(DBH)
ranging
between
15
and
35
cm.
There
are
2
reasons
for
this
choice:
1),
this
size
range
will
provide
most
of
the
stems
that
will
be
harvested
in
the
coming
dec-
ades;
2),
the
prediction
of
the
quality
of
these
logs
is
important
because
they
may
either
be
sawn
or
utilized
as
pulpwood.
Applications
of
this
study
are
not
limited
to
this
particular
project,
since
branching
structure
can
also
be
related
to
growth
modelling.
Indeed,
crown
development
and
recession
are
intimately
linked
to
wood
yield
through
the
interactions
between
branch
size,
leaf
area
and
carbon
assimila-
tion
rate.
Therefore,
information
on
branch
size
at
various
stages
of
stand
develop-
ment
provide
an
insight
into
the
dynamic
interactions
between
stem
and
crown.
MATERIAL
AND
METHODS
Study area
All
the
trees
were
sampled
in
the
Vosges
depart-
ment,
in
the
northeastern
part
of
France
where
Norway
spruce
stands
are
mostly
located
in
the
Vosges
mountains,
at
elevations
ranging
from
400
to
1
100
m.
The
approximate
annual
precipi-
tation
is
between
800
and
2
200
mm
while
mean
temperature
ranges
from
8
to
5
°C.
Snow
is
abundant
above
800-900
m.
In
the
pre-Vosgian
hills,
sandstone
with
volt-
zite
prevails
on
the
western
side,
while
much
di-
versity
appears
(limestone,
clay,
sandstone)
on
the
eastern
side.
The
lower
Vosges,
between
350
and
900-1
000
m,
are
composed
of
triassic
limestones,
which
produce
acid
soils
covered
by
forests,
and
also
permian
limestones,
which
yield
richer
soils
that
are
seldom
occupied
by
fo-
rests.
The
high
Vosges
are
composed
of
gran-
ites
of
various
kinds,
producing
primarily
rich
soils,
although
these
soils
can
sometimes
be
poor
to
very
poor
(Jacamon,
1983).
Sampling
Three
subsamples
were
collected,
2
for
building
the
model
and
the
third
one
for
its
validation.
The
trees
of
the
2
first
subsamples
were
meas-
ured
after
felling
whereas
the
last
subsample
was
obtained
by
climbing
the
trees.
Subsample
1
The
sample
trees
(between
30
and
180
years
of
age)
came
from
public
forests
managed
by
the
ONF
(Office
National
des
Forêts).
In
1988,
10
trees
without
severe
damage
from
late
frosts
and/or
forest
decline
(in
upper
elevations)
were
sampled
in
10
stands,
for
which
the
current
den-
sity
ranged
between
500
and
1 500
stems
per
ha.
The
past
silviculture
of
these
stands
was
un-
known.
Subsample
2
In
1989, 16
trees
were
removed
by
thinning
in
a
private
experimental
plantation,
managed
by
AF-
OCEL
(Association
Forêt-Cellulose).
This
stand
represents
a
fairly
intensive
silvicultural
regime
when
compared
with
usual
practices
carried
out
in
non
experimental
stands.
The
seedlings
(6
years
in
the
nursery)
were
installed
in
1961
and
then
thinned
in
1974, 1983
and
1989.
Subsample
3
For
9
of
the
10
stands
belonging
to
the
first
sub-
sample,
and
for
7
trees
in
each
of
these
stands,
the
diameter
of
the
thickest
whorl
branch
per
an-
nual
shoot
was
collected
up
to
the
maximum
height
that
it
was
possible
to
reach
by
climbing.
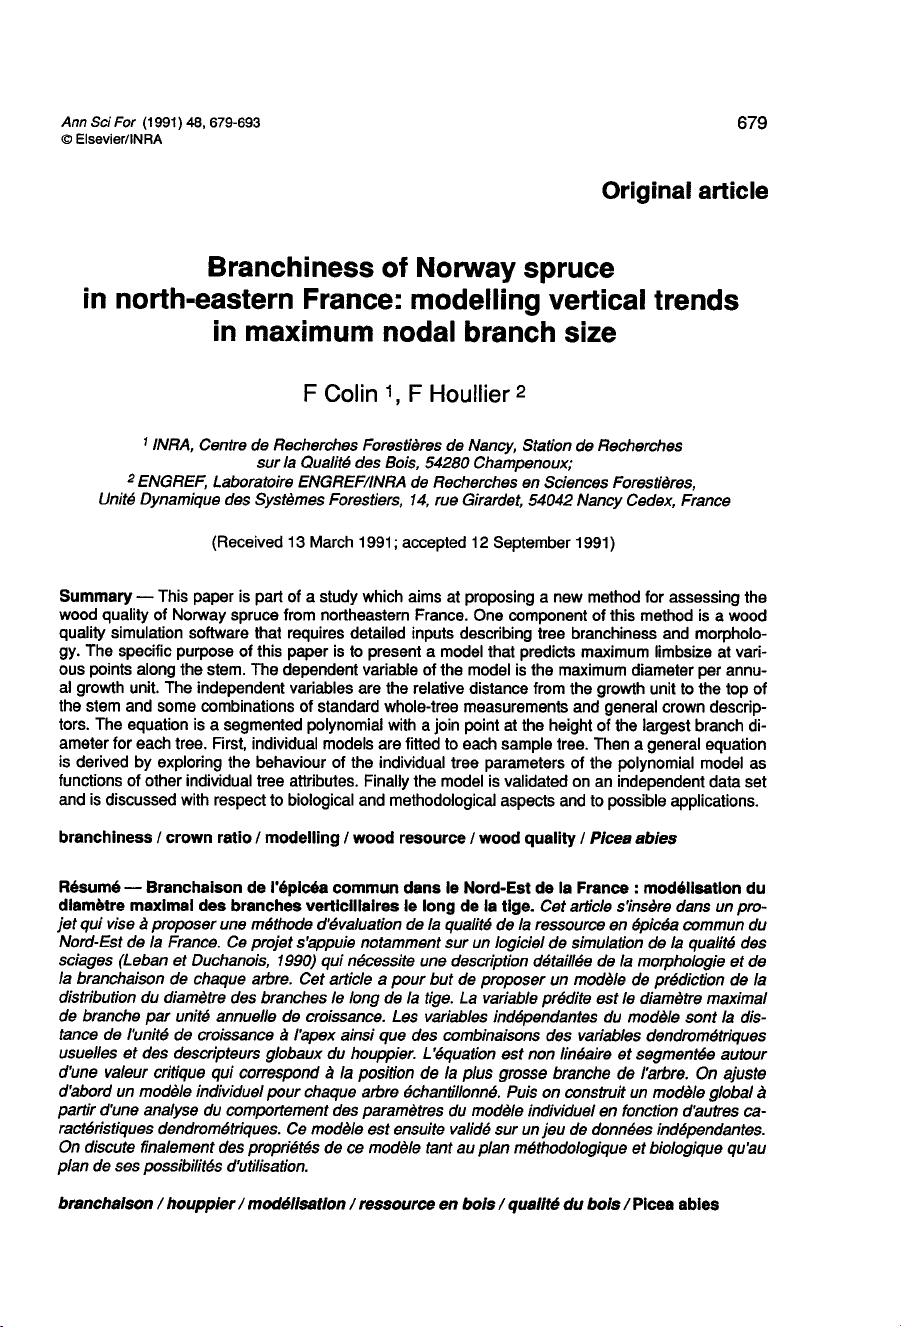
Figure
1
shows
the
frequency
of
samples
trees
by
diameter
at
breast
height,
total
stem
height,
total
age
and
crown
ratio
(for
an
exact
definition
of
the
latter
parameter,
see
the
Statisti-
cal
analysis
section).
Data
collection
For
the
first
2
subsamples,
the
following
vari-
ables
were
measured:
-
the
length
of
each
annual shoot
and
the
dis-
tance
from
the
top
of
the
tree
to
the
upper
bud
scale
scars
(measured
to
the
nearest
2
cm);
-
the
diameter
over
bark
for
each
whorl
branch
(ie
having
a
diameter
>
5 mm)
with
a
digital
cali-
per
(to
the
nearest
mm
and
at
a
distance
from
the bole
that
was
approximately
equal
to
one
branch
diameter);
-
the
"height
to
the
live
crown"
which
was
de-
fined
as
the
height
from
the
base
of
the
tree
to
the
first
whorl
including
more
than
three-
quarters
of
green
branches
(modified
from
Ma-
guire
and
Hann,
1987,
op
cit);
-
the
total
height
of
the
stem
and
the
diameter
at
breast
height;
-
the
age
by
counting
the
number
of
rings
at
the
stump
after
felling.
For
the
third
subsample,
only
the
diameter
of
the
thickest
whorl
branch,
instead
of
the
diame-
ter
of
each
whorl
branch,
was
measured.
Statistical
analysis
Two
kinds
of
data
were
used:
"the
branch
de-
scriptors"
and
the
"whole-tree
descriptors".
The
latter
were
the
standard
tree
measurements
and
different
crown
heights
and
crown
ratios:
AGE =
total
age
of
the
tree
(in
years);
DBH
=
diameter
(of
the
stem)
at
breast
height
(in cm);
H
=
total
height
of
the
stem
(in
cm);
H/DBH =
= ratio
between
H and
DBH;
HFLB
= height
to
the
first
live
branch
(in
cm);
HBLC
= height
to
the
base
of
the
live
crown
as
previously
defined
(in
cm);
HC
=
average
of
the
2
previous
heights,
HFLB
and
HBLC
(in
cm);
The
"branch
descriptors"
were
relative
either
to
an
individual
branch
or
to
the
whorl
(or
to
the
annual
shoot)
where
the
branch
is
located:
X
=
absolute
distance
from
the
upper
bud
scale
scars
of
the
annual
shoot
to
the
top
of
the
stem
(in cm)
XR
= 100
X/H
= relative
distance
from
the
upper
bud
scale
scars
of
the
annual
shoot
to
the
top
of
the
stem
(in
%).
DBR
= diameter
of
the
branch
(in
cm).
In
the
nonlinear
models
that
were
tested,
we
focused
on
the
prediction
of
the
diameter
of
the
thickest
branch
per
annual
shoot,
DBRMAX.
The
independent
variables
(ie
the
predictors)
were
the
whole-tree
measurements
as
well
as
the
absolute
and
relative
distances
to
the
top
1.
The
analysis
was
carried
out
in
4
steps:
First
step:
We
tried
to
model
the
variation
of
DBRMAX
along
each
stem
with
individual
equa-
tions
(one
per
tree)
according
to
the
relative
dis-
tance
to
the
top
of
the
stem,
XR :
where
i
denotes
the
ith
tree, j
the
jth
annual
shoot,Θ
i
the
model
parameters
specific
to
the
i th
tree
and
ϵ
i,j
random
homoscedastic
and
non
autocorrelated
variable.
Second
step:
We
analyzed
the
variability
of
the
parameters
Θ
i
in
relation
to
the
whole
tree
de-
scriptors
and
then
tried
to
fit
temporary
equa-
tions
of
the
following
type:
Θ
i
=
g(DBH
i,
Hi,
AGE
i,
Hi
/DBH
i,
CR
1i,
CR 2
i,
CR
3i,
HFLB
i,
HBLC
i,
HC
i
, ψ)
+ η
i
(2)
where ψ
denotes
the
global
model
parameters
common
to
all
trees
and
η
i
a
random
error.
Third
step:
We
moved
from
the
individual
mod-
els
towards
a
global
model
by
progressively
re-
placing
the
Θ
i
parameters
in
(1)
by
their
predic-
tions
(equation
2).
We
finally
obtained
models
of
the
following
form:
DBRMAX
i,j
=
f(XR
i,j
,
Θ(DBH
i,
Hi,
AGE
i,
Hi
/DBH
i,
CR1
i
,...;
ψ)) + ϵ
i,j
(3)
These
global
models
were
then
compared
with
the
individual
ones
in
order
to
check
that
there
was
no
great
loss
in
accuracy.
These
3
first
steps
only
used
the
data
from
the
first
2
sub-
samples.
Fourth
step:
We
used
the
data
of
the
third
sub-
sample
to
validate
the
model
and
then
put
the
3
data
sets
together
and
re-estimated
parameters
for
a
final
global
model.
RESULTS
Individual
models
Several
preliminary
models
were
explored
and
tested.
A
modified
Chapman-Richards
equation
was
one
of
the
best:
(ie
the
differential
form
of
the
usual
Chap-
man-Richards
model
with
a,
β
and
y
be-
ing
parameters:
a >
0,
β and
γ ≥
1).
However,
it
did
not
adequately
describe
the
peak
of
the
experimental
curve
around
the
thickest
branches
of
the
stem.
Indeed,
the
prediction
of
the
thickest
branch
of
the
tree
was
not
efficient,
either
for
the
location
of
this
branch
along
the
stem
or
for
its
di-
ameter.
By
observing
the
actual
DBRMAX distri-
bution
along
the
stem,
the
idea
was
pro-
posed
to
choose
a
segmented
second
or-
der
polynomial
model
(Max
and
Burkhardt,
1975;
Tomassone
et al,
1983,
p
119-122;
with
a
join
point
value
(ξ)
which
is
the
loca-
tion
of
the
estimated
thickest
branch:
where
a,
β,
γ and ξ
are
constrained
param-
eters:
a
> 0, β
<
0,
y<
0
and


%20--%3e%3cdefs%3e%3cstyle%3e%20.st0%20{%20fill:%20%23fff;%20}%20.st1%20{%20fill:%20%237800fa;%20}%20%3c/style%3e%3c/defs%3e%3cpath%20class='st1'%20d='M117.78,12.18H43.11c2.9,3.47,4.65,7.94,4.65,12.82,0,5.6-2.3,10.66-6.01,14.29h76.02l7.22-13.56-7.22-13.56Z'/%3e%3cg%3e%3cpath%20class='st0'%20d='M53.58,26.17h-.59v-1.46h.59v-4.96h2.83c1.78,0,2.67.94,2.67,2.82v5.76c0,1.87-.89,2.81-2.67,2.81h-2.83v-4.96ZM55.36,21.37v3.34h1.1v1.46h-1.1v3.34h1.01c.61,0,.91-.37.91-1.1v-5.93c0-.74-.3-1.1-.91-1.1h-1.01Z'/%3e%3cpath%20class='st0'%20d='M65.99,31.14h-1.8l-.31-2.07h-2.19l-.31,2.07h-1.64l1.82-11.39h2.62l1.82,11.39ZM65.28,18.04c-.25.46-.51.77-.75.94-.21.15-.47.22-.79.22-.26,0-.57-.07-.92-.22l-.38-.15c-.14-.05-.26-.07-.37-.07-.3,0-.53.18-.71.54l-.91-.68c.25-.46.51-.77.75-.94.21-.14.48-.21.79-.21.26,0,.57.07.92.21l.38.15c.14.05.26.07.37.07.3,0,.53-.18.71-.54l.91.68ZM61.91,27.52h1.73l-.87-5.76-.87,5.76Z'/%3e%3cpath%20class='st0'%20d='M74.53,26.89v1.52c0,1.91-.89,2.86-2.67,2.86s-2.67-.95-2.67-2.86v-5.93c0-1.91.89-2.86,2.67-2.86s2.67.95,2.67,2.86v1.11h-1.69v-1.22c0-.75-.31-1.12-.93-1.12s-.93.37-.93,1.12v6.15c0,.74.31,1.11.93,1.11s.93-.37.93-1.11v-1.63h1.69Z'/%3e%3cpath%20class='st0'%20d='M81.4,31.14h-1.8l-.31-2.07h-2.19l-.31,2.07h-1.64l1.82-11.39h2.62l1.82,11.39ZM75.9,19.2l1.52-1.91h1.71l1.51,1.91h-1.61l-.76-.95-.75.95h-1.61ZM77.32,27.52h1.73l-.87-5.76-.87,5.76ZM83.1,15.99l-1.76,1.91h-1.26l1.17-1.91h1.86Z'/%3e%3cpath%20class='st0'%20d='M84.86,19.75c1.78,0,2.67.94,2.67,2.82v1.48c0,1.87-.89,2.81-2.67,2.81h-.85v4.28h-1.79v-11.39h2.64ZM84.01,21.37v3.86h.85c.58,0,.87-.36.87-1.08v-1.71c0-.71-.29-1.07-.87-1.07h-.85Z'/%3e%3cpath%20class='st0'%20d='M93.51,19.75c1.78,0,2.67.94,2.67,2.82v1.48c0,1.87-.89,2.81-2.67,2.81h-.85v4.28h-1.79v-11.39h2.64ZM92.66,21.37v3.86h.85c.58,0,.87-.36.87-1.08v-1.71c0-.71-.29-1.07-.87-1.07h-.85Z'/%3e%3cpath%20class='st0'%20d='M98.8,31.14h-1.79v-11.39h1.79v4.88h2.03v-4.88h1.83v11.39h-1.83v-4.88h-2.03v4.88Z'/%3e%3cpath%20class='st0'%20d='M105.36,24.55h2.46v1.62h-2.46v3.34h3.09v1.63h-4.88v-11.39h4.88v1.63h-3.09v3.18ZM108.17,17.29l-1.76,1.91h-1.26l1.17-1.91h1.86Z'/%3e%3cpath%20class='st0'%20d='M112.2,19.75c1.78,0,2.67.94,2.67,2.82v1.48c0,1.87-.89,2.81-2.67,2.81h-.85v4.28h-1.79v-11.39h2.64ZM111.35,21.37v3.86h.85c.58,0,.87-.36.87-1.08v-1.71c0-.71-.29-1.07-.87-1.07h-.85Z'/%3e%3c/g%3e%3ccircle%20class='st1'%20cx='25'%20cy='25'%20r='20'/%3e%3cpath%20class='st0'%20d='M32.78,19.27c2.92,0,4.43,2.55,5.28,5.33l.71,2.17c.14.38-.33.75-.71.75h-5.61c.19-.33.24-.71.09-1.08l-.75-2.45c-.43-1.32-.99-2.64-1.79-3.77.75-.57,1.65-.94,2.78-.94h0ZM25,18.38c3.25,0,4.9,2.78,5.89,5.89l.76,2.45c.14.42-.33.8-.8.8h-11.69c-.42,0-.94-.38-.8-.8l.75-2.45c.99-3.11,2.64-5.89,5.89-5.89h0ZM25,11.35c1.74,0,3.11,1.37,3.11,3.11s-1.37,3.11-3.11,3.11-3.11-1.41-3.11-3.11,1.41-3.11,3.11-3.11h0ZM17.27,19.27c1.08,0,1.98.38,2.73.94-.8,1.13-1.37,2.45-1.74,3.77l-.8,2.45c-.14.38-.05.75.09,1.08h-5.56c-.42,0-.9-.38-.75-.75l.71-2.17c.9-2.78,2.41-5.33,5.33-5.33h0ZM17.27,12.91c1.51,0,2.78,1.27,2.78,2.83s-1.27,2.83-2.78,2.83-2.83-1.27-2.83-2.83,1.27-2.83,2.83-2.83h0ZM32.78,12.91c1.56,0,2.78,1.27,2.78,2.83s-1.23,2.83-2.78,2.83-2.83-1.27-2.83-2.83,1.27-2.83,2.83-2.83h0ZM27.07,28.56v.09c0,.57-.24,1.08-.61,1.46h0v.05c-.38.33-.9.57-1.46.57s-1.08-.24-1.46-.61h0c-.38-.38-.61-.9-.61-1.46v-.09h1.41v.09c0,.19.05.38.19.47v.05c.09.09.28.19.47.19s.38-.09.47-.19v-.05c.14-.09.24-.28.24-.47t-.05-.09h1.41ZM30.99,28.56v.09c0,1.65-.66,3.16-1.74,4.24-1.08,1.08-2.59,1.79-4.24,1.79s-3.16-.71-4.24-1.79l-.05-.05c-1.04-1.08-1.7-2.55-1.7-4.2v-.09h1.41v.09c0,1.27.47,2.4,1.27,3.25h.05c.85.85,1.98,1.37,3.25,1.37s2.4-.52,3.25-1.37c.85-.8,1.37-1.98,1.37-3.25v-.09h1.37ZM34.99,28.56v.09c0,2.78-1.13,5.28-2.92,7.07-1.79,1.79-4.29,2.92-7.07,2.92s-5.23-1.13-7.07-2.92c-1.79-1.79-2.92-4.29-2.92-7.07v-.09h1.41v.09c0,2.4.94,4.53,2.5,6.08,1.56,1.56,3.72,2.5,6.08,2.5s4.52-.94,6.08-2.5c1.56-1.56,2.5-3.68,2.5-6.08v-.09h1.41Z'/%3e%3c/svg%3e)