
* Corresponding author
E-mail address: manhdung@ktpt.edu.vn (M. D. Tran)
© 2020 by the authors; licensee Growing Science.
doi: 10.5267/j.uscm.2020.1.003
Uncertain Supply Chain Management 8 (2020) 241–254
Contents lists available at GrowingScience
Uncertain Supply Chain Management
home
p
a
g
e: www.Growin
g
Science.com/usc
m
A study on customer satisfaction on debit cards: The case of Vietnam
Thi Hoai Linh Truonga, Hong Mai Phana and Manh Dung Trana*
aNational Economics University, Vietnam
C H R O N I C L E A B S T R A C T
Article history:
Received October 26, 2019
Received in revised format
December 27, 2019
Accepted January 20 2020
Available online
Januar
y
20 2020
This research is conducted to examine the determinants of customer satisfaction in using debit
cards issued by the Vietnam commercial banks (CB). By applying the exploratory factor
analysis (EFA), logistic regression and linear regression on a dataset of 428 customers, we find
that the features and price of products were the key determinants influencing the frequency of
using debit cards. However, the impact of each determinant is heterogeneous among different
groups of customers. Product price and features are more likely to influence the users using
debit cards to purchase goods or services in stores or online than customers working for the
public agencies or frequently using non-cash payment for high-valued transaction.
.license Growin
g
Science, Canada2020 b
y
the authors; ©
Keywords:
Payment services via debit
cards
Satisfaction
Commercial banks
Vietnam
1. Introduction
This study is conducted to meet two theoretical and practical needs. First, despite the rapid growth of
payment services via debit cards offered by Vietnamese commercial banks, the quality of these services
does not meet the clients’ expectation. Recently, the number of complaints and inconvenience to
customers about debit card services tend to increase. This has resulted in breaking customer loyalty and
then switch service providers. Customer dissatisfaction may arise from the shortage and uneven
allocation of point of sales (POS), high fee, inadequate and unprofessional customer services (Truong
& Phan, 2017; Oliver, 1980). In fact, debit cards are mainly utilized for money withdrawal rather than
online, POS or ATM payments. According to the World Bank, Vietnam has the lowest rate of non-cash
transactions in the region at 4.9% in comparison with 26.1%, 59.7% and 89.0% in China, Thailand and
Malaysia, respectively. Furthermore, customer dissatisfaction and frequent switch on card providers
lead to a large number of inactive cards and low card payment turnover. A report by Ernst & Young in
2014 showed that 65% of Vietnamese customers were willing to change financial service providers.
Although ATMs have accounted for more than 90% of total bank-issued cards, there have been only
77 million active cards, along with 55 million unused cards. This situation makes bank hardly increase
their card payment turnover and suffer more costs to keep track and maintain cash transactions at

242
ATMs. Due to the significant importance of non-interest revenue to bank efficiency (Nguyen, 2017),
Vietnamese commercial banks must continue to aim to increase the popularity of card payment and
limit cash transaction in the economy.
Second, previous studies have demonstrated the positive relationship between service quality and
customer satisfaction (for example Tran & Bui 2013, Tran & Pham 2013, Chu 2014). Generally, earlier
studies have considered quality in banking services as “how well the service delivered meets customers’
needs”. To measure customer satisfaction as well as the linking quality, satisfaction and loyalty in
banking services, they either applied the original models of service quality or adjusted some of
dimensions of those models in the context of Vietnam. Yet, their findings have contributed to rather
than providing implications for banks to make final service decision because data concerning
customer’s assessment was not completely mined by those researches.
This research focuses on answering the following questions: (i) What are the drivers behind the
customer satisfaction and dissatisfaction with debit card services? (ii) How do these determinants affect
the choice and usage of debit card holders among different groups? In order to address the questions,
we apply another scale to measure service quality which was more familiar with banking services than
other scales. We rely on the primary data that was collected from interviewing a survey sample of 428
customers residing in Hanoi-the capital of Vietnam. Thus, findings discovered from analysis are more
thorough than that of other researches.
2. Literature review
Service quality has been defined obviously by different authors. For example, Olivier (1993), Zeitham
(1988) define service quality as a global judgment relating to the superiority of the service provided
over customer expectations. Specifically, service quality is referred to as the difference between
customer expectations of “what they want” and their perceptions of “what they get” (Brown & Swartz,
1989; Parasuraman et al., 1985, 1988; Teas, 1993). Based on varied conceptualizations, alternative
scales have been proposed for service quality measurement. For instance, Lehtinen & Lehtinen (1982)
highlight that the quality of service as perceived by customers has two dimensions including (i) process
of service act (i.e., the manner in which service is delivered) and (ii) the outcome of service act (i.e.,
what the customers receive from the service).
On the other hand, service providers should demonstrate the ability to deliver and exceed customer
expectations not only with how they deliver the services (functional quality), but also with what they
deliver (technical quality) and these quality categories may influence customers’ image of the service
providers (Gronroos, 1984, 2001). Parasuraman (1985, 1988) emphasize that there are five dimensions
used to evaluate service quality, including (i) Tangibles (representing physical facilities, equipment,
and appearance of personnel), (ii) Reliability (representing ability to perform the promised service
dependably and accurately), (iii) Responsiveness (representing the willingness to help customers and
provide prompt service, (iv) Assurance (representing the knowledge and courtesy of employees and
they ability to inspire trust and confidence, and (v) Empathy (representing caring, individualized
attention the firm provide its customers).
For measuring the quality of electronic payment service conducted by banks, Humphrey et al. (1996)
used four dimensions including output price, infrastructure, safety and financial strength of banks.
Using research simple of banks in 14 developing countries, the authors find that banks should be
interested in price policies (including fee and interest rates), infrastructure investment (in POS,
ATM, etc.) in order to improve their electronic payment services. In later years, Boeschoten (1998),
Humphrey et al. (2001) add dimensions of Transaction features, including transaction process,
transaction time length and the interaction between bank officers and their customers, particularly
in dealing with customer’s complaints about banking services. A study on electronic banking by
Baskar & Ramesh (2010) in India finds that the online customer service quality, online information
system quality and banking service product quality significantly and positively influence the customer
T. H. L. Truong et al. /Uncertain Supply Chain Management 8 (2020)
243
satisfaction. Parasuraman et al. (1994) illustrate the need of customer expectation as measured by a
comparative standard to evaluate service quality. The aim of increasing service quality is to enhance
customer’s perceptions in line with their expectations, then eventually to strengthen customer
satisfaction. Moreover, this was approved to promote customers repeat patronage (Dick & Basu, 1994).
They describe loyalty as the strength of the relationship between a customer’s relative attitude and
repeat patronage and found out four following categories of loyalty due to above relationship. Service
providers should pay attention to the group of spurious - loyalty customers who are less likely to rebuy
the service in the case of their willingness to seek better services that exceed their inertia (Gounaris &
Stathakopoulos, 2004). Thus, it is necessary to meet most of customer expectations rather than their
current perceptions in order to make them to consistently repeat their repurchasing behaviors
(Parasuraman et al., 1994).
3. Research methodology
3.1. Research design
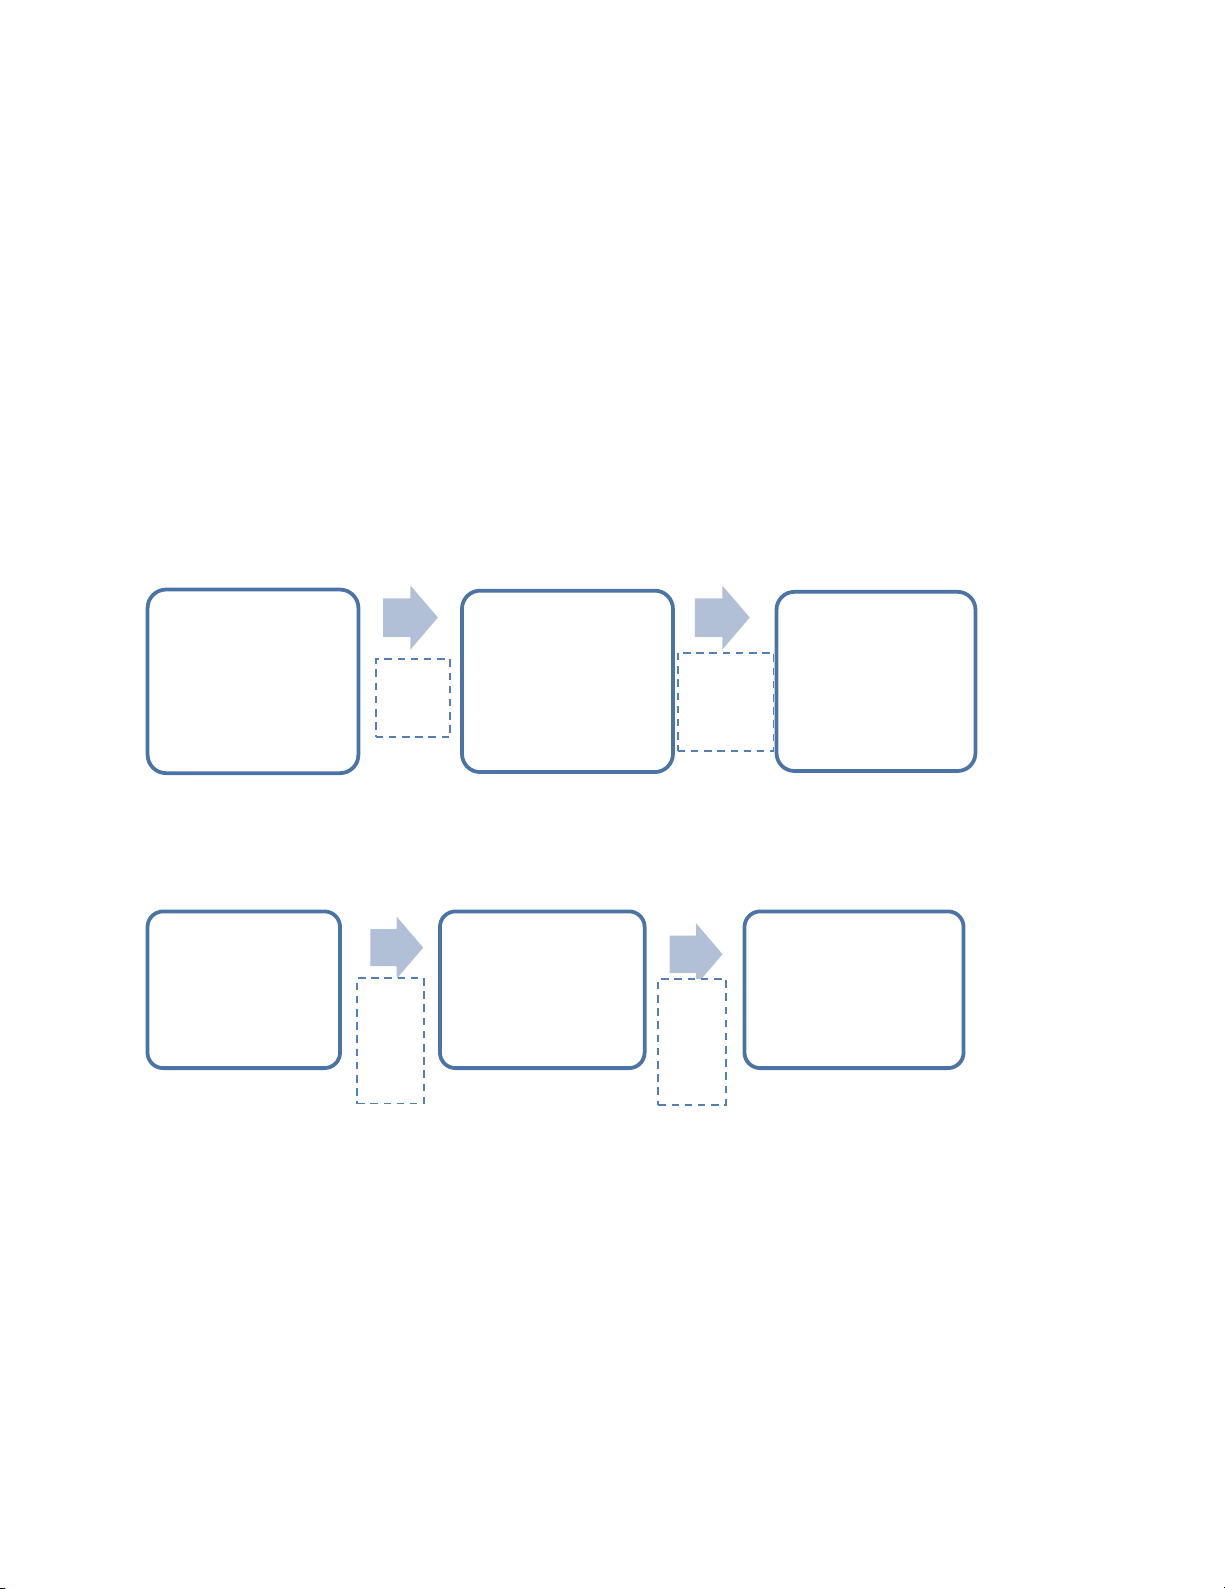
Following Parasuraman et al. (1994), the research structure consists of two stages as below:
Stage 1:
Stage 2:
Note: This exhibit indicates steps to solve research questions
Fig. 1. Research Structure
In stage 1, we identify customer expectations and determinants of customer satisfaction in debit card
services provided by CBs. According to SERVQUAL model raised by Parasuraman et al. (1985, 1988),
determinants that customers are likely to expect or care are chosen and then modified due to approach
of Fornell (1992). Thus, determinants that are initially considered to make debit card holding decision
consist of Service features, Price, Brand Image and Interaction. Each factor is selected from previous
researches. Al-Eisa and Alhemoud (2009), Jamal and Naser (2002) highlight that customers care
for procedures (referred to as progression of service delivery), time of service delivery, product
diversification, the distance between service providers and customers and service price. Matzler et al.
(2006), Varki and Colgate (2001), Seyedaliakbara et al. (2016) illustrate the vital effect of price on
Determinants that
customers likely to
expect/care as making
decision involved in
debit card services
Determinants that
customers actually
expect/care as making
decision involved in
debit card services
Determinants impact
on customer's
loyalty/disloyalty
decision involved in
debit card services
Customers'
demographic
characteristics
Determinants impact
on customer's
loyalty/disloyalty
decision involved in
debit card services
Differences in each
custome group's needs
of each determinant on
loyalty/disloyalty
involved in debit card
services
Logistic
regression
EFA
Summarize
Linear regression

244
customer perceptions. Levesque et al. (1996) divide prices of banking service into three categories such
as nominal interest rate written on the contract, negotiated interest rate except from nominal interest
rate or fees and penalty interest rate as breaching the agreement. Besides, firm’s brand image was found
to directly influence service quality according to customers (Nguyen & LeBlanc, 1998). Bank’s brand
image that is widely known and loved is likely to positively affect customer perceptions toward its
services (Che-Ha & Hashim, 2007). Last but not least, the fourth factor is the interaction between bank
officers and its customers, which represents equipment and facilities (Barber & Scarcelli, 2010), the
appearance of officers (Reimer & Kuehn, 2005), attitude and advisory capacity (Jamal & Naser, 2002).
After providing services, customer care services such as expressing bank’s deep gratitude to existing
customers, sending emails to customers regularly with useful information, etc. are proved to promote
customer sympathy (Ennew & Binks, 1999).
In stage 2, data of customer demographics (expressed on the top of the questionnaire) is coded. Then,
we use a linear regression model to analyze the relationship between the mentioned coded demographic
variables and significant determinants found in the first stage to examine the differences between each
customer group’s need and each feature involved in loyalty or disloyalty decision in debit card services.
The purpose of this stage is to learn more about different groups of customers, then recognize the target
customer group and propose appropriate plans to take care of them (Şchiopu, 2010; Nguyen, 2019).
Many demographic variables such as gender, age, education level, marital status, income were showed
the impact on customer behavior (Farokhi et al., 2016; Negeri, 2017).
3.2. Research sample
This paper uses a random sample encompassing 428 customers whose debit cards are issued by CBs
located in Hanoi, Vietnam. This sample size is adequate for conducting EFA and multiple regression
(Tabachnick & Fidell, 2007).
457 written survey questionnaires for gathering information were filled out directly by customers over
the period from December 2016 to June 2017. There were 428 responses meeting the requirement. The
survey questionnaire included 3 main parts: (i) customer information, (ii) Assessment the level of
importance of 23 determinants in making decision of using debit cards and (iii) customer’s future
decision of using debit cards. The second part uses the Likert scale with five-point scale that allows the
respondents to express how important they assess each factor.
3.3. Processing techniques
We analyze data through the descriptive statistics, exploratory factor analysis (EFA), and binary
logistic regression with SPSS 22. This study employs the Kaiser – Meyer – Olkin, the Bartlett’s test,
the Total variance Explained, Loading Factor (in Rotated Component Matrix), and Cronbach Alpha to
measure the adequacy and reliability of scales shown in Table 1. After that, we acquire FAC as
independent variable in Logistic Regression.
The Binary Logistic Regression model is given as below:
Log (p/1−p) =
+ β1X1 + β2X2 +.... + βnXn (1)
where: p denotes the probability of the event that customers increase their frequency of using debit
card. X1, X2... Xn represent FACs found after EFA. In order to assess the Logistic model fit, we test -2
Log likelihood indicator, sig. in Hosmer and Lemeshow Test. The Linear Regression model is given as
below:
Yi =
+ β1X1 + β2X2 +.... + βnXn + ei
(2)
where: Yi refers to as a significant FACi found through Logistic model. X1, X2... Xn represent variables
described in Table 2. ei refers to as a random error. In order to assess the model reliability, the value of
R square and the value of Durbin Watson were used.

T. H. L. Truong et al. /Uncertain Supply Chain Management 8 (2020)
245
Variables
Stage 1: The dependent variable is Loyalty that takes the value of 1 if customers increase their
frequency of using debit card and 0 otherwise. The underlying factor includes 23 determinants that
customers may appreciate as making debit card using decision.
Table 1
Underlying determinants in research model in stage 1
Scales Items Definition
Service features
Products The diversity of debit card products
Procedures Procedures the customers have to fulfill to active debit card
Balance Bank’s requirement of minimum balance on debit card account
Process The ease of payment transactions
Convenience The varied convenience provided by bank
Money safety The security of money on the account
Money availability The availability of money in the ATM
Privacy security The security of card holder’s personal information
Account security The security of card holder’s account
Network The point – of - sale network
Promotion The diversify and attraction of promotion programs
Brand image Reputation Bank has acquired high reputation
Fame Many customers have known bank’s brand image
Price
Opening fees Banks charge fees to open card
Transaction fees Banks charge fees to make transactions
Interest rate Interest rate that card holder earns on deposit balance account
Interaction
Product advice Bank officer’s advice on using products
Opening card advice Bank officer’s advice and assistance on opening card
Attitude Bank officer’s attitude in solving card problems
Solving time Time spent on solving card problems
Care The bank’s policy of caring customers
ATM ATM appearance and position
Branches Bank branch appearance and position
Note: This table describes underlying variables that are likely to be concerned by customers as they make debit card using decision. These variables were
collected from previous researches.
Stage 2: The dependent variables are those correlated with Customer Loyalty explored in stage 1. The
independent variables stem from 17 demographic characteristics of customer, then form 44 dummy
variables expressed as below:
Table 2
Demographic variables employed in stage 2
Variables Value
Gender Dummy (D) = 1 if customers are male; D = 0 if customers are female.
Occupation D = 1 if customers are students, running business, doing the housework, public servants; D = 0 otherwise.
Income D = 1 if monthly income stands “less than 5 million VND”, “from 5 to less than 10 million VND”; D = 0 otherwise
Age D = 1 if the age of customers is under 30 years old; D = 0 otherwise
Education D = 1 if customers hold a bachelor or master or doctoral degree; D = 0 otherwise
Technology preference D = 1 if “technology preference”; D = 0 if vice versa
Bank D = 1 if “BIDV”; “Vietinbank”; “Agribank”; “Vietcombank”, “DongAbank”; D = 0 otherwise
Time D = 1 if “under 1 year”, “from 1 to 3 years”; D = 0 otherwise
Purpose D = 1 if “cash withdrawal”, “pay for goods and services at stores”, “online shopping”, “check real time balance”; D
= 0 otherwise
Frequency D = 1 if “pay for goods and services with card more than that in cash”, D = 0 if vice versa
Payment value D = 1 if “the total payment value with card more than that in cash”; D = 0 if vice versa
Card preference D = 1 if “prefer card to cash”; D = 0 if vice versa
Provider change D = 1 if “readily change provider aiming at paying with card instead of paying in cash”; D = 0 if vice versa
Reasons to choose bank D = 1 if “family members’ bank”, “good reputation”, “spreading point of sale network”, “efficient customer service”,
“a wide variet
y
of
p
romotion
p
ro
g
rams”
,
“com
p
etitive
p
rice
p
olic
y
”
;
D = 0 otherwise
Channels to know bank card D = 1 if “traditional mass media such as television, newspaper, etc.”, “modern mass media such as social networks,
electronic media, etc.”, “advertisement/leaflets”, “ac
q
uaintances, friends”, “bein
g
bank’s existin
g
customer”; D = 0
Viewpoint of card D = 1 if “safe place for money”, “comfortable place for money”, “easy for payments”, “style of person having high
technology preference”; D = 0 otherwise
Awareness of card D = 1 if card refers to as “level”, “personality”, “unimportance”; D = 0 otherwise
Note: This table describes the ways we used to code demographic variables of survey sample. These variables are expected to correlate with determinants
that influence on customer loyalty in debit card services.


![Ngân hàng câu hỏi trắc nghiệm Lý thuyết Tài chính - Tiền tệ: Học phần [Mô tả thêm về nội dung học phần nếu có]](https://cdn.tailieu.vn/images/document/thumbnail/2025/20251003/kimphuong1001/135x160/26991759476043.jpg)

![Bài tập Tài chính doanh nghiệp có đáp án [kèm lời giải chi tiết]](https://cdn.tailieu.vn/images/document/thumbnail/2025/20250927/aimy1105nd@gmail.com/135x160/92021759119232.jpg)