
* Corresponding author. Tel.: +628129204067
E-mail address: endri@mercubuana.ac.id (E. Endri)
© 2020 by the authors; licensee Growing Science, Canada.
doi: 10.5267/j.dsl.2019.11.001
Decision Science Letters 9 (2020) 207–214
Contents lists available at GrowingScience
Decision Science Letters
home
p
a
g
e: www.Growin
g
Science.com/
d
sl
Delisting sharia stock prediction model based on financial information: Support Vector
Machine
Endri Endria*, Kasmir Kasmira and Andam Dewi Syarifa
aMasters in Management, Universitas Mercu Buana, Jakarta, Indonesia
C H R O N I C L E A B S T R A C T
Article history:
Received September 9, 2019
Received in revised format:
October 25, 2019
Accepted November 5, 2019
Available online
November 5, 2019
The purpose of this research is to develop an early warning system model that can anticipate the
occurrence of delisting of Islamic stocks (ISSI) using Support Vector Machines (SVM).
Financial variables used consist of debt to equity, return on invested capital, asset turn over,
quick ratio, current ratio, return on assets, return on equity, leverage, long term debt, and interest
coverage. The population of this study is 335 sharia shares registered at ISSI in the period 2012-
2017, with a total sample of 102 companies. The results show that the financial variables had a
predictive power to the occurrence of delisting of Islamic stocks in the ISSI index. The effect of
the independent variable or predictor variable is the financial ratio to the target variable or the
dependent variable that is the potential for delisting of Islamic stocks in the ISSI index. With the
development of 4 SVM models with different levels of prediction accuracy, SVM Model 1 with
an accuracy rate of 71.57%, SVM Model 2 with an accuracy rate of 72.55%, SVM Model 3 with
an accuracy rate of 82.35% and SVM Model 4 with an accuracy rate of 100%, it can be concluded
that the SVM Model 4 is the best model.
.
by the authors; licensee Growing Science, Canada 2020©
Keywords:
Delisting
Islamic stocks
Financial information
Support vector machines
1. Introduction
The capital market is part of the financial market that provides funding for companies for various investment activities of
the company. The capital market is also one way for companies to find funds by selling rights company ownership to the
community (Saqib, 2013). As an alternative to conventional capital market conditions which in some cases are not in line
with sharia principles, since July 3, 1997 Islamic stocks and screening of Islamic stocks in Indonesia produced ISSI
(Indonesia Sharia Stock Index) stock indexes. Stocks included in this index are the ones that meet the criteria for sharia
shares as determined by the National Sharia Board and the stock exchange. These criteria consist of quantitative and
qualitative criteria. In addition to the ISSI index, the Indonesia Stock Exchange also has another sharia index, JII (Jakarta
Islamic Index) where 30 of the best performing ISSI shares are included in this index (Firmansyah, 2017).
The expectation
of the public for the growth of companies incorporated in Islamic stock issuers is quite good and it is shown by the
capitalization of Islamic stocks continues to experience growth. Based on OJK statistical data in 2012, the total
capitalization of sharia shares by 2.4 trillion increased to 3.5 trillion, or by the end of 2017, an increase of 43% over
5 years. The number of Islamic shares continues to grow from 304 shares in 2012 to 359 shares in 2017 an increase
of 18% in just five years (OJK Statistics, 2017). The distribution of Islamic stock issuers is dominated by businesses
engaged in the Trade, Services and Investment sectors (25.65%), the Property, Real Estate & Construction sector
(16.71%), the Basic Industry and Chemical sectors (14.99%), Infrastructure, Utilities and Transportation sectors
(10.09%) and other sectors each under 10% (OJK Road Map, 2016-2019).
Over the last five years there has been an
increase in the number of stocks of sharia in line with an increase in the number of companies conducting a public
offering of stock as well as an increase in issuers whose stock meet the criteria as Islamic stock. Some companies
experience delisting from the Indonesian Shariah Stock Index (ISSI). Recorded in the Indonesia Stock Exchange
report from 2012 - 2017 there are hundreds of stocks that have been delisted from ISSI where stocks that have been

208
delisted in each semester range between 15-30 firms. Every semester there are new stocks that enter and old ones
which are excluded from the Indonesian Islamic stock index. The composition of sharia stock continues to change, in
the past five years there have been 249 new stocks accumulated or 74% of total sharia stocks and there are 220 shares
that have been delisted from ISSI from total sharia stocks. This number is quite significant and opens up the possibility
of an upward trend in the coming semesters that the number of stocks that will be delisted from the Indonesian Islamic
stock index will be even higher.
There are some previous studies on stock delisting. In general, companies experience delisting due to failure to meet
quantitative criteria set by the exchange such as company size, trading volume, number of shareholders, and meeting
qualitative criteria such as corporate governance and protection against bankruptcy threats (Witmer, 2008) (
Fungáčová
& Hanousek
, 2011; Yiannoulis, 2016). There are several previous studies that have tested the accuracy of Zhou (2013)
delisting prediction model with Linear Discriminat Analysis (LDA) models achieving an accuracy value of 96.36%
and for Neural Network (NN) models with a level of accuracy of 81.13%,
Khemais
et al. (2016) using the Logistic
Regression (LR) model with an accuracy level of 97.70 and Hwang et al. (2014) Logistic Regression with prediction
accuracy of 84.44%.
There is a change in the composition of sharia stock on a regular basis in the Indonesian sharia stock index due to the large
number of sharia stocks that have been delisted or excluded from the sharia stock index. The occurrence of stock delisting
is a risk for stock investors who wish an investment form that is in accordance with sharia. Based on the background that
has been explained, this research seeks to find the best model in terms of accuracy in predicting the potential for delisting
of Islamic stocks so that it can be known which Islamic stocks are not performing well and have a tendency to experience
delisting so that they can be avoided and the indexed is only limited to qualified stocks which are not affected by delisting
risk.
2. Literature review
2.1. Early warning system
Early Warning System (EWS) is a series of systems that function to notify the occurrence of an event, which can be a natural
or social event. Early warning activities provide information in an easily understood language (Duwipa, 2013). Signal
models can be considered as a form of trend analysis, hence EWS is a development of the form of signal theory. The EWS
model was originally developed to anticipate economic crises as research conducted by Kaminsky and Reinhart (1999),
Kaminsky et al. (1998), Berg and Patillo (1999), and Berg et al. (2004). In general, previous studies used probit and logit
models in the development of EWS.
2.2. Signaling theory
Signal Theory was expressed by Ross (1977) and states that company management is benefited from the information they
have and given to investors. The information is mainly related to company performance that reflects the prospects in the
future to raise the company's stock price. Information is an important tool for investors and information can be known about
the current state of the company, past, or even the company's future prospects. The information that is available must be
relevant, accurate, timely and complete and must be transferred by investors as an analysis tool in investment decisions in
the capital market. Through the publication of information or information that is announced in the media investors may get
a bad or good signal for their investment decision efforts (Endri, 2016). The volume of stock trading will reflect the market's
reaction. The company has better expectations in the future, if there is a good signal in the information submitted. The
impact to attract investors in trading shares. This is reflected in changes in stock trading volume where the market reaction
is positive. Market efficiency will show the relationship between published information related to information in the form
of financial, political, environmental and social reports on fluctuations in the volume of stock trading (Endri et al., 2019).
2.3. Delisting stocks
Fungáčová & Hanousek
(2011) explained delisting in general as the issuance of a stock in an index or list of certain stocks.
There are two types of delisting namely voluntary delisting and involuntary delisting. In voluntary delisting of a company
intentionally or at their own request, removing the shares from the capital market index or the stock market is executed. In
this case the company decides to change the form of a company from a publicly listed company or Go Public to a Limited
Company. The decision to withdraw company’s shares from the stock index must be taken in a shareholders' meeting which
where a minimum of 75% of the total shareholders must participate in such meeting. While in involuntary delisting or also
called compulsory delisting that is the issuance of a stock from the market index capital it is not based on the decision of
the issuing company. The decision to exclude a company's shares from the stock index is taken by the capital market
authorities based on established regulations (Bakke et al., 2012).
2.4. Support vector machine
Support Vector Networks, also known as SVMs, are supervised learning models that are associated with learning algorithms
(Learning Algorithms) used in data analysis by classification and regression (Cortes & Vapnik, 1995). While Olson and
E. Endri et al.
/ Decision Science Letters 9 (2020)
209
Delen (2008) define SVMs as Supervised Learning Methods or supervised learning methods that produce input-output
mapping functions (Input-Output Mapping Function) taken from exercise data that has been labeled. Mapping conducted
by SVM is divided into two namely 1) a classification function that is useful for making categorization of data, 2) a
regression function that is useful for estimating certain data.
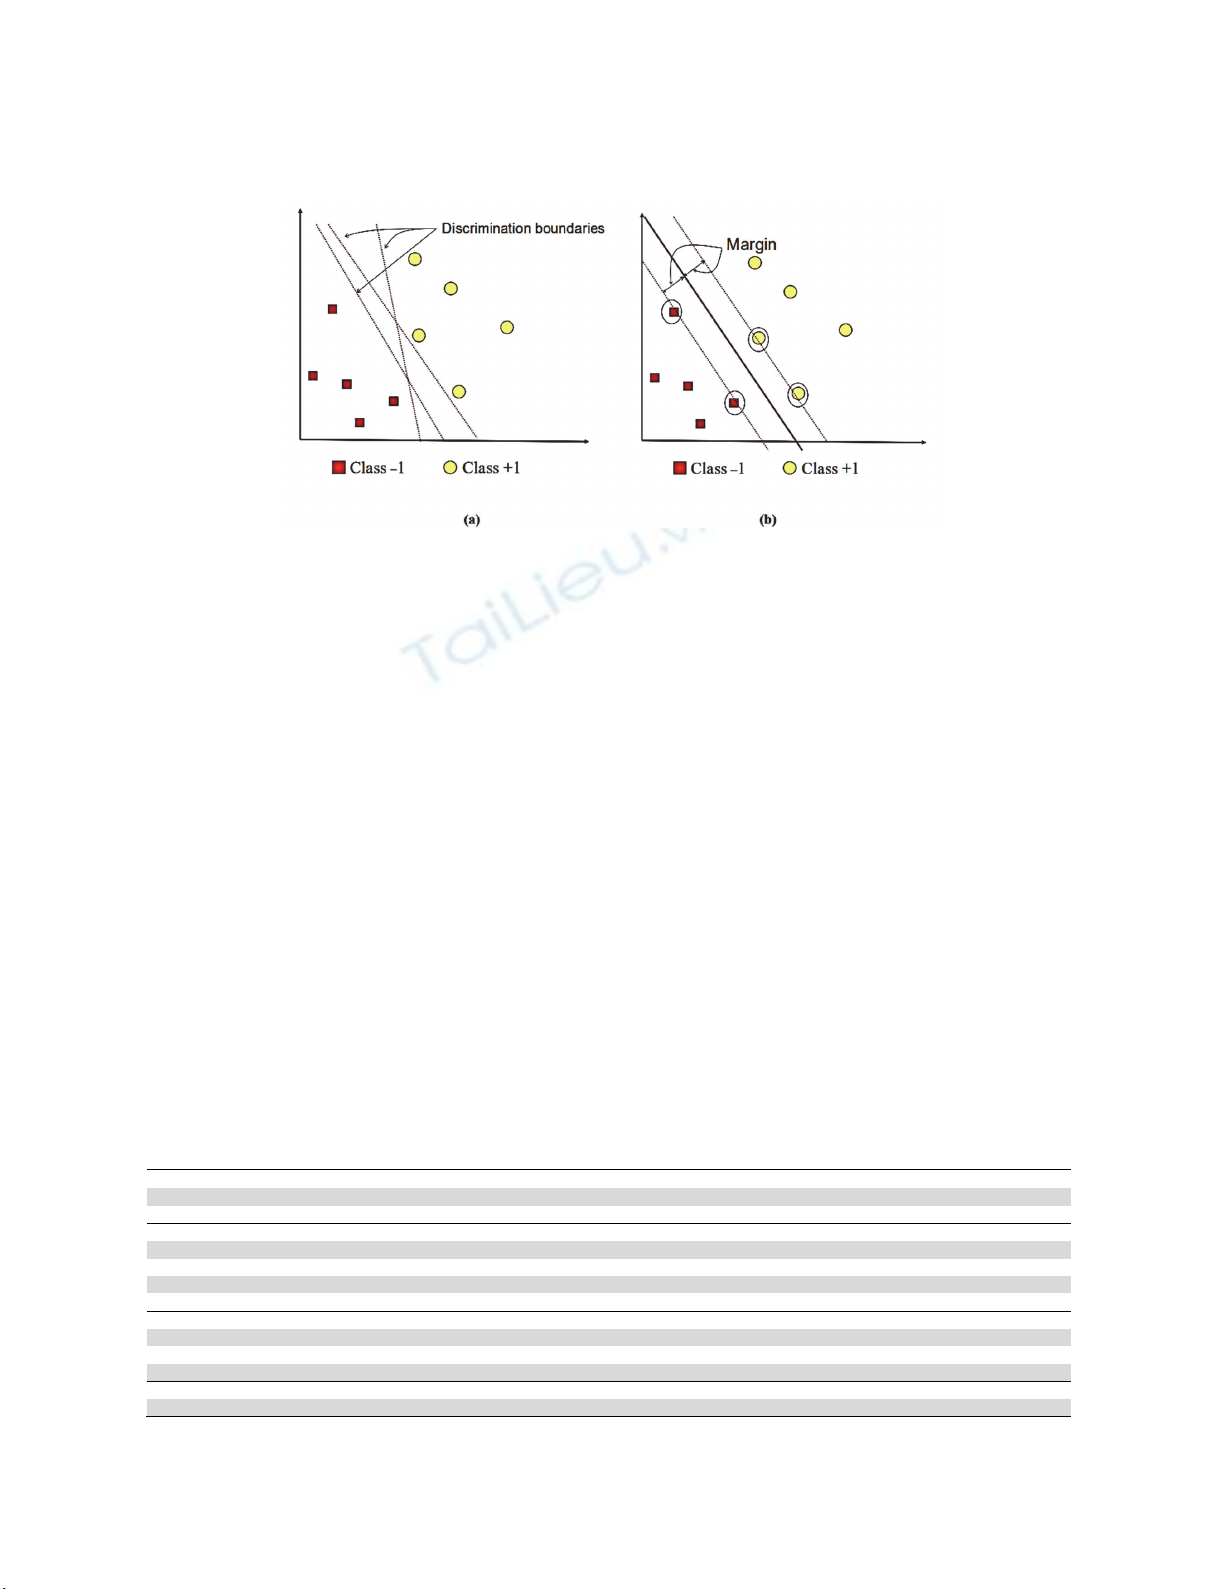
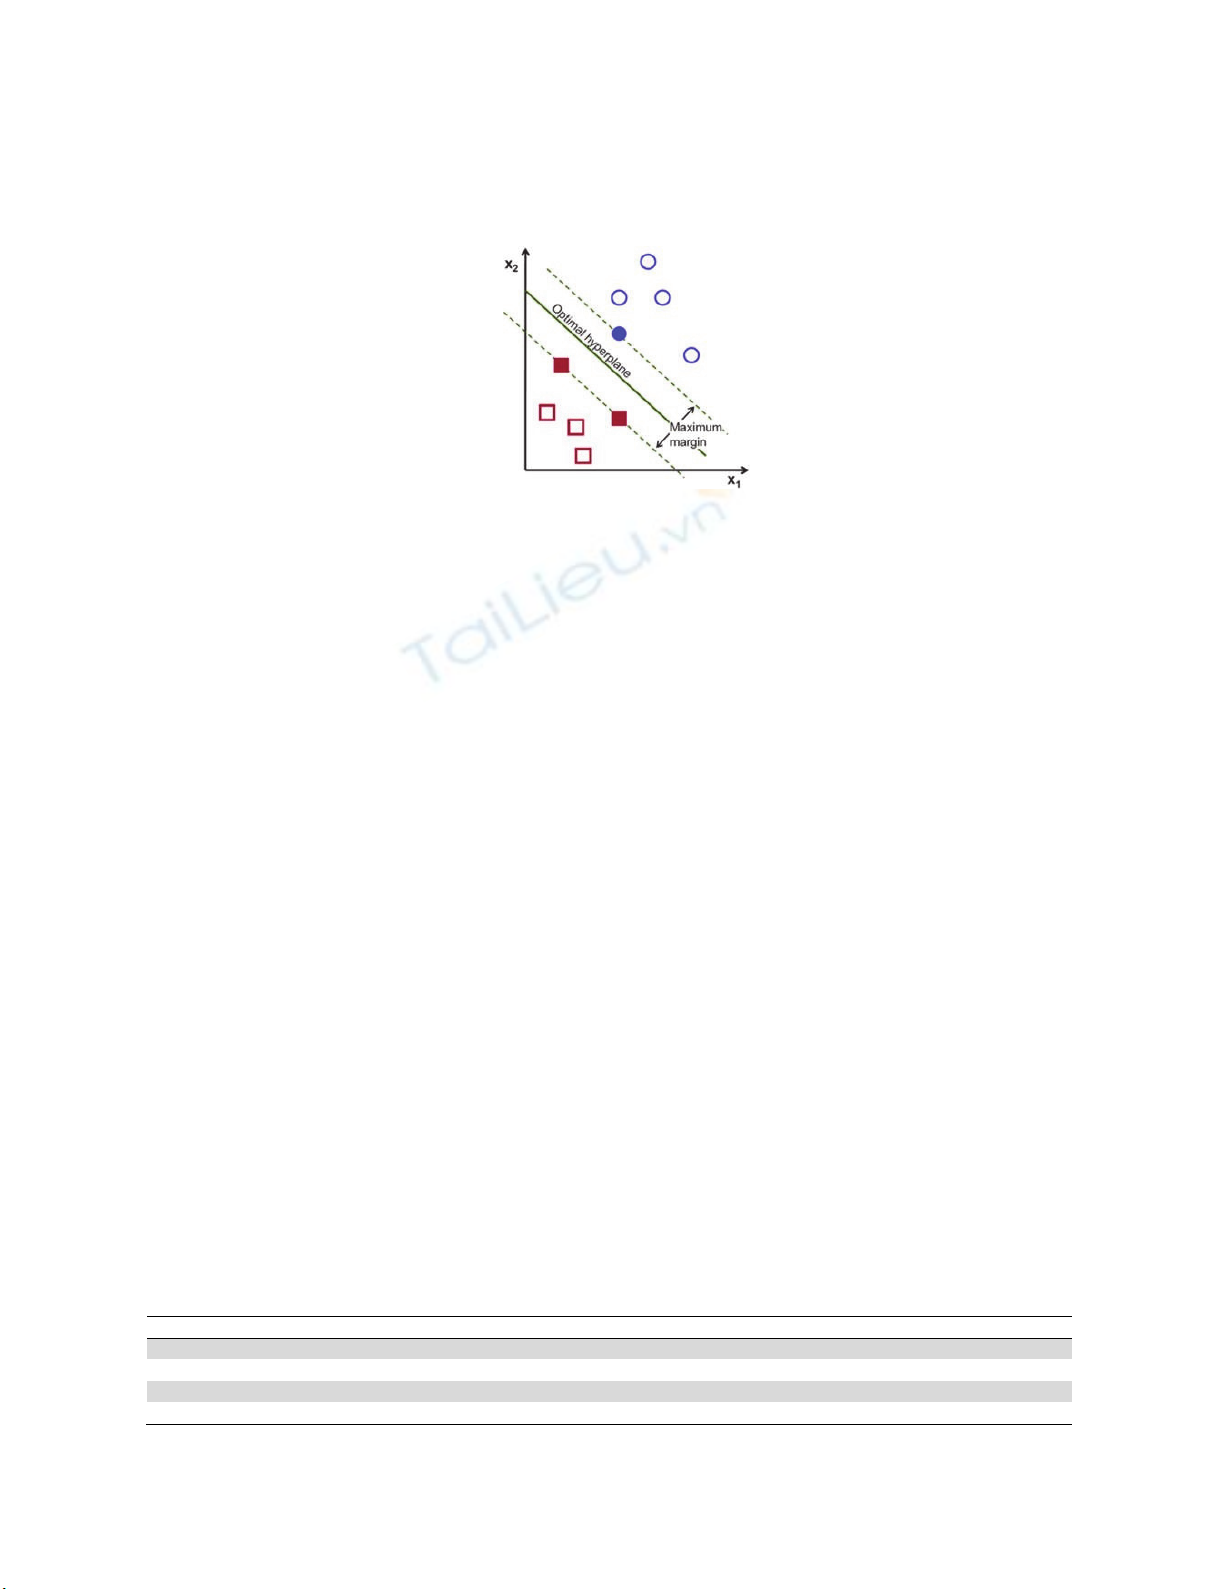
Fig. 1. HyperPlane Function
According to Anwar (2015) SVMs were first developed by Corter and Vapnik in 1995. The SVMs model implements
structural risk minimization which seeks to reduce the level of error, and generalization, namely the ability to obtain a small
degree of error in the test data. The concept of SVM can be simply explained as an effort to find the best hyperplane where
the hyperplane functions as a separator of two classes in the input space. As we can observe from Fig. 1, there are two
classes namely +1 and -1. In class -1 the pattern uses the red square symbol and the pattern in class +1 uses the yellow circle
symbol. The problem solved in the SVMs algorithm is to resolve class +1 and class -1 by finding the best hyperplane or
separator. There are several dividing lines called Discrimination boundaries where the algorithm looks for the best dividing
line or hyperplane.
3. Methodology
For this study, the population used includes all companies listed on the Indonesia Stock Exchange (IDX) and the Indonesian
Sharia Stock Index (ISSI) and they are entered into Islamic stock issuers from 2012 to 2017. The method of “Purposive
Judgment sampling” is a sample selection based on the evaluation of some characteristics of members of the population
adjusted to the objectives of the study (Kuncoro, 2003: 119). The sample used is Islamic stock issuers consisting of issuers
excluded from the ISSI (Delisted) index. In addition, as a comparison to delisted companies only the information of the
companies used that are still registered with ISSI. This study uses secondary data that is data obtained indirectly in the form
of Annual Report or annual financial reports taken from the ISSI Indonesia Stock Exchange data over the period 2012 -
2018.
3.1. Dependent variable
The independent variables are used for prediction in research and it is dummy variable which receives the value of one (1)
for listing or zero which means the firm is delisted. The following also describe the dependent variables,
Dependent variable
Liquidity Ratio
X1 Current Ratio
Current Asset / Current liabilities
X2 Quick Ratio
Current Asset - Inventory / Current liabilities
Solvability Ratio
X3 Total Debt to Total Assets Ratio
Total Debt / Total Asset
X4 Debt to Equit
y
Eatio
Total Debt / Total Equit
y
X5 Interest Covera
g
e
EBIT/Interest Expense
X6 Long Term
Long Term Debt/Total Asset
Rentability Ratio
X7 Return on Asset
EAT / Total Asset
X8 Return on Equity EAT/ Equity
X9 Rerturn on Invested Capital EAT/ Invested Capital
Activity Ratio
X10 Asset Turnover
Sales / Total Asset
210
3.2. Support Vector Machines (SVMs)
Support vector machine is a data analysis method that can be simply explained as an effort to find the best hyperplane
where the hyperplane functions as a separator of two classes in the input space (
Byun & Lee, 2003).
According to
Tsuda (2000),
SVM support can be used to make predictions both using regression and classification.
According to Anwar (2015), the ability of SVMs is denoted by the equation:
𝑦= 𝑤𝜙𝑥+𝑏
where
𝑦 Scalar quantity
𝜙𝑥 Space feature of x input
𝑤 Estimated value of the coefficient with the principle of structural risk minimization
The following are the steps in the analysis of Support Vector Machines (SVMs).
1.
Variable Input
These variables include x1 = ROA (Return of Assets) x2 = ROE (Return of Equity), x3 = Leverage, x4 = Debt to Equity,
x5 = Growth, x6 = Liquidity Ratio, x7 = Share Liquidity, x8 = Asset Turn Over, x9 = NWCTA, x10 = Firm Size
2.
Determination of Variable Type
Determine the type of variable both the input variable and the output variable where the input variable is the ratio
data type or continuous data and the output variable is the category data type.
3.
Perform analysis and predictions
At this stage the input data will be obtained using the Support Vector Machines algorithm to produce a prediction
model that determines the type of Kernel used in SVMs, the number of support vectors used and the support
vector class used.
4.
Evaluate Model Accuracy
Namely evaluates the accuracy of the SMV model by comparing the actual data and the predicted results
generated by the analysis. From the comparison between the predicted value and the actual data, the accuracy
level of the model will be obtained in the form of a match between the prediction and the actual data.
The application used for analysis using Support Vector Machine is Statistica Software Version 12 which is classified as a
Data Mining method.
5.
Findings
In developing the delisting prediction model on ISSI sharia stock using the Support Vector Machine (SVM) model, four
models were developed. Each model is grouped based on differences in SVM Type, capacity, kernel Type, Number Support
Vector and Support Vector per Class.
Table 1
Type of SVM Model
Model SVM T
yp
e Kernel T
yp
e See
d
1 Classification T
yp
e 2 Linea
r
2000
2 Classification T
yp
e 1 Radial Basis function 1000
3 Classification T
yp
e 2 Linea
r
1500
4 Classification T
yp
e 1 Radial Basis function 2000

E. Endri et al. / Decision Science Letters 9 (2020)
211
5.1 Results of SVM Model Development
From the four SVM models developed based on test and training, testing the accuracy of the predictions of each model will
be conducted to choose the best SVM model.
5.1.1 SVM-1 Model
This is performed using Classification Type 2, Capacity 10, Linear Type kernel (nu = 0.700) with nu = 0.100, Number
Support Vector 59 with 54 bounded and support vector per class = 30 in class (0), 29 in class (1).
Table 2
The results of SVM-1 model
Model SVM 1 Value Trainin
g
Test Overall
-1.9890 75.31% 57.14% 71.75%
From Table 2 it is known that the SVM 1 model has a Value of -1.9890, with a level of accuracy or performance in a training
session of 75.31% the level of accuracy or performance in a training session is 57.69% and an overall or overall performance
of 72.55%.
5.1.2 SVM-2 Model
This is performed using Classification Type 1, Capacity 10, kernel Type Radial Base Function with Gamma = 0.100,
Number Support Vector 50 with 46 bounded and support vector per class = 25 in class (0), 25 in class (1).
Table 3
The results of SVM-2 model
Model SVM 2 Value Trainin
g
Test Overall
-1.5863 77.63% 57.69% 72.55%
From Table 3 it is known that the SVM 2 model has a Value of -1.5863, with an accuracy or performance level in the
training session of 77.63%, an accuracy or performance level in the training session of 57.69% and an overall or overall
performance of 72.55%.
5.1.3 SVM-3 Model
This is performed using Classification Type 2, Capacity 10, Linear Type kernel with nu = 0.500, Number Support Vector
42 with 34 bounded and vector support per class = 22 on class (0), 20 on class (1).
Table 4
The results of SVM-3 model
Model SVM 3 Value Trainin
g
Test Overall
-7.6058 85.53% 73.08% 82.35%
From Table 4 it is known that the SVM 3 model has a Value of -7.6058, with an accuracy or performance level at a training
session of 85.53%, an accuracy or performance level at a training session of 73.08% and an overall or overall performance
of 82.35%.
5.1.4 SVM-4 Model
This is performed using Classification Type 1, Capacity 10, kernel Type Radial Base Function with Gamma = 0.100,
Number Support Vector 50 with 46 bounded and support vector per class = 25 in class (0), 25 in class (1).
Table 5
The results of SVM-4 model
Model SVM 4 Value Trainin
g
Test Overall
-1.5863 77.63% 57.69% 72.55%
From Table 5 it is known that the SVM 4 model has a Value of -1.5863, with an accuracy or performance level at a training
session of 77.63%, an accuracy or performance level at a training session of 57.69% and an overall or overall performance
of 72.55%.
5.2 Prediction results using the SVM Model
The following will describe the accuracy of the results of each model's predictions by comparing the predicted values with
the actual data so that the accuracy level is measured based on the percentage ratio between the number of matches or
correct with the total amount of data and likewise the level of error or incorrect.
![Sổ đăng kí thành viên góp vốn trong doanh nghiệp [Chuẩn nhất]](https://cdn.tailieu.vn/images/document/thumbnail/2019/20190620/nguyenyenyn117/135x160/9321561012939.jpg)


![Đề thi Tài chính cá nhân kết thúc học phần: Tổng hợp [Năm]](https://cdn.tailieu.vn/images/document/thumbnail/2025/20251015/dilysstran/135x160/64111760499392.jpg)


![Câu hỏi trắc nghiệm và bài tập Thị trường chứng khoán [mới nhất]](https://cdn.tailieu.vn/images/document/thumbnail/2025/20251001/kimphuong1001/135x160/75961759303872.jpg)