
TNU Journal of Science and Technology
229(06): 195 - 201
http://jst.tnu.edu.vn 195 Email: jst@tnu.edu.vn
STUDY OF DETECTION OF MELAMINE VIA SURFACE-ENHANCED
RAMAN SCATTERING METHOD BASED ON SILVER NANOPARTICLES
Tran Thu Trang *
TNU - University of Sciences
ARTICLE INFO
ABSTRACT
Received:
01/4/2024
Silver nanoparticles (Ag NPs) were synthesized and characterized by
transmission electron microscopy (TEM), X-ray powder diffraction
(XRD), and absorption spectroscopy. Using Debye-Scherrer’s formula
and the result of the XRD spectrum, the size of the Ag NPs was
estimated at approximately 8 nm. The fabricated silver nanoparticles
were used to perform surface-enhanced Raman scattering (SERS) for
detecting melamine. The SERS mechanism was discussed and
indicated that electromagnetic enhancement played an important role;
the contribution of chemical enhancement could be ignored due to the
out-of-charge transfer resonance between Ag NPs surface and
melamine molecules. The SERS activity of Ag NPs substrate in
probing melamine was examined with a variety of concentrations
ranging from 1.5×10⁻³ to 10-7 M. The SERS spectra of melamine
molecules presented a good sensitivity with a limit of detection of 10-7
M, corresponding to an enhancement factor (EF) of 2×10⁵. The results
show quite high sensitivity for probing melamine.
Revised:
23/5/2024
Published:
24/5/2024
KEYWORDS
Silver nanoparticles
Melamine
Surface-enhanced Raman
scattering
Electromagnetic enhancement
Chemical enhancement
NGHIÊN CỨU PHÁT HIỆN MELAMINE QUA PHƯƠNG PHÁP
TĂNG CƯỜNG TÁN XẠ BỀ MẶT RAMAN DỰA TRÊN ĐẾ HẠT NANO BẠC
Trần Thu Trang
Trường Đại học Khoa học - ĐH Thái Nguyên
THÔNG TIN BÀI BÁO
TÓM TẮT
Ngày nhận bài:
01/4/2024
Hạt nano bạc (Ag NPs) được tổng hợp và phân tích các đặc trưng bằng
phương pháp hiển vi điện tử truyền qua (TEM), nhiễu xạ tia X (XRD),
và phổ hấp thụ. Sử dụng công thức Debye-Scherrer và phổ XRD, kích
thước hạt nano bạc được đánh giá khoảng 8 nm. Hạt nano bạc được sử
dụng làm đế tăng cường tán xạ Raman (SERS) để phát hiện melamine.
Cơ chế SERS trên đế Ag NPs phát hiện melamine được thảo luận và chỉ
ra cơ chế SERS là do cơ chế tăng cường điện từ trường. Sự đóng góp
của cơ chế hóa học trong tăng cường tín hiệu SERS có thể được bỏ vì
không trong dải cộng hưởng truyền điện tử giữa Ag NPs và melamine.
Khả năng hoạt động của đế SERS trên cơ sở Ag NPs để phát hiện
melamine được nghiên cứu trong dải nồng độ từ 1.5×10⁻³ đến 10-7 M.
Phổ Raman trên đế SERS của melamine chỉ ra độ nhạy cao với giới hạn
phát hiện đạt 10-7 M, ứng với hệ số tăng cường 2×10⁵. Kết quả nghiên
cứu chỉ ra sử dụng đế SERS trên cơ sở Ag NPs để phát hiện melamine
có độ nhạy tương đối cao.
Ngày hoàn thiện:
23/5/2024
Ngày đăng:
24/5/2024
TỪ KHÓA
Hạt nano bạc
Melamine
Tăng cường tán xạ bề mặt
Raman
Tăng cường điện từ
Tăng cường hóa học
DOI: https://doi.org/10.34238/tnu-jst.10008
Email: trangtt@tnus.edu.vn

TNU Journal of Science and Technology
229(06): 195 - 201
http://jst.tnu.edu.vn 196 Email: jst@tnu.edu.vn
1. Introduction
Melamine is a heterocyclic organic compound containing a triazine ring and high nitrogen
content. It is widely used to produce amino resins, plastic, and fertilizers in the industry [1], [2].
Due to its low cost and high nitrogen content, it is often illegally added to dairy products for
infants and many other food products. This action can cause a great hidden danger to people’s
food safety [3], [4]. Some different methods have been developed and explored to detect
melamine in milk, such as gas chromatography [5], and liquid chromatography [6]. Surface-
enhanced Raman scattering (SERS) is a powerful tool for ultrasensitive surface chemical analysis
[7], [8]. Using the SERS technique to detect melamine has been implemented based on various
surfaces, such as ZnO [9], and Au nanoparticle-decorated ZnO/ZnFe2O4 composites [10].
Noble metal materials have been widely explored as conventional materials for SERS thanks
to advantages such as high sensitivity, stability, and reproducibility [11]. Surface plasmon
resonance (SPR) is known to play a primary role in the SERS mechanism in metal materials. On
the other hand, the chemical enhancement, which is well-known with the charge transfer
mechanism, is a minor contribution to SERS activities. For metal nanoparticles, the plasmon
resonance is localized near the surface of the particles, and it results in considerably larger
enhancement through aggregates of two or more nanoparticles oscillating collectively [12]. The
range of localized surface plasmon effects of silver nanoparticles has been extended throughout
the visible and near-infrared of the spectrum, implying that the vibrating molecule located near a
metal nanoparticle would be better coupled with the exciting light. It is attributed to the high
activity of SERS surfaces based on metal nanoparticles. Silver nanoparticles (Ag NPs) have been
used as an effective SERS surface for detecting various analytes [13], [14].
In this report, the SERS based on Ag NPs for probing melamine molecules was investigated.
The SERS mechanism was indicated as having a significant role in surface plasmon resonance
under incident laser excitation. The contribution of the charge transfer mechanism could be
ignored due to the out-of-charge transfer resonance between the energy levels of the melamine
molecule and Ag NPs. Furthermore, the SERS sensitivity and repeatability activities based on Ag
NPs were also studied and presented the good behaviors with a limit of detection (LOD) of 10-7
M, which corresponds to the highest enhancement factor (EF) of 2.105.
2. Materials and methods
2.1. Materials
Silver nitrate (AgNO3, 99.92%) was used as a silver precursor; sodium borohydride (NaBH4,
99,9%) acted as both reducing and capping agents. Trisodium citrate dihydrate (TSC, 99%) was
also used as a reducing chemical; and polyvinyl pyrrolidone (PVP) was used as a stabilizer.
2.2. Synthesis of silver nanoparticles.
The colloidal silver nanoparticles (Ag NPs) were synthesized through the reduction process of
the of the silver precursor AgNO3 in the presence of NaBH4. The synthesis of colloidal AgNPs
began with a simple aqueous phase mixture of AgNO3 and TSC, PVP, and NaBH4 solutions [15].
Briftly, a mixture of 4 mL of AgNO3 concentration of 0.02 M, 400 µl TSC 0.6 M, 200 µL PVP
0.03 M, and 400 µL deionized water was mixed and stirred at room temperature for 15 minutes.
After that, 1600 µL of NaBH4 was injected into the mixture. Finally, 400 µL of NaOH 1 M was
added to the mixture. Then, the total solution was stirred for 15 minutes. The obtained solution
was used to prepare the SERS surface to detect melamine.
TNU Journal of Science and Technology
229(06): 195 - 201
http://jst.tnu.edu.vn 197 Email: jst@tnu.edu.vn
2.3. Characterizations
The morphology of the obtained Ag NPs was examined using transmission electron microscopy
(TEM). The crystallinity of Ag NPs was investigated by X-ray powder diffraction (XRD) using
monochromated Cu-Ka radiation (wavelength of 0.154056 nm) on the Bruker D8 Advances
diffractometer (Germany). The absorption property of Ag NPs was recorded using a UV-Vis
spectrometer (Jascco V-770). The investigation of normal Raman and SERS spectra was
implemented on a Raman spectrometer (Raman Horiba Xplora plus microprobe, France). A laser
with a wavelength of 532 nm was used for laser excitation. The acquisition time for each
measurement was kept identical at 8 seconds. The calibration for the spectrometer was done using a
silicon wafer with the characteristic band at 520 cm-1. The various concentrations of melamine were
prepared by diluting melamine powder in aqueous. The five SERS substrates based on Ag NPs with
concentrations of melamine ranging from 1.5×10⁻³ M to 10-7 M were investigated. At such
melamine concentrations, SERS intensities showed linear changes with concentration, and it was
also the lowest concentration that could be clearly detected. In practice, each SERS surface was
prepared with 100 µL of Ag NPs and 15 µL of melamine at each concentration.
3. Results and discussion
3.1. Morphological study of Ag NPs
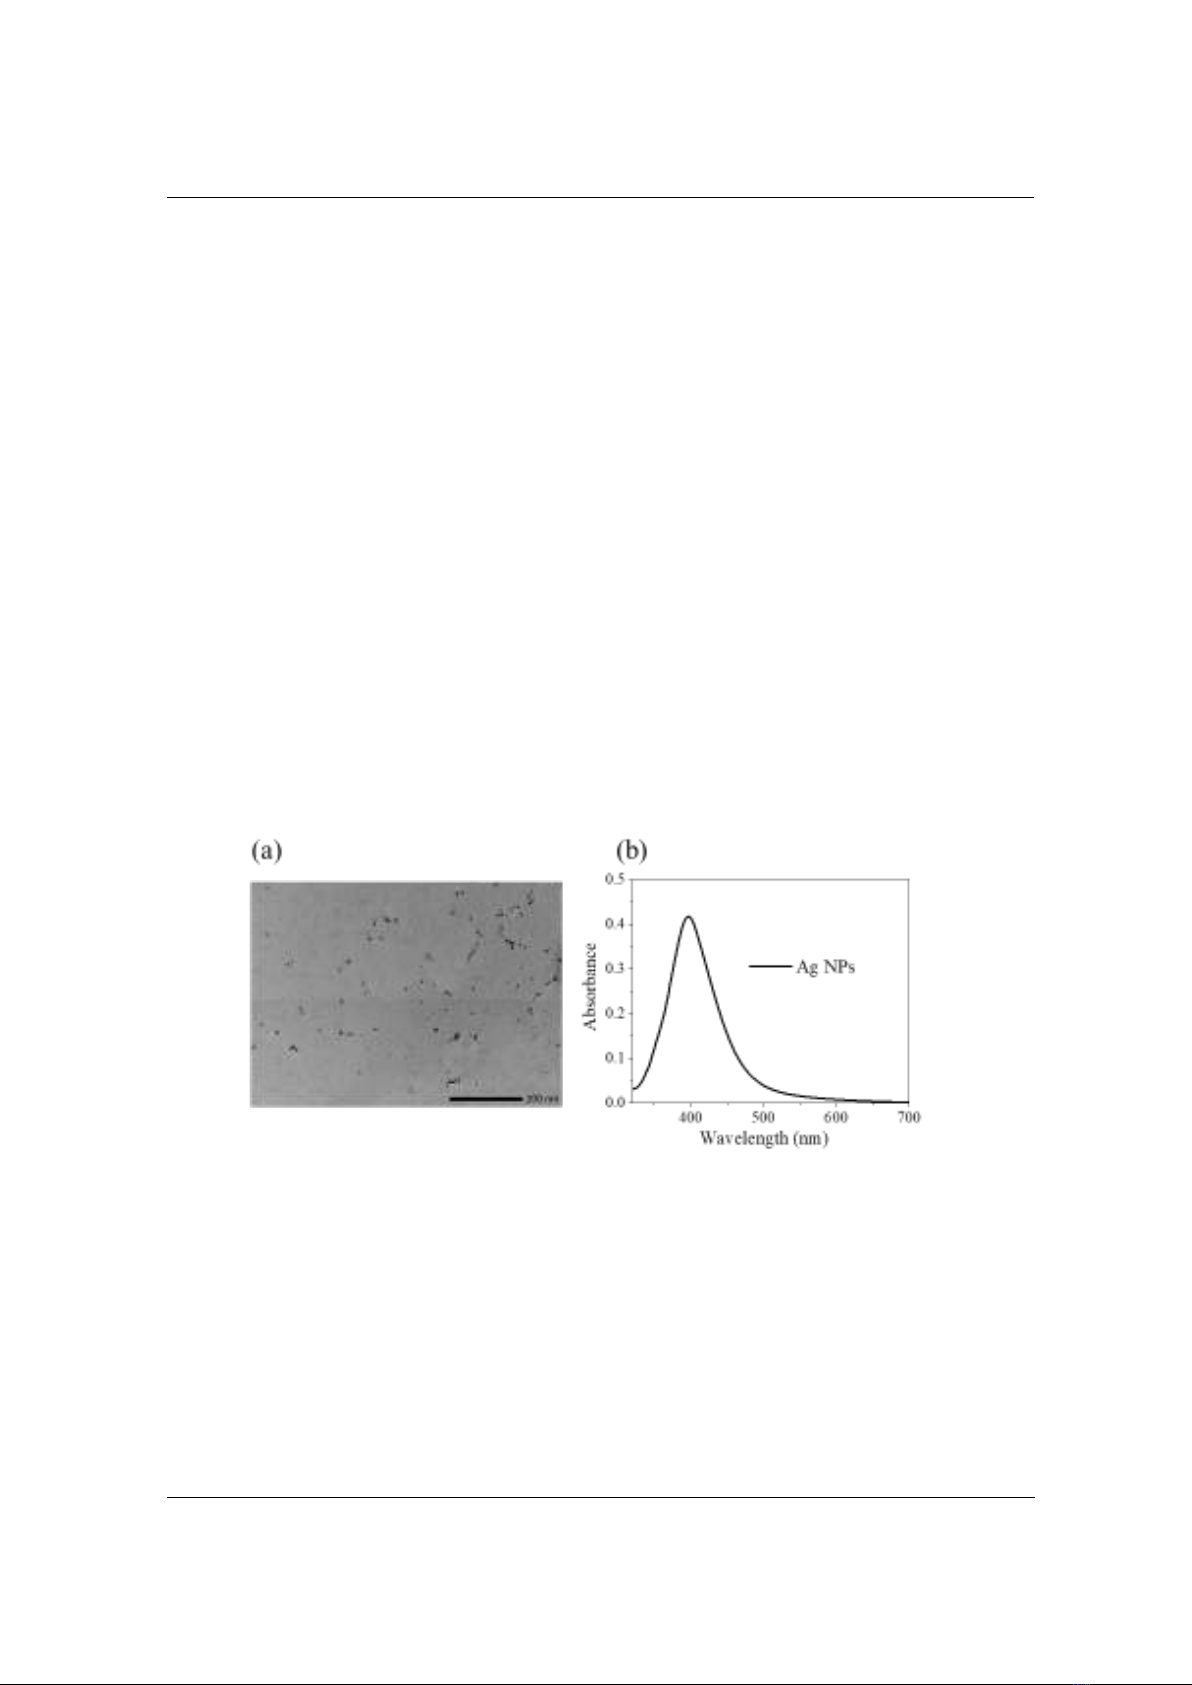
The shape of synthesized Ag NPs was imaged using TEM spectroscopy. Figure 1a shows the
TEM image of Ag NPs that are well-separated and spherical in shape. The absorption spectrum
of Ag NPs indicates a characteristic band at 397 nm (Figure 1b). It is noted that the localized
surface plasmon band reveals the figure’s size and shape. The absorption property of Ag NPs at
about 397 nm has contributed to the size of ~ 8 nm [16].
Figure 1. (a) TEM image and (b) absorption spectrum of Ag NPs
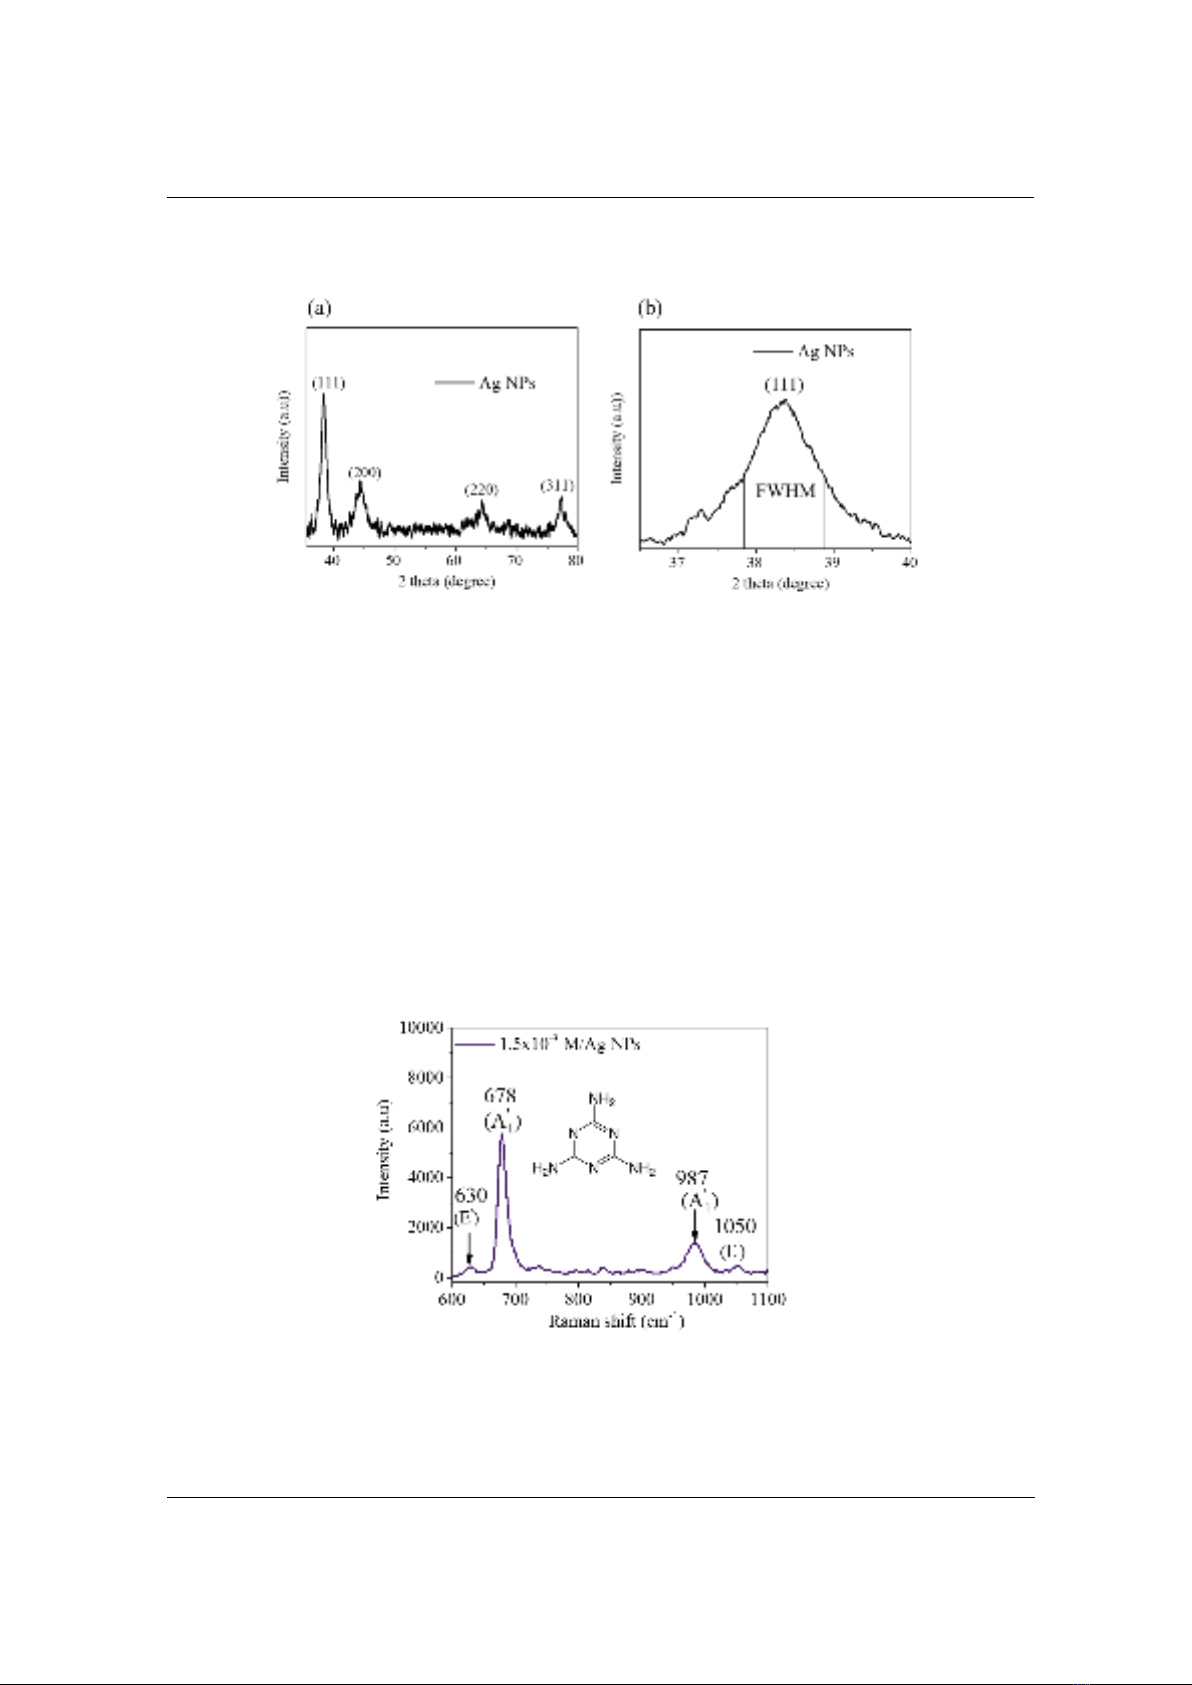
To gain a better understanding of the morphology of Ag NPs, the XRD spectrum of
synthesized Ag NPs was measured. Figure 2a describes the XRD spectrum of Ag NPs. Five
distinguishing peaks at 38.300, 44,350, 63.150, and 77.400 correspond to the reflections of (111),
(200), (220), and (311) Bragg crystal planes of the face-centered-cubic (FCC) Ag phase,
respectively. It is consistent with the standard data file ICDD (International Centre for Diffraction
Data) no. 01-071-3752. Furthermore, the diffraction peak positions can be used to determine the
mean crystallite size of Ag NPs using Debye-Scherrer’s formula:
D = k/(cosθ)
(1)
In which, D is the size of Ag NPs, k is the shape factor, and for spherical NPs, it was taken of
0.89; l is the X-ray wavelength for Cuka; b is the line broadening; it is taken of the full width at half
the maximum intensity (FWHM); and θ is the angle achieved from the 2θ value in the XRD pattern.
TNU Journal of Science and Technology
229(06): 195 - 201
http://jst.tnu.edu.vn 198 Email: jst@tnu.edu.vn
It has been found that peak broadening is inversely proportional to the size of the NPs [17]. In this
study, the mean crystallite size of Ag NPs was estimated at approximately 8 nm. This is reasonable
given the characteristic of the localized surface plasmon band at 397 nm of Ag NPs [18].
Figure 2. (a) XRD pattern of Ag NPs, and (b) zoom in diffraction peak (111)
for estimation of crystalline size of Ag NPs
3.2. SERS study for the detection of melamine on Ag NPs surface
3.2.1. Study SERS mechanism based on Ag NPs surface in detection of melamine
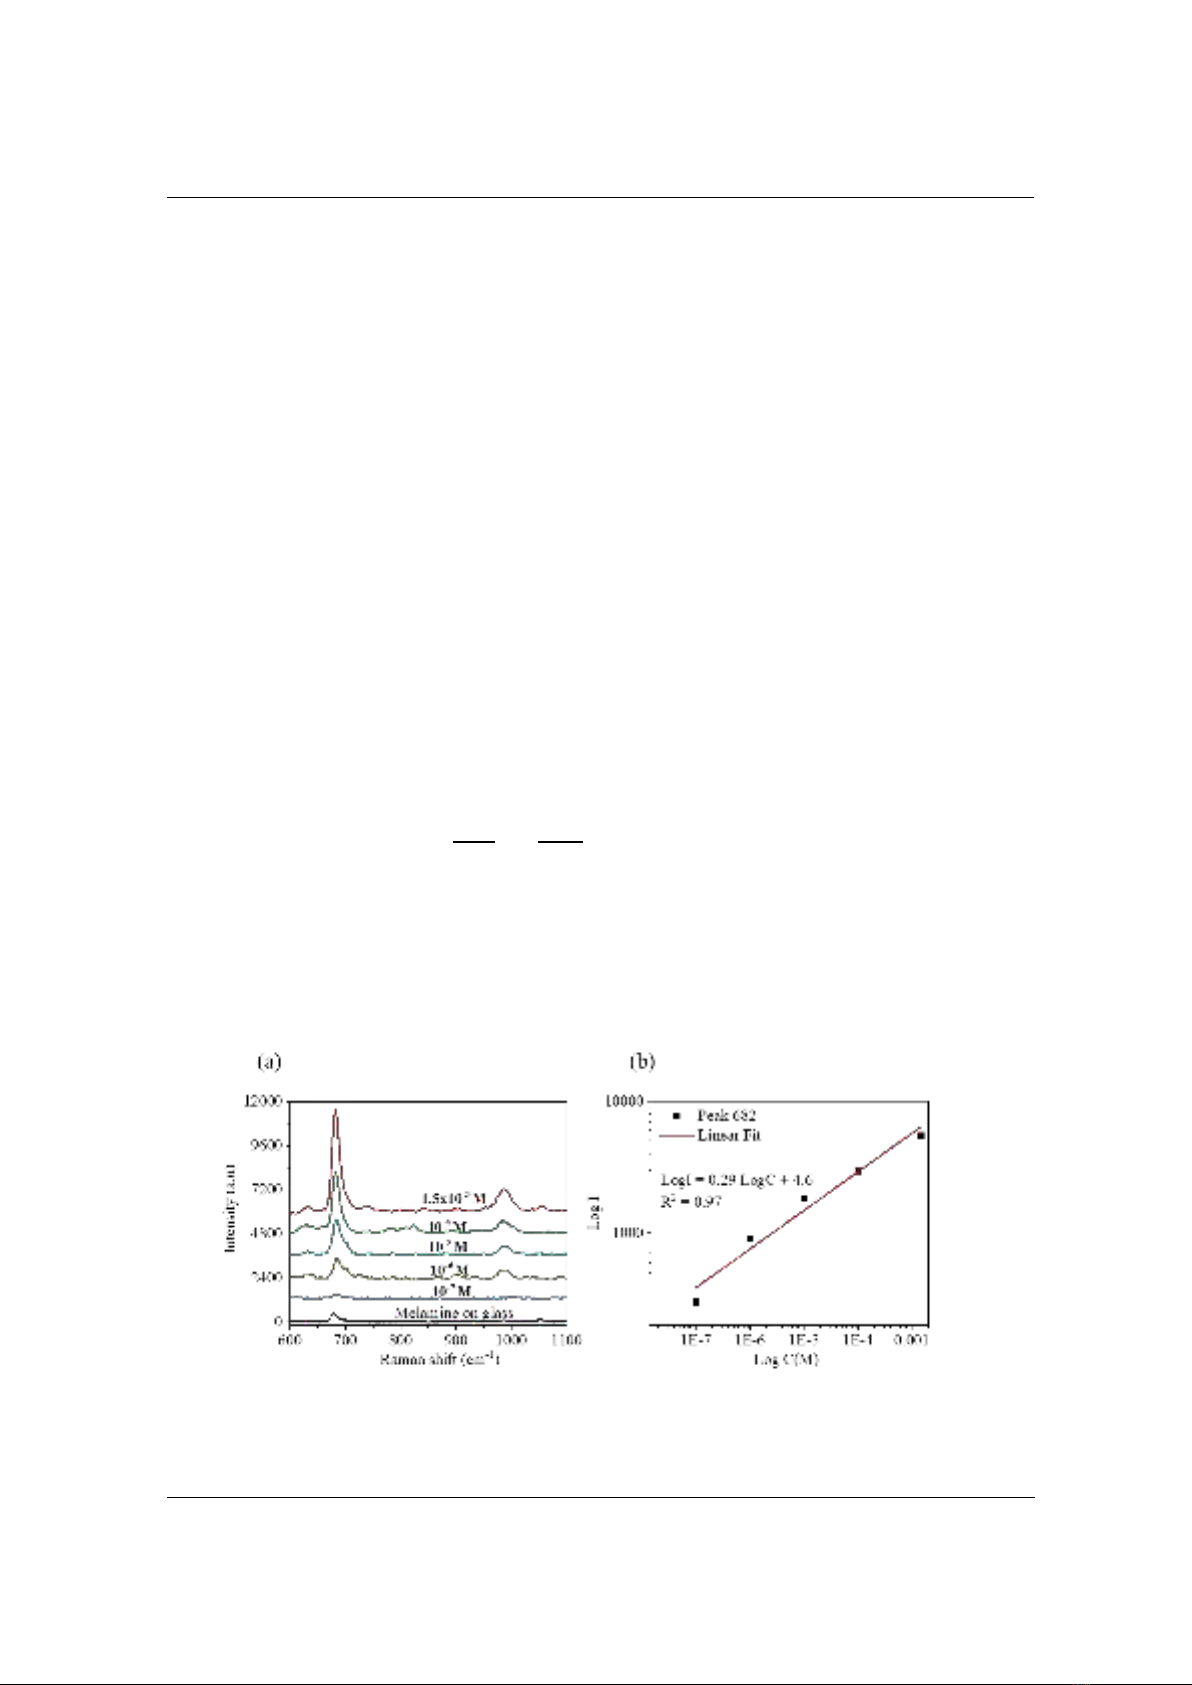
Melamine molecules are classified into D3h symmetry with a planar 1,3,5 s-triazine ring and
three amino groups attached with each C atom. The normal vibration modes of melamine are as
follows: 5A’
1 (Raman) + 4 A’
2 (inactive) + 9E’ (infrared/Raman) for the in-plane modes, and A’’
1
(inactive) + 3A’’
2 (infrared) + 4E’’ (Raman) for the out-plane modes [19]. Due to the selection
rules in the optical spectroscopies, the A’
2 and A’’
1 modes are absent. Figure 3 presents the SERS
spectrum of melamine (1.5 M×10-3 M) based on Ag NPs surface. The two most intense bands of
melamine were observed at 678 cm-1 and 987 cm-1, which have been assigned to the ring stretch
and C-Na stretch and are known as the totally symmetric line (A1
’) [19, 20]. Two vibration modes
at 630 and 1050 cm-1 could be attributed to the NH rocking and C-Na stretch (E’) [19]. For the Ag
NPs-melamine system, it seems that s-triazine is attached to the surface of Ag NPs through a
weak Ag – N bond and that the molecular plane is perpendicular to the Ag surface [12].
Figure 3. SERS spectrum of melamine 1.5×10⁻³ M based on Ag NPs surface
Generally, the SERS mechanism is significantly contributed by electromagnetic enhancement
causing the surface plasmon of the metal conduction band; and a lesser contribution stems from a
chemical mechanism that was explained via the charge-transfer resonance mechanism [21]. To
estimate the charge-transfer resonance mechanism, the relative energy level of Ag NPs and the
TNU Journal of Science and Technology
229(06): 195 - 201
http://jst.tnu.edu.vn 199 Email: jst@tnu.edu.vn
highest occupied molecular orbital (HOMO) – lowest unoccupied molecular orbital (LUMO) of
melamine have to be involved. The HOMO and LUMO of melamine were located at 6.7 and 0.26
eV, respectively [22]. Likewise, the work function of Ag is 4.26 eV [23]; thus, the barrier for
electron injection from the Fermi level of Ag to the LUMO of melamine is about 4 eV. It appears
that under the excitation wavelength of 532 nm (2.3 eV), this energy is out of resonance with the
charge transfer transition from the Ag Fermi lever to the LUMO of melamine. Therefore, the
charge-transfer resonance mechanism could be ignored for the contribution of the SERS
mechanism to detect melamine based on Ag NPs. For Ag NPs, the plasmon resonance is
localized near the surface of the particle. It is accepted that a vibrational molecule located near a
metal nanoparticle will couple to the exciting light; and the polarizability tensor of the metal-
molecule system will couple to the surface plasmon resonance field [12]. Thus, it should be
deduced that SPR plays a significant role in the SERS mechanism based on the molecular-metal
system Ag NPs and melamine.
3.2.2. Study SERS sensitivity based on Ag NPs in detecting melamine
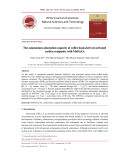
To assess the sensitivity of the SERS activity of Ag NPs surface in detecting melamine,
various concentrations of melamine (varying from 1.5×10⁻³ M to 10-7 M) were prepared. The
SERS performance of melamine based on Ag NPs is presented in Figure 5. At a lower
concentration of 10-7 M, the SERS spectra cannot be achirved in discrepance peaks. Thus, the
limit of detection (LOD) of melamine based on Ag NPs surface is as low as 10-7 M. This is a
good LOD for detecting melamine in comparison with the previous studies [10], [24]. Figure 4b
shows a linear relationship between the logarithm of the concentration of melamine and intensity.
To assess the sensitivity of detecting melamine based onthe surface of Ag NPs surface, the
enhancement factor (EF) was estimated using the peak at 678 cm-1 following the formula [25]:
EF =
(2)
in which ISERS and Inor are the SERS intensity of melamine adsorbed on Ag NPs and the normal
Raman intensity of melamine on the glass substrates, respectively; CSERS and Cnor are the
concentrations of the melamine on the Ag NPs surface and that on a glass substrate, respectively.
Melamine concentrations ranging from 1.5×10⁻³ to 10-7 M resulted in EF values of 2.2×10³ to
2×10⁵. In comparison with the SERS activity in detecting melamine of other substrates, such as
silver nanodecahedra [26], silver nanoparticles, and silver nanoparticle-coated HfO2 [24], this
study indicates an advantage in SERS activity for probing melamine.
Figure 4. (a) SERS spectra of melamine adsorbed on Ag NPs surfaces with different concentrations
ranging from 1.5×10⁻³ M to 10-7 M, using the excitation wavelength at 532 nm; and (b) the linear
relationship between the log I of the 682 peak and the logarithm of melamine concentration


![Đề thi Con người và môi trường cuối kì 2 năm 2019-2020 có đáp án [kèm file tải]](https://cdn.tailieu.vn/images/document/thumbnail/2025/20250523/oursky06/135x160/4691768897904.jpg)


![Đề cương ôn tập Giáo dục môi trường cho học sinh tiểu học [mới nhất]](https://cdn.tailieu.vn/images/document/thumbnail/2025/20251212/tambang1205/135x160/621768815662.jpg)


