
ISSN 1859-1531 - THE UNIVERSITY OF DANANG - JOURNAL OF SCIENCE AND TECHNOLOGY, VOL. 22, NO. 11B, 2024 129
STUDY ON THE EFFECT OF ADDITIVES ON THE PROPERTIES OF MORTAR
USED IN 3D PRINTING TECHNOLOGY WITH A SMALL-DIAMETER NOZZLE
Nguyen Duc Tuan*, Huynh Phuong Nam, Nguyen Thanh Binh, Nguyen Minh Hai
1The University of Danang - University of Science and Technology, Vietnam
*Corresponding author: ndtuan@dut.udn.vn
(Received: September 07, 2024; Revised: September 27, 2024; Accepted: October 09, 2024)
DOI: 10.31130/ud-jst.2024.534E
Abstract - 3D printing in construction simplifies processes by
removing formwork, enabling precise automation, and supporting
complex structural designs. This study evaluates the effect of
admixtures on the properties of mortar used in 3D printing with a
nozzle diameter of 5mm. The plasticizing additive Sika Plastiment
96 and the shrinkage-reducing admixture Sika Intraplast Z-HV, at
varying dosages, were employed to design 20 mortar mix trials. A
series of experiments were conducted to assess the flowability,
retention of flowability, load-bearing capacity of printed layers, and
mechanical strength of the mortar. The results indicate that the
dosage of admixtures significantly affects the printability and
compressive-flexural strength of the hardened mortar. The optimal
admixture ratio of Intraplast Z-HV and Plastiment-96 was
determined to be 0.6:0.45%, the designed mortar mix retained
printability for up to 40 minutes with a 5mm nozzle, and the
maximum number of layers printable in one session was 20.
Key words - 3D printing mortar; plasticizing additive; shrinkage-
reducing additive; printability; load-bearing capacity of printed
layers.
1. Introduction
In recent years, construction technology using 3D
printing methods has been making groundbreaking
advancements [1], this has been demonstrated through
numerous real-world projects featuring complex
geometries that are fully 3D-printed in an automated
process with high precision and excellent aesthetics [2, 3].
In addition, with the rapid development of Building
Information Modeling (BIM) in recent years, 3D printing
technology is increasingly expected to automate and
address construction challenges such as shortening
timelines, eliminating the need for formwork, and
enhancing the precision of complex structural details based
on available BIM models [4]. However, for 3D printing
technology to be more widely adopted in the near future,
alongside the development of mechanical systems and
software integration to automate the printing process,
optimizing the composition of the print material, such as
concrete or mortar, to meet the technical requirements of
3D printing is a critically important area of research.
Currently, many studies are focusing on analyzing the
effects of mixed composition on certain fundamental
properties of concrete or mortar when applied to 3D
printing technology [5-6]. Research shows that the material
mixture must have adequate flowability to be continuously
supplied to the nozzle without clogging, while
simultaneously possessing the ability to retain its shape
according to the design structure after extrusion [7]. If the
material mixture has excessively low flowability, it will
cause nozzle clogging. Conversely, if the material is too
fluid, it will lose its ability to maintain shape after exiting
the nozzle. The requirements for this property also vary
depending on the use of nozzles with different diameters.
Utilizing smaller nozzles can facilitate the construction of
components that require high levels of detail. However,
there are few studies worldwide focusing on nozzle
diameters below 10 mm [8-9]. Reducing the nozzle
diameter increases the risk of clogging, which presents a
significant challenge when decreasing the diameter of the
printing nozzle. To address this issue, the print mixture
needs to have higher flowability. Additionally, mortar
mixtures are considered more feasible than conventional
concrete, as the larger aggregates in concrete can cause
blockages in the piping during pumping and extrusion.
Moreover, the bond strength between layers will
decrease with the time interval between printing passes
[16], Therefore, reducing the time interval between the
printing of two layers not only helps increase the printing
speed but also enhances the bond between the printed
layers, thereby improving the quality of the structure.
However, if the layers are stacked too early before the
previous layer has achieved an appropriate strength level,
it may cause deformation or damage to the previously
printed layers. Thus, it is essential to evaluate the shape
stability and load-bearing capacity of the material layer
over a specific time period after printing. Lastly,
phenomena such as clogging, localized hardening, and
shrinkage of the mixture can contribute to the occurrence
of cracks in structures when applying 3D printing
technology. Therefore, these characteristics also need to be
appropriately assessed when developing the material
mixture.
For the aforementioned properties, in addition to
optimizing the amounts of cement, water, and aggregates
in mortar or concrete, the rational use of admixtures is a
necessary approach. Numerous studies worldwide have
investigated the use of admixtures to modify the properties
of concrete to make it suitable for 3D printing processes.
These studies typically focus on the effects of mineral and
chemical admixtures on the coagulation process of fine
particles or on enhancing the hydration of cement through
physicochemical mechanisms, which help improve flow
properties and accelerate the strength development of the
mortar [11-14]. These types of admixtures typically focus
on accelerating the early strength development but can also
lead to a rapid decrease in flowability, necessitating the use
130 Nguyen Duc Tuan, Huynh Phuong Nam, Nguyen Thanh Binh, Nguyen Minh Hai
of specialized equipment to mix the mixture directly at the
print head. To address this issue, the combination of
plasticizers and expanding agents has been considered as a
novel approach. This combination not only helps improve
strength but also maintains the flowability of the mixture,
minimizes shrinkage, and thus reduces the occurrence of
cracks in the 3D-printed mortar product. Additionally, it
addresses the limitations of previously used admixtures.
However, the effects of the dosage and types of these
admixtures on the fundamental properties of the mortar
mixture when applied in 3D printing technology have not
yet been clarified in previous studies.
Therefore, this study aims to clarify the influence of the
type and dosage of admixtures on the printability of the
mortar mixture used in 3D printing technology with a small
nozzle diameter of only 5 mm. The plasticizer Sika
Plastiment 96 and the shrinkage-reducing agent Sika
Intraplast Z-HV at varying dosages were utilized to design
experiments for 20 different mix compositions of the
mortar. A series of experiments were conducted to
determine the flowability, flow retention, load-bearing
capacity of the printed layers, as well as the mechanical
strength of the mortar after curing. The experimental
results were analyzed to derive general trends regarding the
impact of each admixture dosage on printability-related
properties and to propose the optimal mix composition for
the case of using a 5 mm nozzle.
2. Materials and Experimental Methods
2.1. Materials Used
In cases where the 3D printing nozzle is smaller than
5mm, the use of aggregates such as crushed stone or coarse
sand, as in conventional concrete, can lead to blockages,
making the use of fine aggregates a more suitable
approach. Additionally, a portion of the cement should be
replaced with fly ash or silica fume (SF) to improve
pumpability and extrudability, enhancing the thixotropic
properties of the concrete mix. Chemical admixtures and
rheology modifiers also need to be employed depending on
the specific application of the mixture [15, 16]. Based on
the initial analysis, the mortar mixture used in the study
includes cement, water, silica fume mineral admixture, fine
aggregates, and various plasticizing and shrinkage-
reducing additives.
Specifically, the cement used is Hai Van Portland
Cement PC40 with a specific gravity of 3.02 g/cm³ and a
28-day compressive strength of 43.0 N/mm². The
aggregate is finely ground limestone powder, originating
from Đại Hiệp quarry, Quảng Nam Province, Vietnam. The
fine aggregate (FiA) has a specific gravity of 2.76 g/cm³
and a loose bulk density of 1024 kg/m³. The active mineral
admixture used is silica fume (SF), supplied by Sika in
25kg bags, with a recommended dosage of 5-10%, and its
physical and mechanical properties meet the requirements
of TCVN 8827:2011.
The plasticizing additive Sika Plastiment-96 (P96) used
in the study is a lignosulfonate-based admixture, compliant
with ASTM C494 Type D. It has a specific gravity of 1.16-
1.18 kg/l, and its function is to delay setting time without
slowing down the hardening process, while also enhancing
strength after curing. Another additive incorporated is the
shrinkage-reducing additive Sika Intraplast Z-HV (IZ),
which is in powder form with a specific gravity of 1.05
kg/l. This additive reduces volume expansion during
application and improves the workability of the mortar mix
without causing segregation or bleeding, thereby
enhancing the bond between the layers of mortar during the
3D printing process.
2.2. Mix Design
To clarify the influence of additives on the fundamental
properties of the mortar mix, the study conducted an
experimental design with 20 different mix proportions, as
presented in Table 1. The amounts of cement, silica fume,
and limestone powder were fixed across all mixes. The
independent variables considered in the study were the
dosage of the plasticizing additive Sika Plastiment-96 (P96)
and the content of the shrinkage-reducing additive Sika
Intraplast Z-HV (IZ). Specifically, the mass ratio of the IZ
additive varied from 0.5% to 0.8%, while the dosage of the
P96 additive was changed from 0.35% to 0.55%.
Additionally, there were slight variations in water content
among the different mixes to optimize workability, ensuring
that the mortar mixes met the requirements for printing with
a nozzle diameter of 5 mm in the initial phase. This is a
prerequisite for determining the printability of the mortar
mix before proceeding with subsequent tests in the study.
Table 1. Mix Proportions Used
Mix
No.
(CP)
IZ
P96
W/C
C
FiA
W
SF
IZ
P96
%
%
kg
kg
lít
kg
kg
l
1.1
0.5
0.35
0.522
735.6
799.6
384.0
64.0
4.0
2.57
1.2
0.40
0.521
735.6
799.6
383.2
64.0
4.0
2.94
1.3
0.45
0.520
735.6
799.6
382.5
64.0
4.0
3.31
1.4
0.50
0.519
735.6
799.6
381.8
64.0
4.0
3.68
1.5*
0.55
0.518
735.6
799.6
381.0
64.0
4.0
4.05
2.1
0.6
0.35
0.517
735.6
799.6
380.3
64.0
4.8
2.57
2.2
0.40
0.516
735.6
799.6
379.6
64.0
4.8
2.94
2.3
0.45
0.515
735.6
799.6
378.8
64.0
4.8
3.31
2.4
0.50
0.514
735.6
799.6
378.1
64.0
4.8
3.68
2.5*
0.55
0.513
735.6
799.6
377.4
64.0
4.8
4.05
3.1
0.7
0.35
0.514
735.6
799.6
378.1
64.0
5.6
2.57
3.2
0.40
0.513
735.6
799.6
377.4
64.0
5.6
2.94
3.3
0.45
0.512
735.6
799.6
376.6
64.0
5.6
3.31
3.4
0.50
0.511
735.6
799.6
375.9
64.0
5.6
3.68
3.5*
0.55
0.51
735.6
799.6
375.2
64.0
5.6
4.05
4.1
0.8
0.35
0.511
735.6
799.6
375.9
64.0
6.4
2.57
4.2
0.40
0.509
735.6
799.6
374.4
64.0
6.4
2.94
4.3
0.45
0.507
735.6
799.6
372.9
64.0
6.4
3.31
4.4
0.50
0.505
735.6
799.6
371.5
64.0
6.4
3.68
4.5*
0.55
0.503
735.6
799.6
370.0
64.0
6.4
4.05
2.3. Experimental Methodology
The study focuses on evaluating the properties related
to printability, which includes: (i) workability and the
ability to maintain workability, (ii) load-bearing capacity
of the printed layers, and (iii) compressive and flexural
strength of the mortar after curing.
Currently, there is no standardized method for
evaluating the workability of concrete and mortars used in
3D printing. Therefore, the study conducted preliminary
ISSN 1859-1531 - THE UNIVERSITY OF DANANG - JOURNAL OF SCIENCE AND TECHNOLOGY, VOL. 22, NO. 11B, 2024 131
testing using four methods, including the workability test
of concrete mixtures using a manual flow table slump test,
the workability test of concrete mixtures using a Suttard
viscometer, and the standard consistency test of cement
paste using a Vica ϕ10 device [17-19]. The test results for
some of the mixtures in Table 1 according to these methods
are presented in Table 2.
Table 2. Results of Workability Testing Using Different
Methods.
Mix No.
(CP)
Manual flow
table
Suttard
viscometer
Vica ϕ10
DTB (mm)
DTB (mm)
mm
1.1
126.0
5
2
1.5
134.5
5
4
2.1
130.0
5
4
2.5
134.5
5
5
3.1
131.0
5
4
3.5
138.5
5
1
4.1
132.0
5
5
4.5
137.0
5
0
Deviation
12
0
3
Table 2 shows that the Suttard viscometer method
could not be applied due to the lack of significant
differences between the various mixtures. The slump test
and Vica method demonstrated clear differences between
the mixtures, allowing for an assessment of the impact of
compositional changes on the workability of the mortar
mixture. However, the slump test only determines the
workability of the mixture at a specific moment, making it
challenging to assess the duration of workability. In
contrast, the Vica method allows for multiple tests to
collect time-related differences in the mortar mixture,
thereby determining the time frame during which the
mixture can maintain its plasticity during printing.
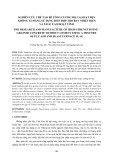
Therefore, the study selected the Vica needle method to
evaluate the workability and the ability to maintain
workability of the mortar mixture, as shown in Figure 1a
[19]. Specifically, the study used a Vica needle with a
diameter of 5 mm and conducted repeated experiments
every 5 minutes. The distance from the bottom of the
sample to the tip of the Vica needle is defined as the
penetration resistance (mm), a larger value indicates lower
plasticity of the mortar mixture, and vice versa.
Additionally, for each mixture, a trial printing experiment
using a nozzle with a diameter of 5 mm was conducted, as
shown in Figure 1(b), to clarify the relationship between
the results of the Vica needle test and the actual printing
ability. Experiments on the baseline mixture demonstrated
that when the penetration resistance measured with the
Vica needle Vica ϕ5 exceeds 5 mm, the mortar mixture
cannot flow through the nozzle with a diameter of 5 mm.
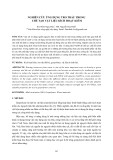
On the other hand, to evaluate the ability to support
printed layers, experiments using a real nozzle were
conducted to replicate the loading effects of the printed
strands on the first printed layer. This allowed for the
observation of the extent of height reduction of the printed
layer and the shape retention of the sample after being
subjected to loading, as shown on the left side of Figure 2.
Additionally, to facilitate the measurement of the slump of
the mortar over time, three cylindrical samples with a
diameter of 50 mm were used for each mixture, as shown
on the right side of Figure 2. Initially, the mortar mixture
was poured into a plastic mold with a height of 50 mm.
After 5 minutes, the plastic tube was removed from the
mortar mixture. Subsequently, a flat plastic sheet was
placed on top of the mortar sample, and loading was
applied for the next layer every 5 minutes. The loading
material used in this process was sand, with the mass of
each sand layer equivalent to the mass of the initial mortar
sample. This procedure was conducted for three cycles for
each sample. The load in each cycle was calculated to
match the load of each printed layer. The height of the
mortar sample was measured after each loading cycle.
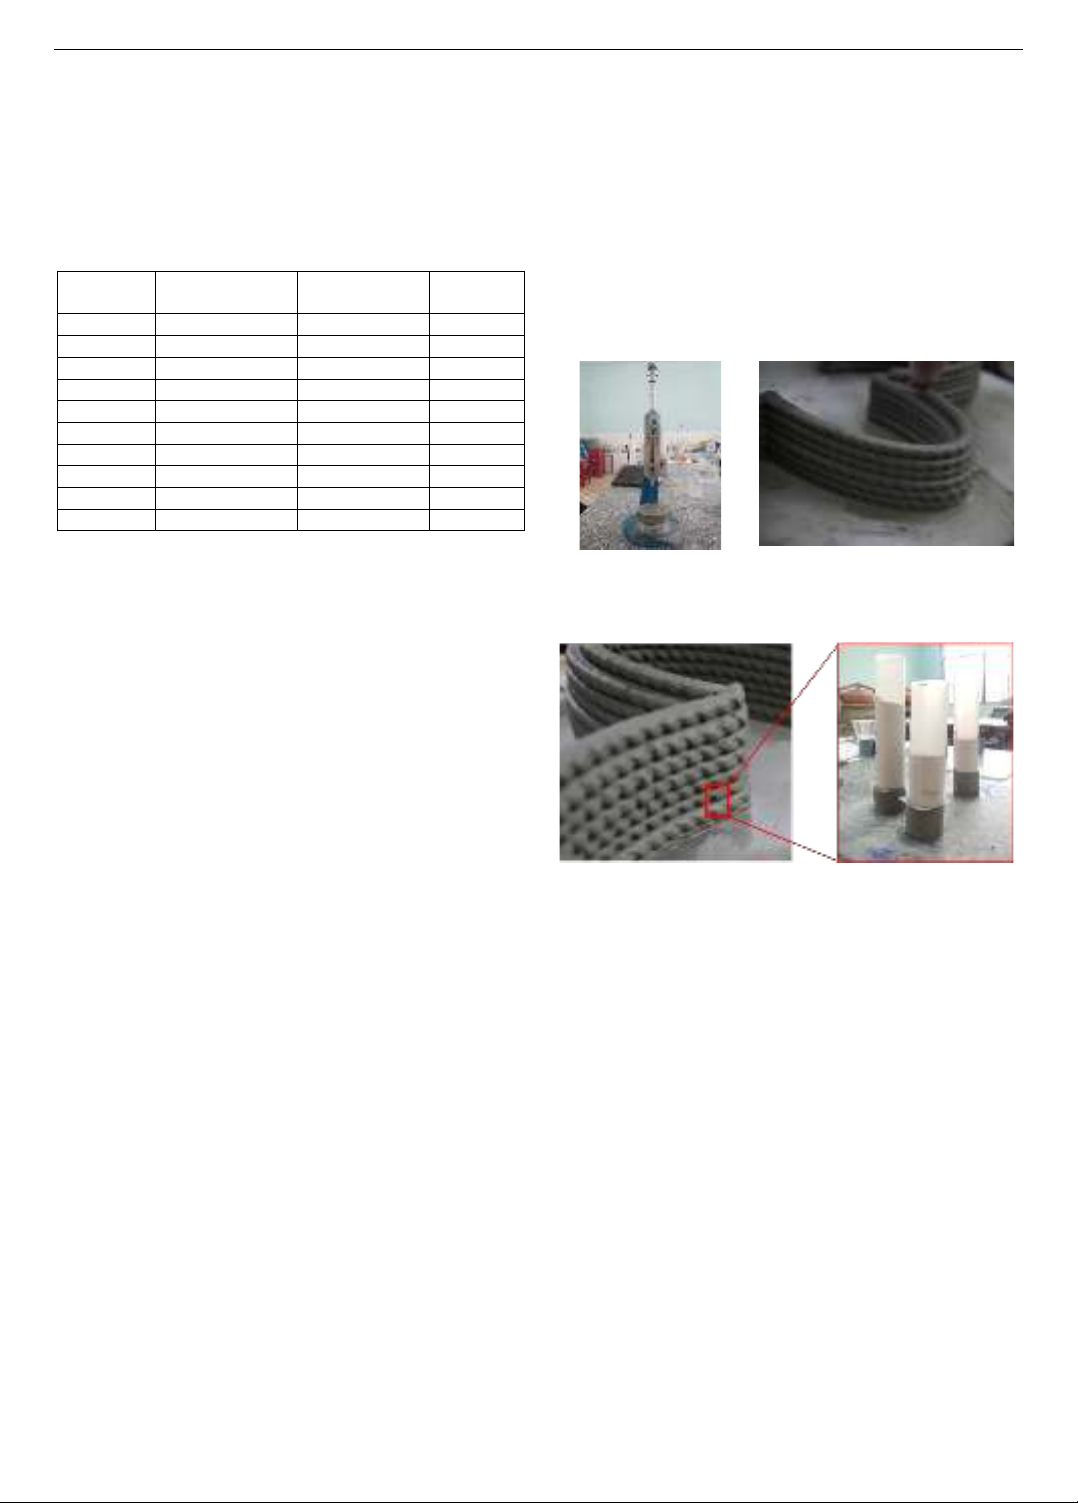
(a) Vica needle test
(b) Test printing experiment
Figure 1. Workability test and ability to
support printed layers
Figure 2. Experiment on the load-bearing capacity of
the printed layer above.
Finally, the compressive and flexural strength tests for
the 20 mixtures were conducted according to TCVN 3121-
11 [18]. Since this study focuses primarily on workability
and printability, the mechanical strength tests were
performed at 3 days of age for all concrete mixtures.
3. Results and Discussion
3.1. Influence of Additives on Workability and Retention
of Workability of Mortar Mixtures
Table 3 presents the results of the Vica needle test with
a diameter of 10 mm and its correlation with the printing
capability using a 5 mm diameter nozzle. The results
indicate that when the penetration depth measured by the
Vica needle is less than 2.0 mm, the mortar mixture
exhibits excessive plasticity and lacks the ability to
maintain shape during the printing process. Conversely, for
mixtures with an initial penetration depth of 5.0 mm, the
mortar can flow smoothly through the nozzle without
causing blockages. Therefore, a penetration depth greater
than 2.0 mm for the Vica needle is considered an
appropriate range for the mortar mixture to ensure adequate
printing capability at the initial stage.
132 Nguyen Duc Tuan, Huynh Phuong Nam, Nguyen Thanh Binh, Nguyen Minh Hai
Table 3. Results of Vica Needle Testing and 3D Printer Testing
Mix No (CP)
1.1
1.2
1.3
1.4
1.5
2.1
2.2
2.3
2.4
2.5
Penetration
resistance (mm)
2.0
5.0
4.0
4.0
4.0
4.0
3.5
3.5
5.0
5.0
3D Printer
Testing
Good
Good
Good
Good
Good
Good
Good
Good
Good
Good
Mix No (CP)
3.1
3.2
3.3
3.4
3.5
4.1
4.2
4.3
4.4
4.5
Penetration
resistance (mm)
4.0
2.5
2.0
2.0
1.0
5.0
2.0
3.0
2.0
0.0
3D Printer
Testing
Good
Good
Good
Good
Loose
Good
Good
Good
Good
Loose
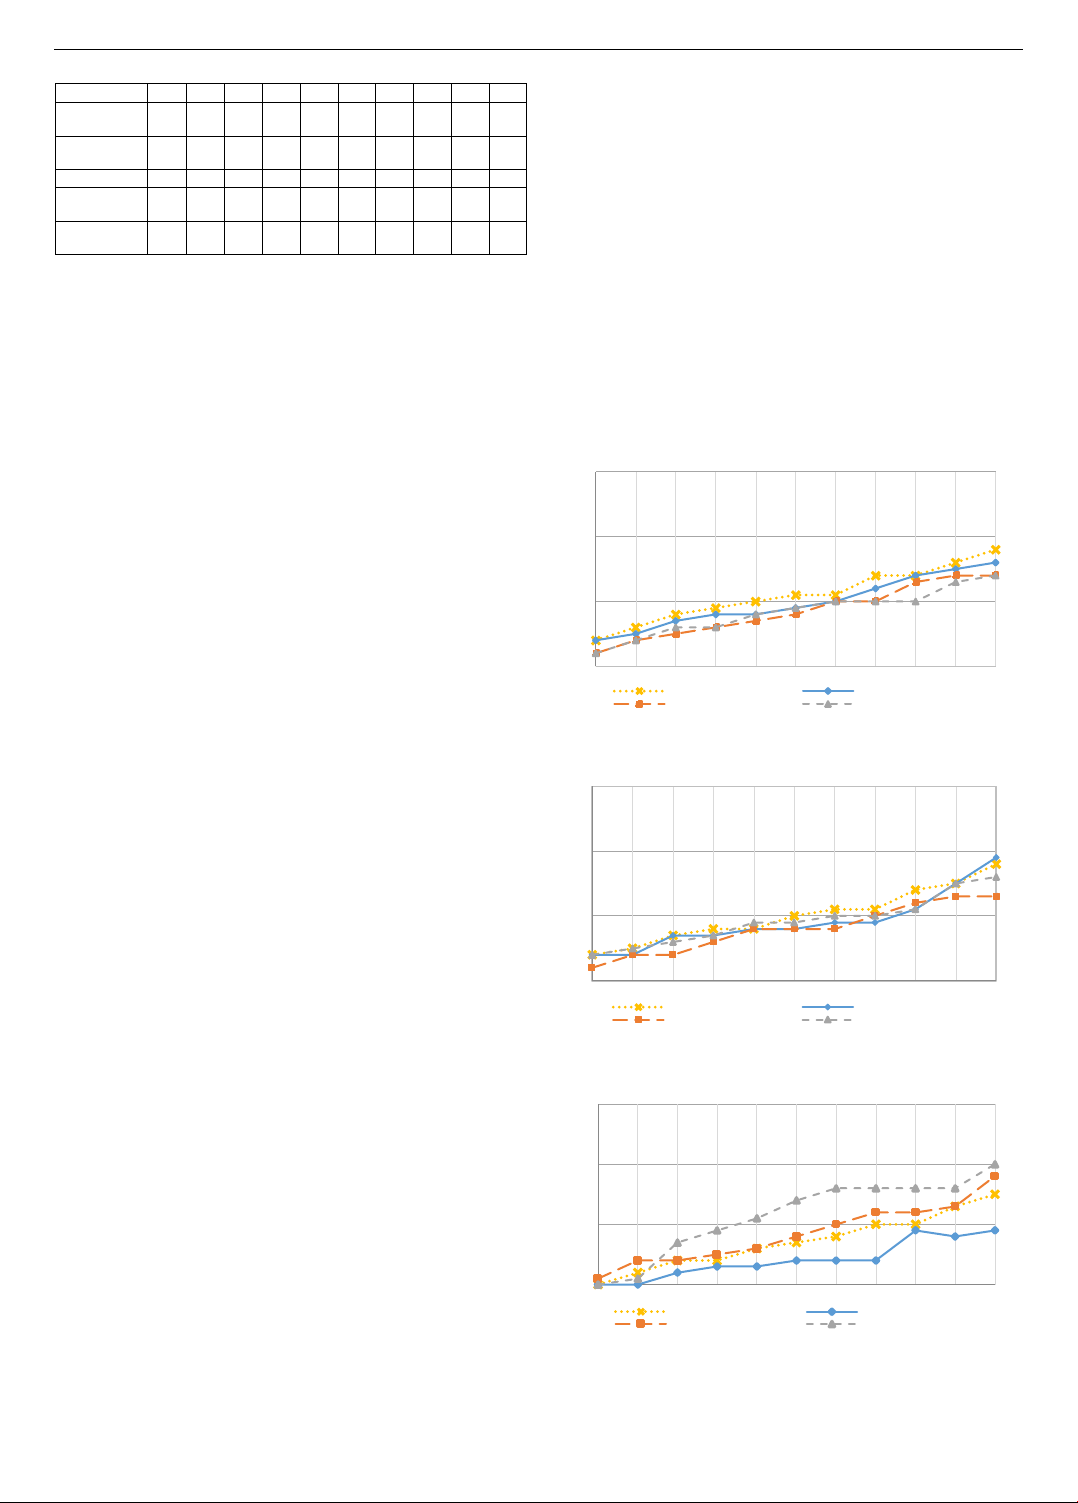
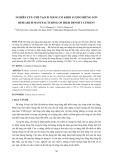
To assess the workability retention of the mortar
mixtures, tests were conducted using a Vica needle with a
diameter of 5 mm, as described in section 2. Results
presented in Figures 3(a) to 3(d) illustrate the relationship
between time and penetration resistance S (mm) for mortar
mixtures with IZ content ranging from 0.5% to 0.8%. Here,
the mortar mixture is considered to maintain its initial
printability when the penetration resistance falls within the
range of 0 to 5.0 mm. Figure 3 shows that the penetration
resistance increases over time due to the hardening process
of the mortar mixture. Generally, all mortar mixtures retain
their printability within the time range of 35 to 45 minutes,
meaning the penetration resistance during this period
remains within 0 to 5.0 mm. In Figures 3(b) and 3(c), the
IZ ratios of 0.6% to 0.7% help the mortar mixtures
maintain penetration resistance below 5 mm for a longer
duration compared to the mixtures with IZ ratios of 0.5%
and 0.8%. However, after the 40-minute mark, the rate of
workability loss of the mixtures increases rapidly, and by
the 55-minute, most of the tested mixtures exhibit
penetration resistance nearing 10 mm. This can be
understood as the hydration reaction begins to occur
strongly during this time, forming a C-S-H gel that forms
a network that binds cement and sand particles together.
The formation of C-S-H gel is the primary reason for the
accelerated loss of workability in the mortar [20-21].
With the variation in P96 dosage at different levels,
there is a significant impact on the initial mixing water
content. An increase in P96 dosage reduces the free water
during mixing, thereby increasing the workability of the
mortar mixture. Thus, to ensure that the mixtures have
similar initial consistency and workability, the water-to-
cement (W/C) ratio needs to be reduced as the P96 dosage
increases. This adjustment ensures the initial consistency
of the mortar, achieving a Vica needle penetration of ϕ10
within the range of 2 to 5 mm. The simultaneous increase
in P96 and reduction in the W/C ratio make the change in
Vica needle penetration resistance not particularly
noticeable. However, when using P96 within the range of
0.35% to 0.50%, all mixtures demonstrated an extended
period of maintaining printability. Notably, the mixtures
with P96 dosages of 0.40% and 0.45% exhibited better
performance in prolonging the workability period
compared to the other mixtures.
On the other hand, using a low IZ content of 0.5%, as
shown in Figure 3(a), only maintains printability for about
35 minutes. In contrast, Figure 3(b) indicates that mixtures
with higher P96 and IZ content tend to sustain lower
penetration resistance for up to 40 minutes and even up to
45 minutes. Despite reducing the W/C ratio in the mixtures
of Figure 3(c) compared to those in Figure 3(b) as a result
of increasing IZ and P96, the W/C ratio seems to affect the
initial plasticity but is not the key factor in extending the
workability retention time. Increasing the IZ content to
0.8%, as shown in Figure 3(d), reduces the printability
retention time to below 35 minutes. This is due to IZ’s
mechanism of creating small air bubbles in the wet mix,
which expands the volume of the mortar before setting.
These micro-bubbles allow the aggregates to slide more
easily, improving workability and plasticity, but too many
bubbles can reduce the mixture’s flowability. Therefore,
the optimal P96 content is between 0.4-0.45%, and the
optimal IZ content is between 0,6-0,7%. Mixtures using
additives in these ranges can maintain printability for up to
40 minutes. The mixture with the longest printability
retention time, T = 45 minutes, corresponds to CP 3.2 with
IZ and P96 ratios of 0.7% and 0.40%, respectively.
Figure 3(a). Graph showing the effect of P96 ratio on
workability retention time when IZ = 0.5%
Figure 3(b). Graph showing the effect of P96 ratio on
workability retention time when IZ = 0.6%
Figure 3(c). Graph showing the effect of P96 ratio on
workability retention time when IZ = 0.7%
0
5
10
15
5 10 15 20 25 30 35 40 45 50 55
S (mm)
T(minute)
IZ= 0,5%
CP 1.1 CP 1.2
CP 1.3 CP 1.4
0
5
10
15
5 10 15 20 25 30 35 40 45 50 55
S (mm)
T(minute)
IZ = 0,6%
CP 2.1 CP 2.2
CP 2.3 CP 2.4
0
5
10
15
5 10 15 20 25 30 35 40 45 50 55
S (mm)
T(minute)
IZ = 0,7%
CP 3.1 CP 3.2
CP 3.3 CP 3.4
ISSN 1859-1531 - THE UNIVERSITY OF DANANG - JOURNAL OF SCIENCE AND TECHNOLOGY, VOL. 22, NO. 11B, 2024 133
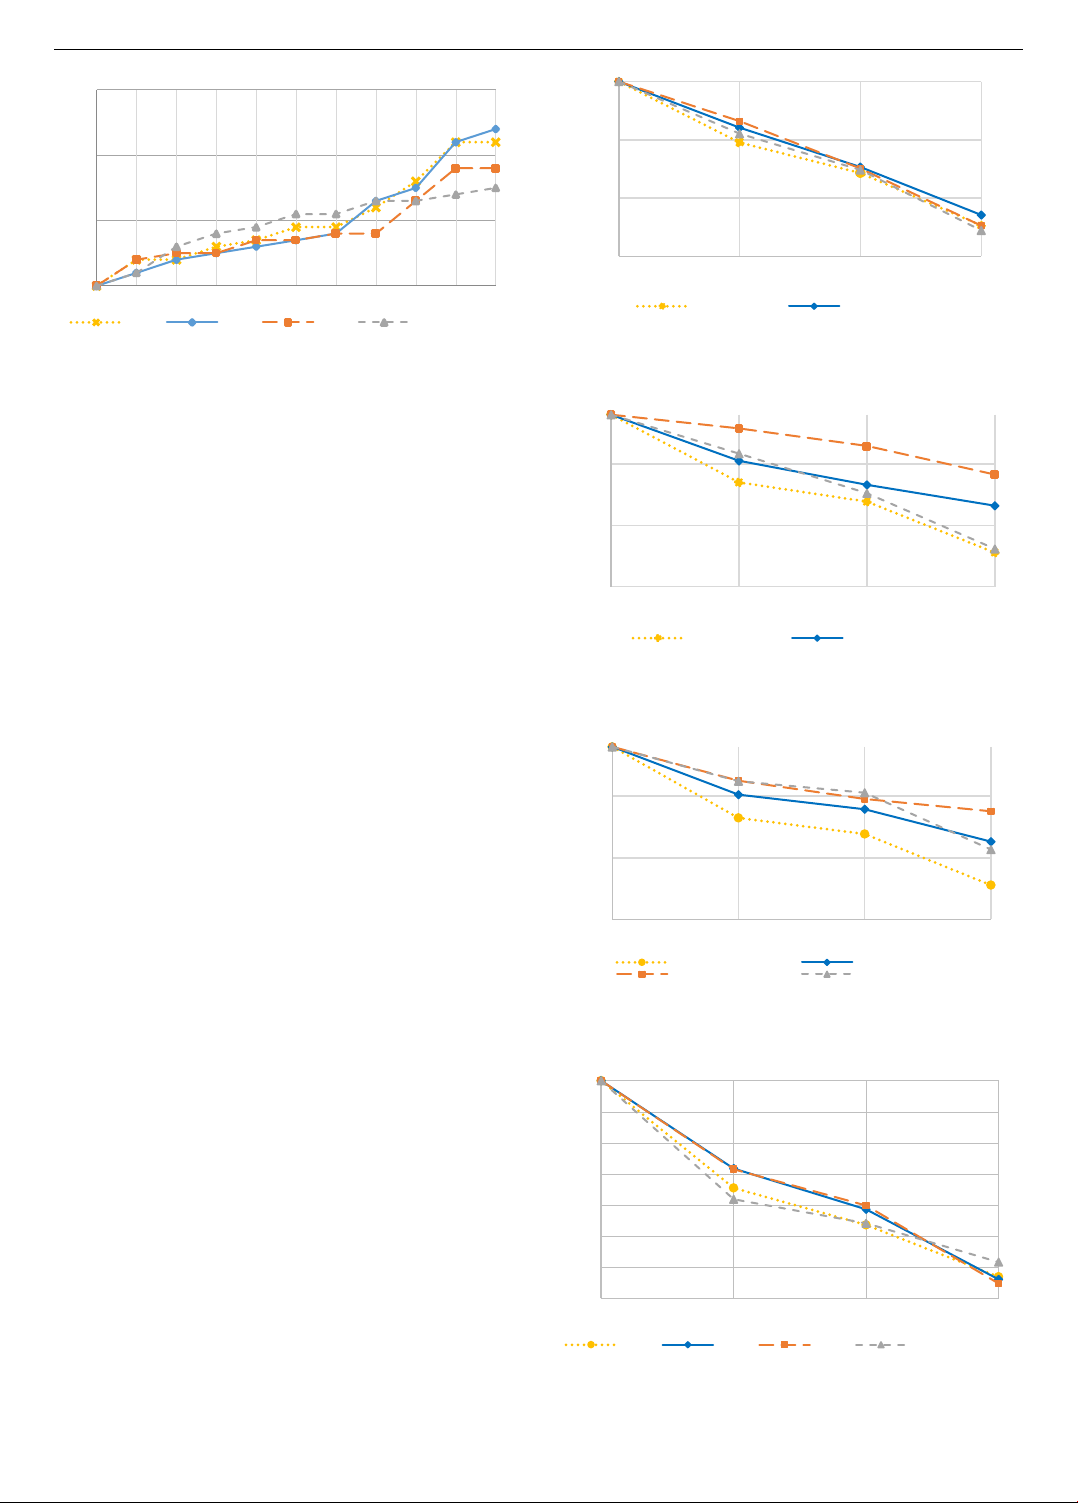
Figure 3(d). Graph showing the effect of P96 ratio on
workability retention time when IZ = 0.8%
3.2. Influence of Additives on the Load-Bearing Capacity
of the Printed Layers
Figures 4(a) to 4(d) illustrate the ratio of the sample
height after being subjected to the load from the upper
layers compared to the initial sample height, corresponding
to the use of IZ additive in the range of 0.5% to 0.8%, based
on the experimental procedure outlined in section 2.3. The
load-bearing capacity of the printed layers is higher when
the height of the mortar sample after loading remains close
to the initial height. Figure 4 shows a clear trend of height
reduction as the number of load layers increases. However,
the degree of reduction varies between different mixture
compositions. In Figure 4(a), with an IZ ratio of 0.5%, the
reduction in sample height is almost linear for all four
tested mixtures. In Figures 4(b) to 4(d), it can be seen that
the reduction in height is fastest for the first layer. The
second layer holds its shape better, while the height
reduction in the third layer varies depending on the P96
ratio. For the third printed layer, mixtures with IZ ratios
between 0.6% and 0.7% show significantly less reduction
compared to those with IZ ratios of 0.5% and 0.8%. This
behavior can be explained by the fact that IZ is an
expanding additive. In the 5 to 10 minutes after mixing, the
expansion reaction generates small air bubbles, which help
reduce the height loss when subsequent layers are loaded.
However, if a higher amount of IZ is used, the excessive
generation of air bubbles can decrease the load-bearing
capacity of the next printed layers.
On the other hand, Figure 4 shows that mixtures with
P96 ratios ranging from 0.45% to 0.5% exhibit better load-
bearing capacity for the printed layers compared to other
mixtures. The use of an increased P96 additive ratio
corresponds to a reduction in the W/C ratio. When the P96
additive ratio increases and the W/C ratio decreases, the
mortar mixture may lose its workability more quickly,
thereby demonstrating improved load-bearing capacity for
the printed layers compared to other mixtures. With a P96
additive ratio of 0.45% to 0.5% and an IZ shrinkage-
reducing additive ratio of 0.6% to 0.7%, the mixtures using
these additive levels show superior capacity to maintain
load-bearing strength for the printed layers. Mixture CP 2.3
(IZ, P96) = (0.6%, 0.45%) has the lowest height reduction
under load, with 98.88% remaining after one load layer,
97.45% after two load layers, and 95.13% remaining after
three load layers.
Figure 4(a). Graph showing the effect of the P96 ratio and
the W/C ratio on the load-bearing capacity of the top print layer
when the IZ = 0.5%
Figure 4(b). Graph showing the effect of the P96 ratio and
the W/C ratio on the load-bearing capacity of the top print layer
when the IZ = 0.6%
Figure 4(c). Graph showing the effect of the P96 ratio and the
W/C ratio on the load-bearing capacity of the top print layer
when the IZ = 0.7%
Figure 4(d). Graph showing the effect of the P96 ratio and
the W/C ratio on the load-bearing capacity of the top print layer
when the IZ = 0.8%
0
5
10
15
5 10 15 20 25 30 35 40 45 50 55
S (mm)
T(minute)
IZ = 0,8%
CP 4.1 CP 4.2 CP 4.3 CP 4.4
Load 1 layer Load 2 layer Load 3 layer
85
90
95
100
0 5 10 15
Sample height (%)
(minute)
IZ = 0,5%
CP 1.1 CP 1.2
Load 1 layer Load 2 layer Load 3 layer
98.88
97.45
95.13
86
91
96
0 5 10 15
Sample height (%)
(minute)
IZ = 0,6%
CP 2.1 CP 2.2
Load 1 layer Load 2 layer Load 3 layer
86
91
96
0 5 10 15
Sample height (%)
(minute)
IZ = 0,7%
CP 3.1 CP 3.2
CP 3.3 CP 3.4
Load 1 layer Load 2 layer Load 3 layer
86
88
90
92
94
96
98
100
0 5 10 15
Sample height (%)
(minute)
IZ = 0,8%
CP 4.1 CP 4.2 CP 4.3 CP 4.4


![Bài giảng Quản lý vận hành và bảo trì công trình xây dựng [chuẩn nhất]](https://cdn.tailieu.vn/images/document/thumbnail/2025/20251006/agonars97/135x160/30881759736164.jpg)