
Applied Catalysis A: General 270 (2004) 9–25
FCC catalysts with different zeolite crystallite sizes:
acidity, structural properties and reactivity
G. Tonettoa, J. Atiasb, H. de Lasaa,∗
aChemical Reactor Engineering Centre, Faculty of Engineering Science, University of Western Ontario,
London, Ont., Canada N6A 5B9
bDepartamento de Termodinámica y Fenómenos de Transferencia, Universidad Simón Bol´ıvar, Caracas, Venezuela
Received in revised form 21 March 2004; accepted 25 March 2004
Abstract
Two FCC catalysts with a 60 m average size, prepared with different crystallite sizes (0.4 and 0.9 m), are studied in terms of total
acidity, energy of ammonia desorption, specific surface area, relative amount of Brönsted and Lewis acid sites, crystallite and particle size,
and micropore size distribution.
Characterization of these catalysts is relevant in view of their application to test the extent of intracrystallite diffusive transport influence on
the overall catalytic cracking rates as developed, in separate studies [Ind. Eng. Chem. Res. 42 (2003) 4162] in a novel CREC Riser Simulator.
© 2004 Elsevier B.V. All rights reserved.
Keywords: Y zeolite; FCC catalysts; Nitrogen adsorption; Ammonia TPD; Surface area; Porosity
1. Introduction
Catalytic cracking of hydrocarbons combined with fluid
bed processes (FCC) is one of the most important and most
profitable processes in the petroleum refining industry [2].
FCC units are used to upgrade heavy gas oils to gasoline,
diesel fuel, and light gases. Catalytic cracking of hydrocar-
bons is a vapor-phase reaction occurring via a carbonium ion
mechanism. This reaction is catalyzed by materials having
acidic properties [3,4].
The introduction of zeolite cracking catalysts in the early
1960s revolutionized the petroleum refining industry. Y ze-
olites have been used extensively in catalytic cracking since
1962. The currently available commercial FCC catalysts
are manufactured with 1 m HY crystallites, which are
dispersed via spry drying in an amorphous silica-alumina
matrix [5]. The fluidizable pellets are about 60 m
diameter.
Y zeolites are constituted by building blocks of a fauj-
asite structure. Y zeolites display a three-dimensional pore
network with pores running perpendicular to each other.
∗Corresponding author. Tel.: +1-519-661211; fax: +1-519-6613498.
E-mail address: gtonetto@plapiqui.edu.ar (H. de Lasa).
Twelve-member oxygen rings delimit the 7.4 Å opening con-
necting supercages with a 12 Å diameter [6].
These crystallites have catalytic active sites located both
in the internal pore structure and as well as on the outer
surface of the crystallites. The majority of the active sites
is located within the zeolite pore structure [7]. In order for
the reaction to proceed, molecules have to diffuse through
the large matrix pores into the zeolite crystals. Diffusion in
catalysts belongs, in many cases, to the Knudsen regime,
because the zeolite pore wall significantly influences dif-
fusing molecules. Diffusion in zeolites, however, falls more
in a so-called “configurational regime”, since the size of
the hydrocarbon molecules is nearly the size of the ze-
olite inner channels and the diffusing molecules evolve
under strong pore constrains and may not pass each other
[8,9].
The specific characteristics of zeolites that are respon-
sible for their ability to catalyze chemical reactions are
their regular crystalline structure and acidity. In addition,
the presence of molecules blocking the pores of a zeolite
or the partial destruction of its structure may significantly
reduce the activity of zeolites and modify the selectivity by
limiting the accessibility of the internal active sites to the
reactants. For instance, dealumination, a common treatment
0926-860X/$ – see front matter © 2004 Elsevier B.V. All rights reserved.
doi:10.1016/j.apcata.2004.03.042

10 G. Tonetto et al. / Applied Catalysis A: General 270 (2004) 9–25
Nomenclature
Cconstant related with the experimental
condition
Edes energy of desorption of ammonia (kJ/mol)
kdadsorption constant of ammonia (ml/min)
kd0 pre-exponential factor of adsorption of
ammonia (ml/min)
Runiversal gas constant (8.314 J/mol K)
ttime (min)
Ttemperature (K)
Tptemperature at maximum desorption rate (K)
T0centering temperature (K)
Vdes volume of ammonia desorbed (ml)
Vmvolume of ammonia adsorbed at saturation
(ml)
Greek letters
βrate of temperature increase (K/min)
θcoverage
applied to zeolites, is known to modify the activity as
well as the microporous volume and the external surface
of these catalysts. Then, the accurate determination of the
external surface area, microporous volume and acidity of
zeolite is of major importance for understanding its catalytic
behavior.
The feedstocks for FCC units have been changing
throughtout the years. Heavier feedstocks are commonly
used by refiners for several reasons such as: price, availabil-
ity, etc., pushing the process to its limit. By using heavier
feedstocks, the process tend to be more diffusion controlled,
jeopardizing the characteristics of activity and selectivity
of USY zeolites. Thus, a reduction of the crystallite size in
the FCC catalysts is a valid solution to have a FCC process
more robust, which can meet the challenges of refining
heavier feedstocks.
In this work the effect of HY crystallite size (0.4 and
0.9 m) on several catalyst properties is investigated: (a)
the number, strength, and distribution of acid sites are stud-
ied using temperature-programmed desorption of ammonia,
with acidity evaluated using the higher temperature desorp-
tion peak; (b) FTIR analysis of pre-adsorbed pyridine is used
to determine the relative amount of Brönsted and Lewis acid
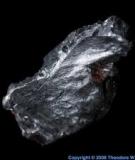
sites on the samples; (c) SEM is used to confirm particle
and pellets size; (d) nitrogen and argon isotherms performed
at 77 K are studied to determine the following microstruc-
ture properties: specific surface area, pore volume and pore
size distribution. In this respect, the characterization of these
catalysts is very relevant in view of their value to establish,
in a novel Chemical Reactor Engineering Center (CREC)
Riser Simulator [10,11], the extent of diffusion control in
FCC catalysts and the influence of this phenomenon on the
overall reaction rate.
2. Experimental
2.1. Catalysts preparation
This study was carried out using two commercial USY
zeolites with different crystals size from Tosoh Corpora-
tion (0.4 and 0.9 m). HYZ-SC and HYZ-LC refer to small
and large crystal zeolites, respectively. Both zeolites have
a similar SiO2/Al2O3ratio (5.6 and 5.7 mol/mol). In order
to remove the traces of Na, both zeolites were transformed,
through ion exchange, to the ammonium form with a 1 M
NH4NO3solution at 80 ◦C for 6 h under stirring conditions.
This operation was followed by filtration and three water
washings. The zeolite samples were dried in air at 90 ◦C for
2 h and following this at 120 ◦C for 6 h. The general char-
acteristics of the zeolites used in this study are reported in
Table 1.
These parent zeolites were spray-dried using kaolin, as
filler, and silica sol, as binder. The formed catalyst pel-
lets had a particle size in the range of 60 m. Such a
catalyst particle size was needed for evaluating catalyst
activity in a fluidized CREC Riser Simulator unit. The
catalyst composition was 30 wt.% zeolite, 50 wt.% kaolin,
and 20 wt.% silica sol. The pelletized catalysts were ion
exchanged following the procedure described above. Once
the ion exchange operation completed, the catalysts were
calcined at 600 ◦C for 2 h in an oven to remove all volatile
material. After that, the catalysts were treated with steam,
in order to increase its thermal and hydrothermal stability.
Steaming conditions were 100% steam for 5 h at 760 ◦C
(Scheme 1).
The FCC-steamed catalysts, prepared from small crys-
tal zeolites (HYZ-SC), are referred here to as CAT-SC,
while the catalysts derived from large crystals (HYZ-LC)
are called CAT-LC. CAT-LC-BS and CAT-SC-BS are also
acronyms for the catalyst samples before the steaming
treatment.
The unit cell size for the catalyst samples was determined
using X-ray diffraction following ASTM D-3942-80. Na
content was measured by EDX. Table 2 reports the catalyst
main properties following catalyst pretreatment.
2.2. Catalysts characterization
2.2.1. NH3-TPD
The apparatus used for TPD test was the Micromeritics
AutoChem II analyzer. A catalyst sample (0.1–0.3 g) con-
tained in a quartz container was degassed for 2 h at 500 ◦C.
Table 1
Properties of studied USY
HYZ-SC HYZ-LC
SiO2/Al2O3(mol/mol) 5.6 5.7
Unit cell size (Å) 24.49 24.51
HY crystallite size (m) 0.4 0.9

G. Tonetto et al. / Applied Catalysis A: General 270 (2004) 9–25 11
Scheme 1. Diagram of the Riser Simulator experimental setup and accessories.
The sample was brought to saturation using an NH3/He gas
mixture (4.55% ammonia, 95.55% helium). In order to know
the acid strength, ammonia adsorption was carried out for
1 h at various temperatures: 100, 140, 160, 190, 240, and
300 ◦C. The ammonia flow was then switched off, and re-
placed by an inert purge gas (He) at a rate of 50 ml/min for
1 h and this to remove physically adsorbed ammonia. The
samples were purged at the same temperature of ammonia
adsorption. Then, the temperature was raised up at a rate of
15 ◦C/min. As the temperature was increased, the ammonia
desorbed as it gained enough energy to overcome their ac-
tivation energy barrier.
Furthermore, the energy of desorption, associated with the
high-temperature desorption peak, was calculated. With this
aim, NH3-TPD chromatograms were collected at different
heating rates (7, 10, 15, 20, and 30 ◦C/min). During this set
of experiments, adsorption of ammonia and the subsequent
purge of the catalysts were carried out at the set temperature
of 100 ◦C, for a period lasting 1 h. The total flow used was
50 std ml/min STP.
Table 2
Properties of studied catalysts
CAT-SC CAT-LC
Zeolite contenta(%) 31 29
Unit cell size (Å) 24.28 24.27
HY crystallite size (m) 0.4 0.9
Relative dealuminationb(%) 83.3 88.2
aTaken in account specific surface area (BET) for zeolites, matrix and
catalysts before steaming.
bAccording to Ref. [13].
2.2.2. Pyridine IR
The zeolite samples were dried, in situ, by heating under
N2flow at 550 ◦C and cooled to 100 ◦C. The samples were
maintained at this temperature and saturated with pyridine
using a N2contains pyridine stream. Adsorption of pyridine
was performed for a 60 min period. Then, the zeolite was
flushed with N2, at the same temperature for 90 min, and
this to remove weakly adsorbed pyridine species.
In order to establish the acid strength, following pyridine
adsorption, zeolites samples were purged at different tem-
peratures: 100, 150, 200, and 300 ◦C.
Zeolites samples were placed later between NaCl win-
dows and infrared spectra were recorded using a Bruker
IFS55 FTIR spectrometer operating at 4 cm−1resolution and
100 scans. FTIR spectra were collected at room temperature.
FCC catalyst pellets (60 m), zeolites dispersed in a
kaolin and silica-sol matrix, as well as reference pellets
constituted by kaolin and silica-sol only, were ground into a
fine powder with an agate mortar. For these samples, diffuse
reflectance infrared spectroscopy (DRIFTS) measurements
were obtained at the same conditions that for the zeolite
samples using the same Bruker IFS55 FTIR spectrometer
and a DRIFTS cell (HVC-DRP, Harrick Scientific). The
sample holder had 50 mg capacity.
2.2.3. N2and Ar isotherms
Nitrogen and argon adsorption measurements were car-
ried out at 77 K on an ASAP 2010 automatic adsorption
analyzer equipped with the micropore options (from Mi-
cromeritics). Before the measurements, samples weighing
from 0.1 to 0.3 g were placed in the degas port of the adsorp-
tion apparatus, degassed at 100 ◦C for 1 h and at 300 ◦C for

12 G. Tonetto et al. / Applied Catalysis A: General 270 (2004) 9–25
10 h. The data from the low-pressure region were obtained
by contacting the sample with successive increments of anal-
ysis gas (doses of 3 cm3/g STP of sample) and waiting un-
til thermal equilibration was reached. Adsorption isotherms
were measured under the relative pressure range, based on
the saturation vapor pressure, from ∼10−6to 1.
2.2.4. SEM-EDX
A Hitachi S-4500 field emission SEM fully equipped with
an EDAXTM EDX system was used in the present study.
The Hitachi S-4500 was employed for obtaining the imaging
of the samples (electron beam voltages: 5 kV, resolution:
2–60 m) with samples being Au coating to reduce charging
problems. The EDX system was also used to measure Na
contents.
2.3. Catalytic experiments
Experiments with CAT-SC and CAT-LC were car-
ried out using the CREC fluidized Riser Simulator in-
vented by de Lasa [10,11]. The model compounds were
1,2,4-trimethylbenzene (1,2,4-TMB) and 1,3,5-triisopro-
pylbenzene (1,3,5-TIPB) with molecular diameter of 7.4 and
9.4 Å, respectively. Selection of the model compounds al-
lows catalytic reaction condition with or without diffusional
constrains. A Hewlett Packard 5890A Gas Chromatograph
quantifies reaction products using a flame ionization detec-
tor (FID) and a HP-1 25 m capillary column of cross-linked
methyl silicone with an outer diameter of 0.20 mm and an
internal diameter of 0.33 m. A more detailed description
of various components of the Riser Simulator and the se-
quence of injection and sampling can be found in Atias
et al. [1]. An average of 10 experimental runs were car-
ried out at different temperatures (350, 400, 450, 500, and
550 ◦C) and residence times (3, 5, and 7 s), given a total of
about 150 experiments for every catalyst.
3. Results and discussion
3.1. Catalysts preparation
Tables 1 and 2 report the catalyst properties of the samples
studied. Na content was found negligible in all samples after
ion exchange, which demonstrates the effectiveness of the
method used for sodium remove. Moreover the values for the
unit cell sizes (UCS), zeolites content and specific surface
area (Table 6) were found to be consistent with typical for
FCC catalysts [12,46].
For both zeolites it was observed (Table 1) that the initial
unit cell size of 24.5 Å was reduced to 24.28 Å (Table 2)
given both samples were subject to close steaming condi-
tions.
In fact, under steaming, dealumination takes place and as
a result, there is a higher abundance of Si–O bonds, which
are shorter than Al–O bonds. Given that the UCS parameter
is related to the abundance of Al–O bonds in the crystalline
structure framework, dealumination has to lead to a UCS re-
duction. The extent of dealumination can be evaluated as the
difference of UCS values between the treated and untreated
samples [13]:
dealumination (%)=UCS(untr)−UCS(tr)
UCS(untr)−24.238 ×100 (1)
where UCS(tr) refers to the steam-treated sample and
UCS(untr) refers to the untreated USY sample. It can be
noticed in Table 2 that both CAT-SC and CAT-LC samples
present a relative dealumination above 80% and can be
considered as direct consequence of the severe steaming
treatment [13].
3.2. NH3-TPD
3.2.1. Total acidity and acid distribution
Acid sites of zeolites were characterized by temperature-
programmed desorption using NH3as basic probe molecule
(NH3-TPD). The total acidity and acid distribution can be
obtained from the peak area, position, and shape, respec-
tively. NH3-TPD can distinguish sites by sorption strength
only and, in fact, it cannot differentiate between Brönsted
from Lewis-type sites [15,16].
At first, it is important to highlight that it was found in
separate experiments, developed with catalyst pellets made
of the silica matrix only, that the NH3adsorption on the
silica matrix was not significant.
NH3-TPD spectra of HYZ-SC and CAT-SC-BS samples
are reported in Figs. 1 and 2. Both samples present close
NH3desorption profiles. This proves that the pelletization
process does not strongly affect catalyst acidity. When total
acidity of zeolite and before-steaming catalyst is compared,
the difference is less than 13% (Table 3, referring to 190 ◦C
NH3adsorption temperature).
Figs. 1 and 2 also show that when the NH3adsorption
was performed at temperatures below 240 ◦C, NH3-TPD
curves display two overlapped peaks. The high-temperature
peak can be related to desorption of ammonia from both
Table 3
Temperature-programmed desorption of studied samples: amount of am-
monia desorbed (in mmol NH3/g HY) for different ammonia adsorption
temperature
Sample Ammonia adsorption/purge temperature (◦C)
100 140 160 190 240 300
HYZ-LC 1.61 1.43 1.33 1.30 1.48 0.98
HYZ-SC 1.70 1.43 1.22 1.37 1.42 0.88
CAT-LC-BS 0.99 0.96 0.95 1.14 1.02 0.66
CAT-SC-BS 1.14 1.13 0.95 1.19 1.20 0.80
CAT-LC 0.57 0.21 0.20 0.17 0.13 0.08
CAT-SC 0.34 0.18 0.15 0.19 0.13 0.08
Experimental condition—Q:50cm
3/m; temperature rate: 15 ◦C/min; gas
mixture: 4.52% NH3(balance in He).

G. Tonetto et al. / Applied Catalysis A: General 270 (2004) 9–25 13
Temperature (˚C)
50 100 150 200 250 300 350 400 450 500 550
TCD Concentration
0.0
0.2
0.4
0.6
0.8
100˚C
140˚C
160˚C
190˚C
240˚C
300˚C
Fig. 1. Thermal desorption chromatograms of ammonia for HYZ-SC sample. Experimental conditions—temperature rate: 15 ◦C/min, helium flow:
50 cm3/min. NH3adsorption temperature are indicated in the graphic.
strong Brönsted and Lewis sites [14,17]. On the other hand,
the low-temperature peak can be attributed to a number of
causes: (a) desorption of weakly adsorbed NH3on weak acid
sites or non-acidic site [13], (b) weak acid Brönsted [17],
Temperature (˚C)
5050 100 150 200 250 300 350 400 450 500 550
TCD Concentration
0.00.0
0.1
0.2
0.3
0.4
0.5
100˚C
140˚C
160˚C
190˚C
240˚C
300˚C
Fig. 2. Thermal desorption chromatograms of ammonia for CAT-SC-BS sample. Experimental conditions—temperature rate: 15 ◦C/min, helium flow:
50 cm3/min. NH3adsorption temperature are indicated in the graphic.
(c) Lewis sites [18], silanol groups [14], and (d) formation
of NH4+(NH3)n(n≥1) groups [19,20].
In catalytic cracking, the active centers are Brönsted acid
sites in the zeolite framework [21]. Therefore, the amounts


%20--%3e%3cdefs%3e%3cstyle%3e%20.st0%20{%20fill:%20%23fff;%20}%20.st1%20{%20fill:%20%237800fa;%20}%20%3c/style%3e%3c/defs%3e%3cpath%20class='st1'%20d='M117.78,12.18H43.11c2.9,3.47,4.65,7.94,4.65,12.82,0,5.6-2.3,10.66-6.01,14.29h76.02l7.22-13.56-7.22-13.56Z'/%3e%3cg%3e%3cpath%20class='st0'%20d='M53.58,26.17h-.59v-1.46h.59v-4.96h2.83c1.78,0,2.67.94,2.67,2.82v5.76c0,1.87-.89,2.81-2.67,2.81h-2.83v-4.96ZM55.36,21.37v3.34h1.1v1.46h-1.1v3.34h1.01c.61,0,.91-.37.91-1.1v-5.93c0-.74-.3-1.1-.91-1.1h-1.01Z'/%3e%3cpath%20class='st0'%20d='M65.99,31.14h-1.8l-.31-2.07h-2.19l-.31,2.07h-1.64l1.82-11.39h2.62l1.82,11.39ZM65.28,18.04c-.25.46-.51.77-.75.94-.21.15-.47.22-.79.22-.26,0-.57-.07-.92-.22l-.38-.15c-.14-.05-.26-.07-.37-.07-.3,0-.53.18-.71.54l-.91-.68c.25-.46.51-.77.75-.94.21-.14.48-.21.79-.21.26,0,.57.07.92.21l.38.15c.14.05.26.07.37.07.3,0,.53-.18.71-.54l.91.68ZM61.91,27.52h1.73l-.87-5.76-.87,5.76Z'/%3e%3cpath%20class='st0'%20d='M74.53,26.89v1.52c0,1.91-.89,2.86-2.67,2.86s-2.67-.95-2.67-2.86v-5.93c0-1.91.89-2.86,2.67-2.86s2.67.95,2.67,2.86v1.11h-1.69v-1.22c0-.75-.31-1.12-.93-1.12s-.93.37-.93,1.12v6.15c0,.74.31,1.11.93,1.11s.93-.37.93-1.11v-1.63h1.69Z'/%3e%3cpath%20class='st0'%20d='M81.4,31.14h-1.8l-.31-2.07h-2.19l-.31,2.07h-1.64l1.82-11.39h2.62l1.82,11.39ZM75.9,19.2l1.52-1.91h1.71l1.51,1.91h-1.61l-.76-.95-.75.95h-1.61ZM77.32,27.52h1.73l-.87-5.76-.87,5.76ZM83.1,15.99l-1.76,1.91h-1.26l1.17-1.91h1.86Z'/%3e%3cpath%20class='st0'%20d='M84.86,19.75c1.78,0,2.67.94,2.67,2.82v1.48c0,1.87-.89,2.81-2.67,2.81h-.85v4.28h-1.79v-11.39h2.64ZM84.01,21.37v3.86h.85c.58,0,.87-.36.87-1.08v-1.71c0-.71-.29-1.07-.87-1.07h-.85Z'/%3e%3cpath%20class='st0'%20d='M93.51,19.75c1.78,0,2.67.94,2.67,2.82v1.48c0,1.87-.89,2.81-2.67,2.81h-.85v4.28h-1.79v-11.39h2.64ZM92.66,21.37v3.86h.85c.58,0,.87-.36.87-1.08v-1.71c0-.71-.29-1.07-.87-1.07h-.85Z'/%3e%3cpath%20class='st0'%20d='M98.8,31.14h-1.79v-11.39h1.79v4.88h2.03v-4.88h1.83v11.39h-1.83v-4.88h-2.03v4.88Z'/%3e%3cpath%20class='st0'%20d='M105.36,24.55h2.46v1.62h-2.46v3.34h3.09v1.63h-4.88v-11.39h4.88v1.63h-3.09v3.18ZM108.17,17.29l-1.76,1.91h-1.26l1.17-1.91h1.86Z'/%3e%3cpath%20class='st0'%20d='M112.2,19.75c1.78,0,2.67.94,2.67,2.82v1.48c0,1.87-.89,2.81-2.67,2.81h-.85v4.28h-1.79v-11.39h2.64ZM111.35,21.37v3.86h.85c.58,0,.87-.36.87-1.08v-1.71c0-.71-.29-1.07-.87-1.07h-.85Z'/%3e%3c/g%3e%3ccircle%20class='st1'%20cx='25'%20cy='25'%20r='20'/%3e%3cpath%20class='st0'%20d='M32.78,19.27c2.92,0,4.43,2.55,5.28,5.33l.71,2.17c.14.38-.33.75-.71.75h-5.61c.19-.33.24-.71.09-1.08l-.75-2.45c-.43-1.32-.99-2.64-1.79-3.77.75-.57,1.65-.94,2.78-.94h0ZM25,18.38c3.25,0,4.9,2.78,5.89,5.89l.76,2.45c.14.42-.33.8-.8.8h-11.69c-.42,0-.94-.38-.8-.8l.75-2.45c.99-3.11,2.64-5.89,5.89-5.89h0ZM25,11.35c1.74,0,3.11,1.37,3.11,3.11s-1.37,3.11-3.11,3.11-3.11-1.41-3.11-3.11,1.41-3.11,3.11-3.11h0ZM17.27,19.27c1.08,0,1.98.38,2.73.94-.8,1.13-1.37,2.45-1.74,3.77l-.8,2.45c-.14.38-.05.75.09,1.08h-5.56c-.42,0-.9-.38-.75-.75l.71-2.17c.9-2.78,2.41-5.33,5.33-5.33h0ZM17.27,12.91c1.51,0,2.78,1.27,2.78,2.83s-1.27,2.83-2.78,2.83-2.83-1.27-2.83-2.83,1.27-2.83,2.83-2.83h0ZM32.78,12.91c1.56,0,2.78,1.27,2.78,2.83s-1.23,2.83-2.78,2.83-2.83-1.27-2.83-2.83,1.27-2.83,2.83-2.83h0ZM27.07,28.56v.09c0,.57-.24,1.08-.61,1.46h0v.05c-.38.33-.9.57-1.46.57s-1.08-.24-1.46-.61h0c-.38-.38-.61-.9-.61-1.46v-.09h1.41v.09c0,.19.05.38.19.47v.05c.09.09.28.19.47.19s.38-.09.47-.19v-.05c.14-.09.24-.28.24-.47t-.05-.09h1.41ZM30.99,28.56v.09c0,1.65-.66,3.16-1.74,4.24-1.08,1.08-2.59,1.79-4.24,1.79s-3.16-.71-4.24-1.79l-.05-.05c-1.04-1.08-1.7-2.55-1.7-4.2v-.09h1.41v.09c0,1.27.47,2.4,1.27,3.25h.05c.85.85,1.98,1.37,3.25,1.37s2.4-.52,3.25-1.37c.85-.8,1.37-1.98,1.37-3.25v-.09h1.37ZM34.99,28.56v.09c0,2.78-1.13,5.28-2.92,7.07-1.79,1.79-4.29,2.92-7.07,2.92s-5.23-1.13-7.07-2.92c-1.79-1.79-2.92-4.29-2.92-7.07v-.09h1.41v.09c0,2.4.94,4.53,2.5,6.08,1.56,1.56,3.72,2.5,6.08,2.5s4.52-.94,6.08-2.5c1.56-1.56,2.5-3.68,2.5-6.08v-.09h1.41Z'/%3e%3c/svg%3e)