Journal of Science and Transport Technology Vol. 2 No. 4, 9-19
Journal of Science and Transport Technology
Journal homepage: https://jstt.vn/index.php/en
JSTT 2022, 2 (4), 9-19
Published online 27/12/2022
Article info
Type of article:
Original research paper
DOI:
https://doi.org/10.58845/jstt.utt.2
022.en.2.4.9-19
*Corresponding author:
E-mail address:
damndl@utt.edu.vn
Received: 30/11/2022
Revised: 10/12/2022
Accepted: 12/12/2022
Forecasting Construction Price Index using
Artificial Intelligence Models: Support Vector
Machines and Radial Basis Function Neural
Network
Tuan Thanh Nguyen1, Dam Duc Nguyen1,*, Son Duc Nguyen1, Indra Prakash2,
Phong Van Tran3, Binh Thai Pham1
1University of Transport Technology, Ha Noi, Viet Nam
2Dy. Director General (R), Geological Survey of India, Gandhinagar 82010,
India
3Institute of Geological Sciences, Ha Noi, Viet Nam
Abstract: Estimation of Construction Price Index (CPI) is important for a
market economy and it is a measure to manage construction investment costs.
This is a tool to help organizations and individuals to reduce the effort and
management of expenses for construction projects by reducing time of
procedures for calculating and adjusting the total investment for the estimation
and evaluation of contract price. The CPI is an indicator that reflects the level
of construction price fluctuations of the type of work over time. In this study,
the CPI data of Son La province, Vietnam from January 2016 to March 2022
(75 data) has been used for the modeling. Two Artificial Intelligence (AI)
models namely Support Vector Machine (SVM) and Radial Basis Function
Neural Network (RBFN) were proposed to predict the CPI based on limited
input data. Performance of the models in correctly predicting CPI was
evaluated using standard statistical indicators such as Coefficient of
Determination (R2), Root Mean Square Error (RMSE) and Mean Absolute Error
(MAE) based on the historical CPI data. The results show that performance of
both the models is good in predicting CPI, but performance of the SVM model
(R2 train = 0.915, R2 test = 0.811) is the best in comparison to RBFN model (R2
train = 0.985, R2 test = 0.733). The proposed AI models can be used to quickly
and accurately predict the CPI of an area to help management agencies,
investors, construction contractors for assessing cost of construction for the
purchase and development of properties/ infrastructures.
Keywords: Construction price index, Artificial Intelligence, SVM, RBFN.
1. Introduction
Construction projects require high
investment capital and may take many years to
complete, therefore, prior estimation of
Construction Price Index (CPI) or Construction
Cost Index (CCI) is required to properly manage
construction investment of project costs till
completion [1]. The CPI is a tool to help
organizations and individuals to prepare and
manage the cost of construction investment
projects in advance to reduce effort, time and
procedures for calculating and adjusting the total
investment. The use of CPI contributes in removing
difficulties and obstacles for investors and
contractors to build contracts considering
estimated cost of the projects. This is especially

JSTT 2022, 2 (4), 9-19
Nguyen et al
10
effective when the market has fluctuations of
construction prices due to domestic and foreign
economic factors; and social issues which are
affected by many micro and macroeconomic
factors such as Prices of fuel, cost of construction
materials and labor prices [2]. This volatility can
have a great impact on business activities,
especially for large and long-term projects [3].
In the process of determining the CPI, the
specialized construction agency needs to evaluate
the price indicators based on the available
information about the price index of the region and
the neighborhood to ensure the appropriate
indicators considering fluctuations of the regional
market, where there is no great difference between
localities [4]. The CPI reflects price fluctuations in
the construction market in different localities. While
determining the CPI we have to choose a category
and number of certain representative works for the
calculation of this Index [3]. The average CPI in the
selected period, exclude some expenses for
compensation, support and resettlement, loan
interest during the construction time; and the initial
working capital for business. The cost structure of
the CPI calculation must be consistent with the cost
structure depending on the regulations, on the
construction management investment costs, which
is fixed Until there is a change [5]. The provincial
People's Committee is responsible for building,
managing and operating the database system to
serve the state management of construction
investment costs in the fields of industry and local
construction. To limit the potential financial risks for
managers, there is a need for a CPI to predict
expected costs.
In recent years, many forecasting techniques
have been developed to handle complicated issues
of forecasts. In general, there are two basic
methods to predict construction costs, (1)
traditional qualitative methods, and (2) quantitative
methods. The traditional method must determine
the relationship between prediction or dependent
variables and independent variables [6]. Previous
researchers have predicted the future CPI based
on traditional methods [7,8]. The main
disadvantage of the traditional method is to identify
all the variables to be predicted for dependency
variables. The methods are represented in the time
series analysis, which are a range of data points
listed at evenly spaced in the order of time [9]. Time
series methods try to predict future data values of
a series based on the analysis of previous data
values by using internal statistics between data.
Elfahham (2019) has proposed a multivariable time
series to provide to the parties involved in building
a reliable tool to expect the price of the upcoming
projects, but currently popular time series
prediction models do not show promising results,
especially in medium and long-term forecasting [1].
Quantitative methods such as Artificial
Neural Network (ANN) are one of the Artificial
Intelligence (AI) calculation systems that simulate
the human brain's learning ability [10,11]. The
neural network is applied to forecast escalation in
the cost of high-speed projects with reasonable
accuracy [12]. Kim et al (2004) show that ANN is
most beneficial to long-term forecasts than other
statistical methods based on limited historical data
[13]. Some studies have tried to combine more
predictable tools in a model. Cheng et al (2013)
Building a forecast combination model helps to
identify the best forecasting and based on
optimizing the various combinations of the project
cost using forecasting models [14]. The results of
applying the model to the actual project should
show high accuracy and minimum risk of major
errors. Gwang-Hee Kim (2004) applied three
techniques MRA, NN and CBR to estimate the
construction cost of Korean residential buildings.
These three approaches used data containing 530
historical costs. The results show that the NN
machine learning model is more accurate than the
CBR or MRA model [13].
As the model development is continuous
process, so in this study we have further explored
other two good Machines Learning (ML) models
namely Support Vector Machines (SVM) and
Radial Basis Functions Networks (RBFN) to

JSTT 2022, 2 (4), 9-19
Nguyen et al
11
forecast CPI using avialble construction cost data
of Son La Province, Vietnam. The advantage of the
SVM algorithm is that it works well for large data
samples and often gives results that are superior to
other algorithms in supervised learning. On the
other hand RBNF model has advantage of easy
design, good generalization and strong tolerance
to input noise besides online learning ability. The
proposed models’ algorithms were developed using
Weka 3.8.4 software. The Weka is free software
available under the GNU General Public License.
The results of this study would be useful in
quickly and accurately predicting CPI to the
management agencies, investors, construction
contractors to pre-plan the construction investment
costs. This will also help in suitably adjusting
changing construction cost with time.
2. Preparation of database
In most of the world, the construction price
indicators are announced by official state agencies
[15]. The CPI is usually published on the official
state agency website (for example, the Ministry of
Construction or the Department of Construction).
The quotation may be done on a quarterly, half -
year or annual basis. In neighboring countries as
well as many other parts of the world, the
construction price index is assessed based on the
balance of supply and demand of the market. The
CPI is distinguished by the type of work, area and
time of quotation [16]. In addition, they are
expressed by the ratio of construction costs at
the time of comparison with the construction cost
at the time of reference. Therefore, the CPI
shows the increase or decrease of construction
costs over time [17].
In Vietnam, data information on
construction norms, construction prices,
construction investment capital, CPI issued or
announced by competent state agencies.
Database of construction investment projects,
construction contracts collected through
investigations, surveys or provided by
organizations and individuals under the
coordination, information sharing mechanism
and information. Periodic statistical reporting
regime [18].
The data in this study is of Son La province
CPI from January 2016 to March 2022 (75 data),
which is providing a clear picture of economic
changes each year. This data is based on several
input parameters such as material, labor,
construction machinery and equipment which are
affecting cost of the construction. The data was
randomly divided into 70% (53 data from Jan 2016
to Dec 2020) for the training process and 30% (22
data from Jan 2021 to March 2022) for the process
of verification (validation) [19]. In order to evaluate
the accuracy of performance of the models in
correctly predicting CPI, standard statistical
indices: Root Mean Square Error (RMSE), Mean
Absolute Error (MAE), Coefficient of Determination
(R2) were used.
3. Models and Methodology of Validation
3.1. Radial Basis Function Networks (RBFNs)
Radial Basis Function Networks (RBFNs), a
popular alternative to the MLP Neural Networks,
are defined as a supervised neural networks for
solving modeling problems in poly dimensional
space [20]. The architecture of this network is
designed comprising of three layers namely input
layer consisting of 14 neurons, hidden layer
(referred to as the RBF units) which takes in a set
of inputs and produces outputs through activation
function, and an output layer that contains one
neuron. The input data is processed by the RBF
units using the K-means algorithm to reduce its
dimensionality and then transform the data to a
new space [21]. The learning procedure of the
RBFN is carried out in two phases: (i) the numbers
of clusters (hidden neurons) are calculated using
the K-means algorithm and (ii) optimal estimation
of the kernel parameter. The RBFN is trained to
optimize kernel parameters to minimize the error E
as follows:
2
1
( ( )) )
nm
i i j j
ij
E y O x w
=
= − +
(1)

JSTT 2022, 2 (4), 9-19
Nguyen et al
12
where wj is the load coefficient and O(x) is
the output of the RBF network:
The output value of the output layer is
calculated as:
1
()
m
jj
j
O x w h
=
=
(2)
2
2
( ) exp( )
j
j
xc
hx r
−
=−
(3)
where hj(x) is output value; cj is the center
point of the basis function; r is radius of the basis
function, and m is the number of clusters.
3.2. Support Vector Machine (SVM)
The SVM is a machine learning algorithm
that produces an optimal separating hyperplane to
differentiate classes that overlap and are not
separable in a linear way. It was originally
developed for classification purposes; however, it
can also be used for regression problems [22]. In
this study, SVM for regression (SVR) was
implemented. SVR is a kernel-based learning
regression method that was proposed by
Cherkassky (2020) [23]. It is based on the
computation of a linear regression function in a
multidimensional feature space. Hence, modeling
a linear regression hyperplane for nonlinear
relationships is possible with the feature space.
Two forms of SVM regression, namely, “epsilon (ε)-
SVR” and “nu (v)-SVR,” are commonly used in the
SVM model. The original SVM formulations for
regression (SVR) uses parameter cost (c) and
epsilon (ε) to apply a penalty to the optimization for
points that are incorrectly predicted. Zhang et al.
[24] have utilized SVR in environmental monitoring
studies to predict SOC. In SVM regression, the
Gaussian Radial Basis Function (RBF) kernel was
applied. We employed the RBF kernel to obtain an
optimal SVM regression model which is important
to obtain the best set of penalty parameters C and
kernel parameters gamma (γ) for the SOC training
data. In the present study, we evaluated the
training set and then tested the model performance
on the validation set.
3.3. Validation methods
To evaluate and compare the models’
performance standard statistical measures namely
coefficient of determination (R2), root mean square
error (RMSE) and mean absolute error (MAE) were
used by matching the measured and estimated
values. R2 is an important criterion in regression
analysis. Values of R2 between the predicted result
and the actual outcome, ranges from 0 to 1. A high
R2 value indicates a good correlation between the
predicted value and the actual value. For the
accuracy assessment, training data was used in
the construction of the models, whereas separate
testing data was used for the validation of the
models [25].
RMSE is an error measurement of the mean
squared difference between the model's predicted
and actual outputs [26], while MAE measures the
mean error between them. Compared with R2,
lower RMSE and MAE values indicate better
performance of AI, ML algorithms. The formula for
calculating the above three criteria can be found in
the documents [27-31].
2
2
2
ˆ
()
1()
i
i
yy
Ryy
−
=− −
(4)
1
1ˆ
N
i
i
MAE y y
N=
=−
(5)
2
1
1ˆ
()
N
i
i
RMSE y y
N−
=−
(6)
Where:
ˆ
y
predicted value of y;
y
mean
value of y;
4. Results and Discussion
Analysis of results (Table 1) show that SVM
model has lower training efficiency but better
verification value than RBFN model. The RMSE
error value of the SVM model on training and
testing data are 1.338 and 2.009, respectively,
whereas for the RBFN model these values are
0.561 and 2.055, respectively. The value of MAE
for SVM model on training data is 0.789 and for the
testing it is 1.19, whereas for the RBFN model it is

JSTT 2022, 2 (4), 9-19
Nguyen et al
13
0.269 for training and 1.297 for verification
(validation/ testing).
Table 1. RMSE, MAE analysis of the models
using data
Parameters
Training
Test
RBFN
SVM
RBFN
SVM
R2
0.985
0.915
0.733
0.811
RMSE
0.561
1.338
2.055
2.009
MAE
0.269
0.789
1.297
1.19
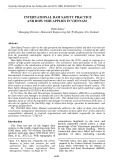
The analysis of R² results (Fig.1) show that
both the models have a good value on training data
(SVM: 0.915 and RBFN: 0.985), whereas R² value
for the SVM model is better (R² = 0.811) than the
RBFN model (R² = 0.733) on the testing/ validation
data. R² results show that the predictive capability
of CPI of both the models is good.
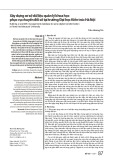
The cumulative Frequency-Error chart of
SVM and RBFN models for the training phase is
presented in Fig.2 (a, c) and for the verification
stage in Fig.2 (b, d). Analysis of results show that
the error values corresponding to the training data
set and the verification data set are small. With
SVM model, the percentage of samples with errors
between the test value is in the range of [-0.5; 1],
similar to the data set of errors in the range [0; 2].
As for the RBFN model, the percentage of samples
has an error between the test value in the range of
[-0.5; 1], similar to the data test set within the range
of [-0.5; 2].
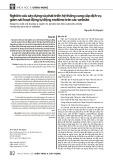
Figure 3 shows comparative results of the
forecast values and the actual calculated values of
the CPI on the training data and test data. The
results show that the values predicted and actual
in this case are close to each other, which indicate
that the model suitability for the accurate
estimation of CPI with the input data.
The actual value of price from January 2016
to January 2017 that is the CPI tends to decrease
sharply. From the beginning of January 2017 to
September 2017, the CPI was in a stable state with
negligible fluctuations, the last three months of
2017 tended to increase. In 2018, the CPI in the
first 3 months was stable but decreased in April and
kept stable until the end of August, then increased
in September and also fluctuated slightly in the last
months of the year. In 2019, the CPI remained at a
stable level. In 2020, CPI fluctuated slightly, as it
increased in the first months of the year and the
end of the year. From 2021 to the first quarter of
2022, the price index (CPI) tends to skyrocket as
the economy gradually stabilized and recovered.
Figure 4 results show, the forecast value of
the two models in also different, the SVM model
(Figure 4.a) the forecast value decreased slightly in
April and increased in May. In RBFN (Figure 4.b)
the forecast for April and May tends to decrease.
Check the current contructiom index in Son La
shows an uptrend.