
Int.J.Curr.Microbiol.App.Sci (2020) 9(4): 2756-2764
2756
Original Research Article https://doi.org/10.20546/ijcmas.2020.904.325
Estimation of Genetic Variability, Heritability and Genetic Advance
in Cucumber (Cucumis sativus L.) for Yield and Its Components under
Protected Structure
T. R. Sahoo1* and D. K. Singh2
1KVK, ICAR-National Rice Research Institute, Cuttack, Odisha-753006, India
2GB Pant University of Agriculture and Technology, Pantnagar, Uttarakhand, India
*Corresponding author
A B S T R A C T
Introduction
Cucumber (Cucumis sativus L., 2n=2x=14) is
one of the most important member of the
family cucurbitaceae including several crops
of economic importance. It is thought to be
one of the oldest vegetable crops, being
grown for at least five thousand years. It is the
fourth most important vegetable crop after
tomato, cabbage and onion in Asia. The fruits
are used for preparation of cosmetic items like
soap and cream and in many other ways
(Dhiman and Parkash, 2005). The crop is of
Asian origin and the progenitor may be
closely related to its wild relative Cucumis
sativus var. hardwickii, first found in the
International Journal of Current Microbiology and Applied Sciences
ISSN: 2319-7706 Volume 9 Number 4 (2020)
Journal homepage: http://www.ijcmas.com
The present investigation was under taken with the objectives to estimate genetic variability,
heritability and genetic advance for yield and yield contributing components of cucumber. The
experimental materials for this investigation were fourteen genotypes of cucumber consisting of
parthenocarpic, gynoecious and monecious germplasms crossed in line × tester mating design
produced thirty three hybrids (F1). Thirty three F1 crosses along with their parents were
evaluated in two environments viz. Environment 1 (March-June), Environment 2 (August-
December) inside polyhouse for evaluation of their quantitative characters. The genotypes
exhibited significant differences for all the traits under study in both environments. The
genotypic coefficients of variation and phenotypic coefficients of variation were moderate to
high for most of the characters. A wide range of variability along with high estimates of PCV
and GCV were observed for node number to first male flower, node number to first female
flower, sex ratio: (M/F), days to first male flower, fruit yield/ plant (kg), and fruit yield (q/ha)
in both the environments.indicating high variability available in the germplasm for these
characters for further improvement. High heritability coupled with high genetic advance as
percent of mean was observed for fruit length (cm), fruit weight (g), number of fruits/plant,
plant height (m), yield per plant (kg), yield per hectare (q/ha), days to first male flower, node to
first male flower, node to first female flower and sex ratio (M/F). These characters had additive
gene effect and therefore, these are more reliable for effective selection. Yield of
parthenocarpic and gynoecious cucumber lines could be improved upon by selecting superior
characters for further improvement in cucumber breeding.
Keywords
Genetic variability,
Heritability,
Genetic advance,
Additive gene
Accepted:
22 March 2020
Available Online:
10 April 2020
Article Info

Int.J.Curr.Microbiol.App.Sci (2020) 9(4): 2756-2764
2757
Himalayan mountains (foothills of Nepal) and
used by native peoples of Northern India as a
laxative (Deakin et al., 1971). India being the
primary centre of origin, it has accumulated a
wide range of variability providing good
extent for improvement in yield and other
characters of cucumber through selection.
Owing to the high cross pollination nature in
cucumber, it is very difficult to maintain the
purity in germplasm. It shows a wide range of
variability in existing germplasm and also
there is no uniformity in important traits such
as fruit size, shape, colour, quality and yield.
The parthenocarpic and gynoecious genotypes
bear all female flowers in every node
producing seedless fruits depending on pc
genes in background (Pike and Peterson,
1969). So, variability is found among
parthenocarpic and gynoecious genotypes. In
general, variability is the basic material for
any crop improvement programme.
Therefore, knowledge about the existence of
genetic variability is the useful adjunct to
carry out effective selection for improving
yield. Correlation studies helps for deciding
which trait contribute towards yield positively
or negatively.
Heritability indicates the extent to which
improvement is possible through selection
and relative degree to which a character is
transmitted from parent to offspring. Most of
the quantitative characters, which are of
economic value, are highly influenced by
environment. Therefore, some of the highly
heritable characters associated with yield,
which are influenced to a lesser degree by
environment, serve as an indicator of yield in
selection programme (Staub et al., 2006).
Additionally, nature of gene action is also
important where progress from selection
depends primarily on the additive gene action
(Afroz et al., 2015, Pati et al., 2015 and
Pradhan et al., 2016). Heritability and genetic
advance serve as useful tools for the breeders
in determining the direction and magnitude of
selection. Estimates of heritability have to be
considered with conjunction with genetic
advance as alone it does not provide idea
about expected gain in next generation
(Shukla et al., 2006). Relationship between
yield and yield associated traits are prime
important for direct and indirect selection of
traits which contribute to yield. Therefore,
this study was carried out to estimate genetic
variability, heritability, correlation and
genetic advance as percent of mean of
genotypes in relation to yield and yield
associated traits and its selection in cucumber.
The estimate of these parameters in controlled
condition like protected structures is useful in
formulating suitable selection strategy for
higher yield in cucumber. Certain genotypes
need to be selected depending upon their
stable phenotypic performance in both the
environments under a protected structure The
present investigation is taken to evaluate
available cucumber genotypes such as
parthenocarpic, gynoecious and monoecious
and their hybrids (F1) for assessing genetic
variability, heritability, correlation and
genetic advance present in various growth and
yield related traits.
Materials and Methods
The present study was conducted at Vegetable
Research Centre, G.B. Pant University of
Agriculture and Technology, Pantnagar (U.S.
Nagar) from August 2015 to December 2016
under two environmental conditions inside
polyhouse, viz. E1: Environment 1 (March-
June) and E2: Environment 2 (August-
December).Fourteen genotypes of cucumber
Fourteen genotypes of cucumber genotypes
consisting of eight parthenocarpic cucumber
lines viz., PCUCP-1, PCUCP-2 (Pant
Parthenocarpic Cucumber-2), PCUCP-3(Pant
Parthenocarpic Cucumber-3), PCUCP-4,
PCUCP-5, PCUCP-6, PCUCP-7, PCUCP-8
and three gynoecious cucumber lines viz.,

Int.J.Curr.Microbiol.App.Sci (2020) 9(4): 2756-2764
2758
PGYC-1, PGYC-2, PGYC-3 and three
monoecious cucumber lines viz., PCUC-8,
PCUC-25, and Pant Khira-1 were crossed in
line × tester mating design to obtain 33 F1,
hybrid combinations. All crosses were made
inside polyhouse and seeds from mature fruits
were collected for evaluation of 33 F1 hybrid
combinations in next season. Thirty three F1
crosses along with their parents were
evaluated during March, 2016 to December,
2016 inside polyhouse in two environments
viz., E1: Environment 1 (March-June) and E2:
Environment 2 (August-December) for
evaluation of their quantitative characters in a
randomized block design (RBD) with three
replications. All cultural operations like
fertigation with NPK (19:19:19), pruning,
staking and plant protection measures were
carried out and data for all fifteen quantitative
characters were recorded.
The experiment was laid out in a RBD with
three replications each under polyhouse with
an area of 500 m2. Each genotype within a
replication consisted of nine plants. The
spacing between rows was kept 0.6 m and
within plants 0.45 m. Initially, three seeds
were sown in a pit and later one plant per hill
was maintained after thinning. Fifteen
quantitative traits were scored on each
genotype in this experiment. Five plants were
randomly selected from each genotype in
each replication for recording of observations
for all the plant traits viz., Days to first male
flower, Node number to first male flower,
Days to first female flower, Node number to
first female flower, Sex ratio (M/F) Days to
first harvest, Days to last harvest, Internodal
length (cm), Plant height (m) Fruit length
(cm), Average fruit diameter (cm), Number of
fruits per plant, Average fruit weight (g), Fruit
yield per plant (kg), Fruit yield (q/ha). The
obtained data were subjected to analysis of
variance as per the procedure described by
Panse and Sukhatme (1961).
Statistical analysis
Genotypic coefficient of variation (GCV),
phenotypic coefficient of variation (PCV),
broad sense heritability, genetic advance and
genetic gain were computed as per standard
formulas
Coefficient of variation (%)
It is percent ratio of SD of a sample to its
means
SD
CV= ×100
X
SD = standard deviation
Parameters for variability estimation as given
by Burton and Devane (1953)
i. Phenotypic coefficient of variation (PCV)
% =
pi
i
σ -μ 100
X×
ii. Genotypic coefficient of variation (GCV)
% =
gi
i
σ
X×100
iii. Environmental coefficient of variation
(ECV) % =
ei
i
σ
X×100
Where,
pi
σ
= Phenotypic standard deviation of ith
character
gi
σ
= Genotypic standard deviation of ith
character
ei
σ
= Environmental standard deviation of ith
character
i
X
= Means of ith character
Here,
2
e
σ
(Error variance) = EMS

Int.J.Curr.Microbiol.App.Sci (2020) 9(4): 2756-2764
2759
2
g
σ
(Genotypic variance) =
2
p
σ
(Phenotypic variance) =
2
g
σ
+
2
e
σ
r = Number of
replication
Heritability
Heritability in board- sense was calculated as
per formula given by Burton and Devane
(1953) and Allard (1960).
Heritability (
2
b
h
) % =
2
g
2
p
Genotypic variance(σ)
Phenotypic variance(σ)
×100
Genetic advance
2(b) p
GA=h ×σ×K
Where,
K=Selection intensity, the value of which is
2.06 at 5% intensity selection.
Genetic advance was expressed as percent of
population mean
GA (% of mean) =
GA×100
X
Where,
X
= Mean of the character
Results and Discussion
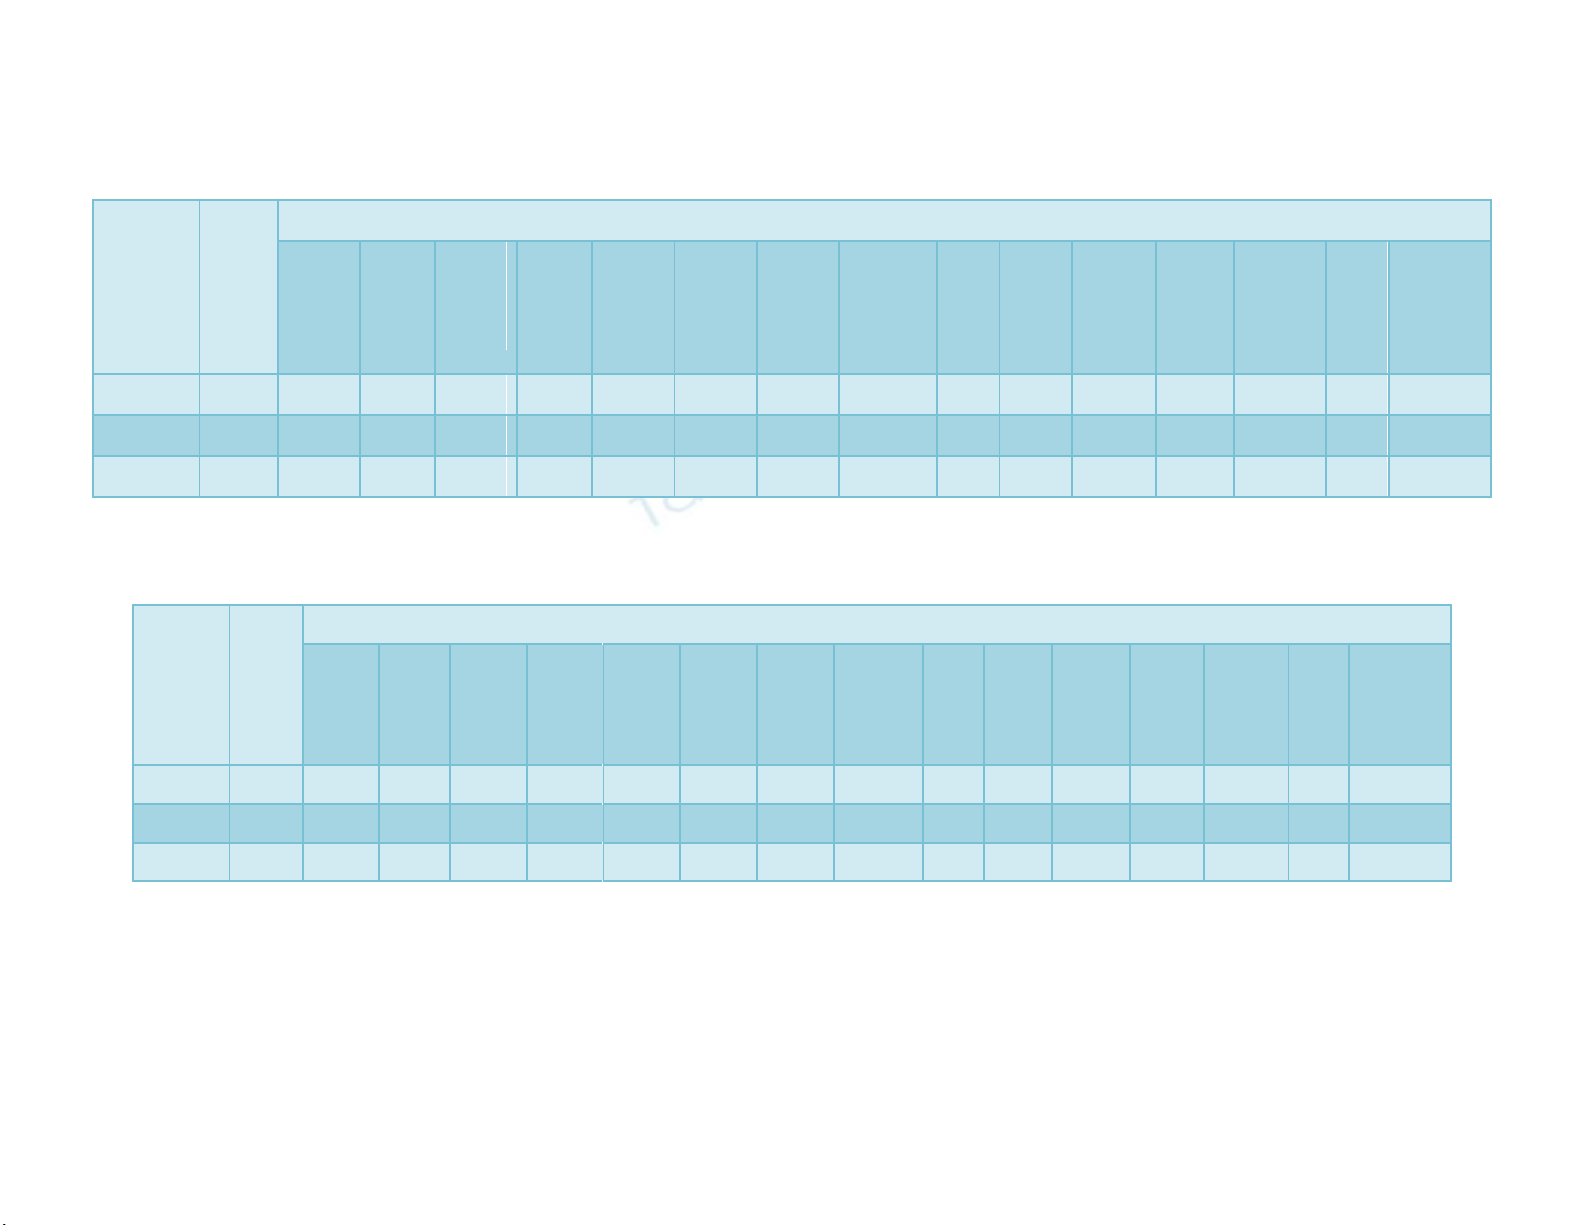
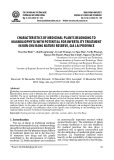
In the present investigation, the analysis of
variance (Table 1 & 2) revealed significant
differences at 1% level of significance for
almost all the characters in both the
environments under polyhouse condition
which showed a wide range of variability
among the 47 genotypes (14 parents and 33
F1s) for all 15 characters. This would help in
selecting the best genotypes from existing
collection. Reshmi (2006), Arunkumar et al.,
(2011) and Veena et al., (2012) also reported
similar results in cucumber. From the present
experiment (Table 3 & 4), PCV value was
slightly higher than GCV value for all traits
which indicated that the characters were not
influenced much by environmental effects.
High values of phenotypic coefficient of
variation as well as genotypic coefficient of
variation (> 30%) were recorded for node
number to first male flower, node number to
first female flower, sex ratio: (M/F), days to
first male flower, fruit yield/ plant (kg), and
fruit yield (q/ha) in both the environments. As
these traits were showing high GCV and PCV
values in both environments, these characters
revealed the greater extent of variability
present in the genotypes, and less difference
between GCV & PCV values, thereby
suggesting good scope for improvement
through selection of this crop. Thus, the
selection based on phenotypic performance
would be reliable. Earlier Punetha, S. (2014)
and Tiwari R. (2015), also reported direct
selection of germplasms depending upon
phenotypic performance in gynoecious and
monoecious cucumbers. Likewise, moderate
GCV and PCV values (15-30%) were
recorded for no. of fruits per plant, plant
height (m), days to first female flower, fruit
weight (g), fruit length (cm) in both
environments which could be used as
potential parameters for further improvement.
So, it can be concluded that the coefficients of
genotypic and phenotypic variability were
observed moderate to high for different
characters present under study in
cucumber.This was similar with the findings
reported by Shah et al., 2018, Kumar et al.,
2013 and Krishna Reddy, 2014 in
cucumber.In other cucurbitaceous crops,
similar findings have also been reported by
Singh and Kumar (2002) in bottle gourd,
Kutty and Dharmatti (2004) in bitter gourd,
Jat et al., (2014) in kakri.
Int.J.Curr.Microbiol.App.Sci (2020) 9(4): 2756-2764
2760
Table.1 Analysis of variance of different traits in cucumber in E1
Source of
variation
Degree
of
freedom
Mean Squares
Days to
first
male
flower
Node
number
to first
male
flower
Days to
first
female
flower
Node
number
to first
female
flower
Sex
ratio:
(M/F)
Days to
first
harvest
Days to
last
harvest
Internodal
length
(cm)
Plant
height
(m)
Fruit
length
(cm)
Fruit
diameter
(cm)
Number
of
fruits/
plant
Average
fruit
weight (g)
Fruit
yield/
plant
(kg)
Fruit yield
(q/ha)
Replicate
2
0.13
0.00
0.84
0.28
0.00
0.66
2.39
0.00
0.07
0.02
0.00
0.03
4.72
0.00
0.38
Treatments
46
996.36**
21.50**
223.78**
76.62**
302.63**
179.27**
222.11**
2.82**
2.60**
17.59**
0.70**
15.40**
2601.38**
1.06**
70749.22**
Error
92
0.16
0.02
0.42
0.25
0.04
0.72
14.40
0.03
0.09
0.02
0.01
0.64
86.29
0.03
379.40
*Significant at 5% probability level **Significant at 1% probability level
Table.2 Analysis of variance of different traits in cucumber in E2
Source of
variation
Degree
of
freedom
Mean Squares
Days to
first
male
flower
Node
number
to first
male
flower
Days to
first
female
flower
Node
number
to first
female
flower
Sex
ratio:
(M/F)
Days to
first
harvest
Days to
last
harvest
Internodal
length
(cm)
Plant
height
(m)
Fruit
length
(cm)
Fruit
diameter
(cm)
Number
of
fruits/
plant
Average
fruit
weight (g)
Fruit
yield/
plant
(kg)
Fruit yield
(q/ha)
Replicate
2
0.21
0.00
0.30
0.13
0.00
0.06
3.77
0.03
0.34
0.01
0.00
0.02
110.19
0.09
91.39
Treatments
46
791.12**
26.93**
109.81**
105.27**
242.66**
144.66**
198.25**
2.36**
3.69**
19.53**
0.64**
45.10**
3260.08**
3.45**
238031.63**
Error
92
0.14
0.01
0.30
0.21
0.01
0.81
20.49
0.07
0.15
0.01
0.00
0.87
128.15
0.04
460.95
*Significant at 5% probability level **Significant at 1% probability level


![Giáo trình Đất trồng phân bón (Nghề Bảo vệ thực vật CĐ/TC) - Trường Cao đẳng Gia Lai [Mới Nhất]](https://cdn.tailieu.vn/images/document/thumbnail/2026/20260224/hoacattuong2026/135x160/9591771994804.jpg)
![Giáo trình Kỹ thuật canh tác cây lương thực (Nghề Bảo vệ thực vật - CĐ/TC) - Trường Cao đẳng Gia Lai [Mới nhất]](https://cdn.tailieu.vn/images/document/thumbnail/2026/20260224/hoacattuong2026/135x160/12471771994805.jpg)


![Giáo trình Công nghệ sau thu hoạch (Nghề Bảo vệ thực vật - CĐ) - Trường Cao đẳng Đà Lạt [Mới nhất]](https://cdn.tailieu.vn/images/document/thumbnail/2026/20260224/hoacattuong2026/135x160/32161772096417.jpg)
