
Int.J.Curr.Microbiol.App.Sci (2020) 9(4): 2988-3000
2988
Original Research Article https://doi.org/10.20546/ijcmas.2020.904.350
Induced Genetic Variability and Scope of Selection for Yield Attributes in
Greengram (Vigna radiata L. Wilczek)
Tapas Ranjan Das1*, Bhabendra Baisakh2 and Arjun Mohan Prusti2
1ICAR- IARI Regional station, Pusa, Samastipur, Bihar-848125, India
2Deptt. of Plant Breeding and Genetics, OUAT, Bhubaneswar, Odisha, 751 003, India
*Corresponding author
A B S T R A C T
Introduction
Greengram [Vigna radiata (L.) Wilczek] is
one of the most important pulse crops, grown
from tropical to sub-tropical areas around the
world. It generates a triple benefit:income,
additional nutrient-rich food, and increased
soil fertility via biological nitrogen fixation.
Greengram is grown on more than six million
ha worldwide (about 8.5% of global pulse
area). India is the world's largest producer as
well as consumer of greengram. Though India
is the highest producer in the world,
productivity is still very low i.e. 500 kg/ha
(Anonymous. 2018). The bottlenecks in its
improvement have been the lack of variability
in different traits and improvement of one
trait on its own will affect the performance
of other traits because of genotypic
correlations between traits (Das and Baisakh,
2019). Since genetic variability is essential for
crop improvement programme, induction of
International Journal of Current Microbiology and Applied Sciences
ISSN: 2319-7706 Volume 9 Number 4 (2020)
Journal homepage: http://www.ijcmas.com
An experiment was conducted to generate a broad genetic variability through induced
mutation using physical and chemical mutagens. Three doses each of gamma rays (20, 40
and 60kR), ethyl methane sulphonate (0.2, 0.4 and 0.6%), nitrosoguanidine (0.005, 0.010,
and 0.015%), maleic hydrazide (0.01, 0.02 and 0.03%) and their combinations were
administered to the seed of two greengram varieties, Sujata and OBGG-52. In M2
generation most treatment populations exhibited a reduction in population mean and
increased in population variance for pods/plant, seeds/pod, 100 seed weight, yield/plant
and the magnitude of such changes varied with mutagens, their doses and genotypes. A
greater shift in mean and variance was observed in treatments with higher doses. The
negative shift of mean was more pronounced in MH and its combined treatments in both
varieties. In general, most of the mutagen treated populations showed a wider range of
variation than the parent varieties and the variation was in both directions. The higher
values of heritability and genetic advance with a high genotypic coefficient of variation for
most of the yield attributing traits confirmed that selection in M2 populations would be
effective in bringing the improvement in yield/plant and its direct components like
pods/plant, seeds/pod and 100 seed weight.
K e y w or d s
Genetic variability,
Greengram,
Induced mutation,
Mutagens, Yield
Accepted:
22 March 2020
Available Online:
10 April 2020
Article Info

Int.J.Curr.Microbiol.App.Sci (2020) 9(4): 2988-3000
2989
mutation by different physical and chemical
mutagens provide a powerful means of
creating new and useful variability in
greengram both in qualitative and quantitative
traits (Das et al., 2006). Information on the
extent of induced polygenic variability and
the genetic parameters for different polygenic
traits in M2 generation indicates the scope of
improvement in traits through selection. Thus
the present study was undertaken to generate
a broad genetic variability through induced
mutation using physical and chemical
mutagens and study the effect of different
mutagens, ascertain the magnitude of induced
genetic variability and other genetic
parameters of yield and its components in M2
generation.
Materials and Methods
Healthy seeds of two greengram varieties
namely Sujata and OBGG-52 were
administered mutagenic treatments with three
doses each of gamma rays (20, 40 and 60 kR),
ethyl methane sulphonate (EMS) (0.2, 0.4 and
0.6%), nitroso guanidine (NG) (0.005, 0.010
and 0.015%) and maleic hydrazide (MH)
(0.01, 0.02 and 0.03%) singly and combine
mutagens of 40 kR gamma rays with 0.4%
EMS or 0.010% NG or 0.02% MH. The
details of mutagenic treatments and the
symbols used for treatments are presented in
Table 1.
Dry seeds were irradiated with gamma rays
treatment at Bhaba Atomic Research Centre
(BARC), Trombay (India). For treatment with
EMS, NG, and MH, the seeds were presoaked
in distilled water for six hours, blotted dry and
then treated with a freshly prepared aqueous
solution of above chemical mutagens for six
hours, with intermittent shaking. For
combination treatments, seeds were first
irradiated with 40 kR gamma rays and then
treated with 0.4% EMS or 0.01 % NG or
0.02% MH solution in the same manner as
described above. After treatment, the seeds
were thoroughly washed with running water
to bleach out the residual chemicals and then
dried on blotting paper after treatment. These
treated seeds were sown as M1 and the seed of
M1 used to grow the M2 generation at Orissa
University of Agriculture and Technology,
Bhubaneswar, in two separate trials in
randomized block design (RBD) with three
replications and spacing of 25x10cm2.
Twenty normal-looking plants, excluding the
macro-mutants, were randomly chosen from
each plot and observations were recorded on
yield/plant (g) and yield attributing traits. The
mean and variance of the traits in each
treatment population were estimated and
subjected to statistical analysis. The genetic
parameters for the traits in different
mutagenic treatment populations were
calculated as follows:
Genotypic variance
2
e
2
p
2
g
Phenotypic coefficient of
variability (PCV) =
100
Mean
p
Genotypic coefficient of
variability (GCV) =
100
Mean
g
Heritability coefficient (h2) =
2
p
2
g
Heritability (h2 in %) =
100
2
p
2
g
Genetic Advance (GA) = k.h.
g
= k.h2.
p
GA (as % of mean) =
100
Mean
GA
Where,
k = Standardized selection differential for
specified selection intensity at 5%.
h = Square root of heritability coefficient
g
= Square root of genotypic variance

Int.J.Curr.Microbiol.App.Sci (2020) 9(4): 2988-3000
2990
p
= Square root of phenotypic variance
Results and Discussion
To assess the nature and magnitude of
induced polygenic variability of micro
mutations in quantitative traits like
pods/plant, seeds/pod, 100-seed weight and
yield/plant of the different mutagenic
treatments, populations of M₂ generation
were analyzed through statistical parameters
such as mean, variance, heritability and
genetic advance. Analysis of variance for
pods/plant, seeds/pod, 100-seed weight and
yield/plant of M₂ population showed
significant differences among the treatments
for the above characters in both the varieties.
The effects of different doses of different
mutagen on different genetic parameters and
in the induction of variability in different
quantitative characters are as follows:
Pods per plant (Table 2)
The population means for pods/plant in
different treatments of Sujata and OBGG-52
varied from 7.4 to 9.50 and 6.45 to 8.48,
respectively, while in their respective controls
it was 9.52 and 8.55. All mutagenic
treatments exhibited lower pods/plant than
respective controls. The negative shift in
mean was significant for E3, M1, M2, M3 in
Sujata and E3, M1, M2, M3, GM2 in OBGG-
52. The reduction in mean generally increased
with mutagen dose and the reduction was
more pronounced in EMS and MH treatments
in Sujata. The ranges of variation for pods per
plant in the control populations were 7 to 13
in Sujata and 6 to 11 in OBGG-52. The
variations in different treated populations for
pods/plant were observed 3 to 16 in the case
of Sujata and 4 to 15 in OBGG-52. Though
the induced variation in pods/plant was in
both directions, the lower mean of most
treatment populations indicated the induction
of more negative micro mutations. The
variance of pods/plant in treated populations
of Sujata and OBGG-52 ranged from 3.85 to
7.46 and 1.94 to 6.21 as against 1.82 and 1.77
in the respective controls. All the mutagenic
treatments exhibited greater population
variance than controls in Sujata whereas a
significant increase of variance over control
was observed in all mutagenic treatments
except MH treatments and GN2 in OBGG-52.
The PCV estimates in the different M2
populations varied from 20.65% (N1) to
33.11% (E3) in Sujata and 21.59% (M3) to
32.65% (E3) in OBGG-52. The GCV
estimates in the different M2 populations
varied from 15.00% (N1) to 28.64% (E3) in
Sujata and 6.39% (M3) to 26.65 % (E3) in
OBGG-52.
Heritability estimates for the trait in the
treated populations varied from 52.73% (N1)
to 75.60% (G3) and 8.76% (M3) to 71.50%
(E1, E2) in Sujata and OBGG-52,
respectively. Genetic advance (GA) at 5%
selection intensity in the treatments varied
from 2.13 (N1) to 4.25 (G3) in Sujata and
0.25 (M3) to 3.67(E1, E2) in OBGG-52. GA
as a percentage of mean ranged from 22.43 to
51.04 in Sujata and 3.90 to 44.92 in OBGG-
52. GA as a percentage of mean was higher
for all treatments except N1 in Sujata and M2
and M3 in OBGG-52.
Seeds per pod (Table 3)
The mean value for seeds per pod in the
treated population of Sujata varied from 7.01
to 8.27 and in OBGG-52 varied from 6.89 to
8.49 while in respective controls it was 8.55
and 8.51, respectively. All mutagenic
treatments of both the varieties showed a
lower mean than respective controls. The
negative shift of mean was significant for G2,
N2, N3, M1, M2, M3, GE2, GN2, GM2 in
Sujata and M3, GE2, GN2, GM2 in OBGG-
52. Though there was no definite trend, the
reduction was generally higher in MH and

Int.J.Curr.Microbiol.App.Sci (2020) 9(4): 2988-3000
2991
combined treatments. The range for seeds per
pod in the parent population was 6.4 to 9.8 in
Sujata and 7.4 to 9.6 in OBGG-52 while it
was much wider in treated populations with a
range of 3.5 to 10.5 in Sujata and 4.3 to 11.6
in OBGG-52. Though the induced variation
was in both directions, it was more in a
negative direction. The variance of seeds/pod
in M2 populations of Sujata and OBGG-52
ranged from 0.89 to 2.22 and 0.54 to 1.53,
respectively, while population variance in
respective controls were 0.76 and 0.28. All
treatments in both varieties showed higher
population variance than respective controls.
In Sujata, a significant increase of variance
over control was observed in all mutagenic
treatments except G1 and GN2. In case of
OBGG-52, significant increase of variance
over control was observed in G2, G3, E1, E2,
E3, N3, M2, M3 and GN2. The PCV
estimates in the different M2 populations
varied from 12.02% (GN2) to 20.03% (M3) in
Sujata and from 8.92% (M1) to 17.55%
(GN2) in OBGG-52. The GCV estimates in
the different M2 populations varied from
4.59% (GN2) to 16.24% (M3) in Sujata and
from 6.19% (M1) to 15.79 % (GN2) in case
of OBGG-52.
The heritability for seeds/pod in treated
populations was varied from 14.61% (GN2)
to 65.77% (M3) and 48.15% (M1) to 81.70%
(G3) in Sujata and OBGG-52, respectively.
Heritability estimates were high in all the
treatments except G1, GN2, and GM2 in
Sujata and M1 in OBGG-52. GA estimates in
treatments varied from 0.28 to 2.02 in Sujata
and 0.73 to 2.08 in OBGG-52. GA as a
percentage of mean showed a variation of
3.62% (GN2) to 27.13% (M3) and 8.85%
(M1) to 29.26 % (GN2) in Sujata and OBGG-
52, respectively. The GA estimates for the
trait in the treated populations were generally
moderate.
100-seed weight (Table 4)
The populations mean values for the 100-seed
weight (gm) in treated populations of Sujata
and OBGG-52 varied from 1.97 to 2.63gm
and 2.73 to 3.09 gm, respectively, whereas in
respective controls it was 2.67gm and
3.22gm. The negative shift of mean in
mutagenic treatments was significant for M2,
M3, and GE2 in Sujata and all except G1 in
OBGG-52. The reduction in mean generally
increased with mutagen dose in both cases.
The range of 100-seed weight in control
populations of Sujata and OBGG-52 showed
a range of variation of 2.28 to 2.96gm and
2.85 to 3.57gm, respectively. The ranges of
variation of 100-seed weight in the treated
populations of these two varieties were 1.52
to 3.54gm in Sujata and 2.1 to 3.8gm in
OBGG-52. The variance of 100-seed weight
in the treated populations varied from 0.053
to 0.1 in Sujata and 0.072 to 0.121 in OBGG-
52, whereas in respective controls the
variances were 0.03 and 0.05. Increases in
variance over control were significant in all
mutagenic treated populations of both the
varieties except for GE2 in Sujata and G1 and
GM2 in OBGG-52. The PCV estimates for
the trait in different treated populations of
Sujata and OBGG-52 ranged from 8.65 (E1)
to 11.72 (G3) and 8.68 (G1) to 12.41 (M3),
respectively. The GCV estimates for the trait
in different treated populations of Sujata and
OBGG-52 ranged from 5.05 (GE2) to
9.41(G3) and 4.8 (G1) to 9.45 (GE2),
respectively.
The treated populations of Sujata and OBGG-
52 had heritability estimates of 27.27% (GE2)
to 64.44% (G3) and 30.56% (G1) to 58.68 %
(M1), respectively. There were a lot of
differences in heritability among the
treatments and estimates were higher in all
treatments of Sujata (except E1, M3, and
GE2) and OBGG-52 (except G1 and GM2).
Genetic advance in the treatments ranged
from 0.12 (GE2) to 0.40 (G3) and 0.17(G1) to
0.42 (M1, GE2) in Sujata and OBGG-52,
Int.J.Curr.Microbiol.App.Sci (2020) 9(4): 2988-3000
2992
respectively. Genetic advance as a percentage
of mean varied from 5.43% (GE2) to 15.56%
(G3) in Sujata and 5.47% (G1) to 14.87%
(GN2) in OBGG-52.
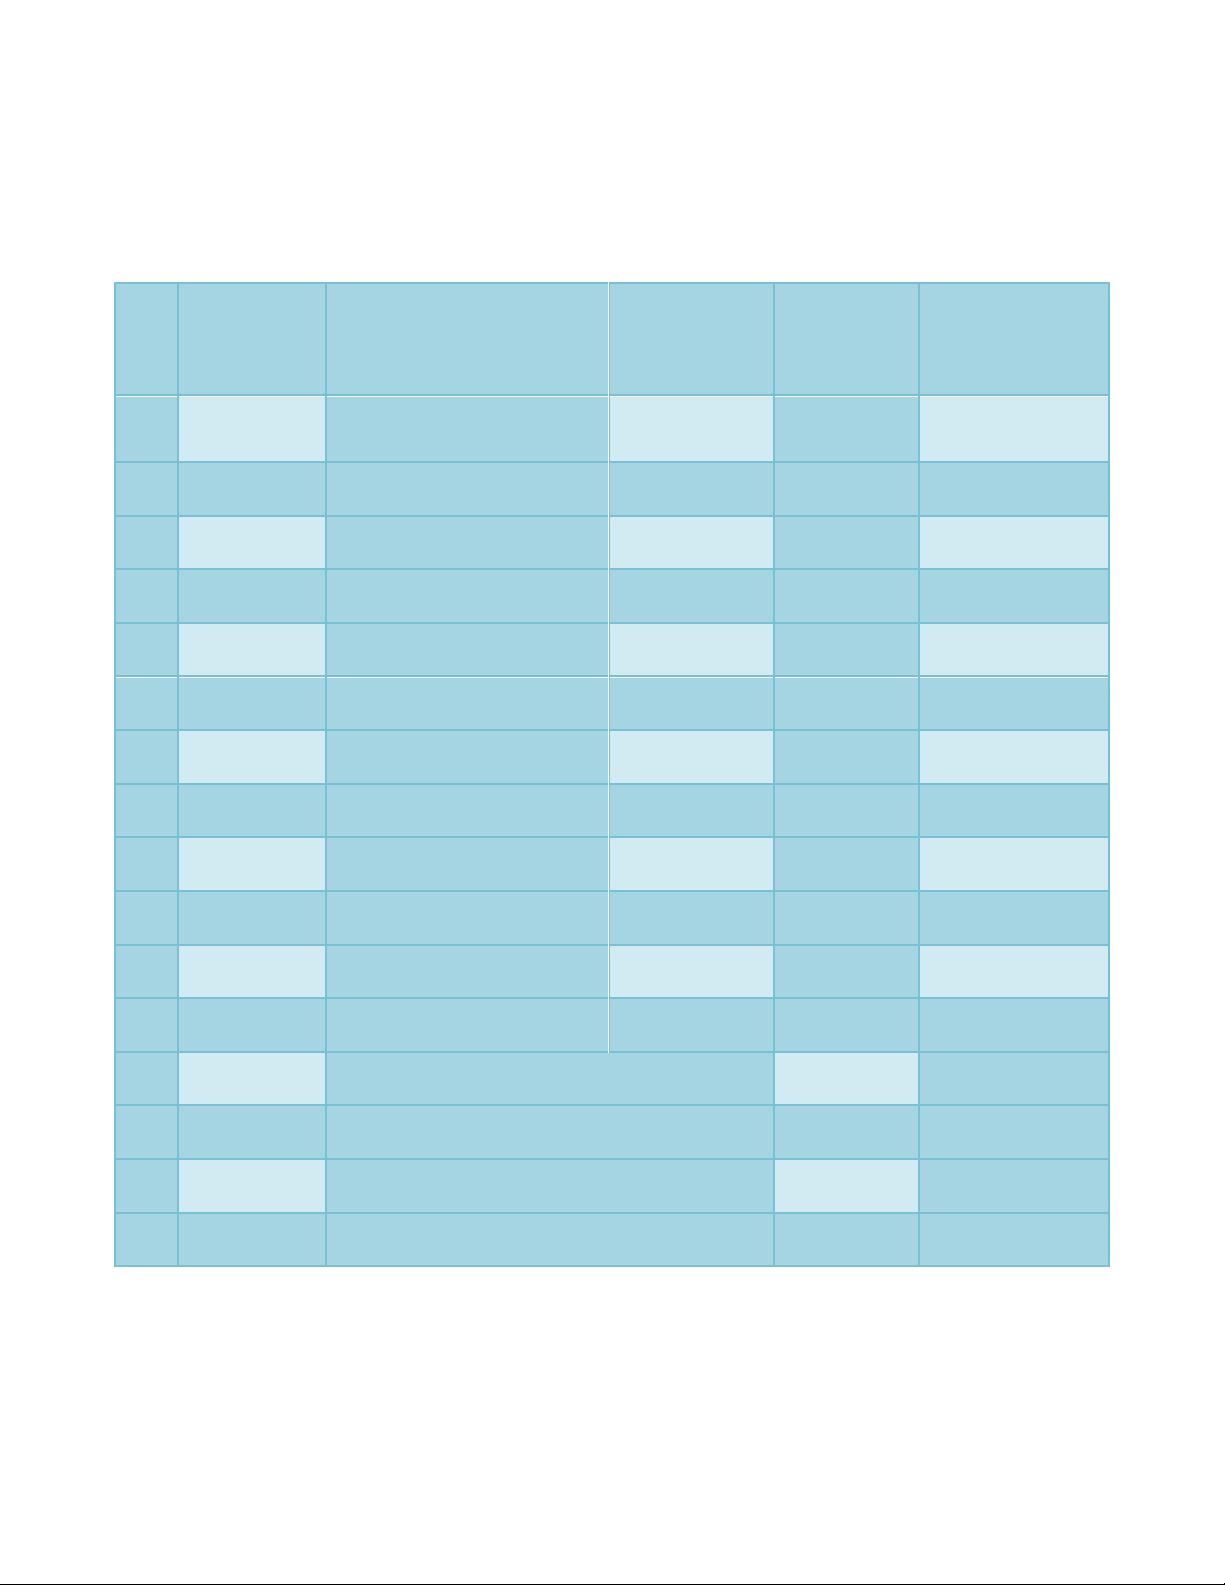
Table.1 Details of mutagenic treatments
Tr.
No.
Treatment
symbol
Mutagen
Dose/
concentration
Duration of
pre-soaking
in distilled
water
Duration of
treatment with
mutagenic
solution
1
G1
Gamma-rays
20 kR
-
-
2
G2
Gamma-rays
40 kR
-
-
3
G3
Gamma-rays
60 kR
-
-
4
E1
EMS
0.2 %
6 hours
6 hours
5
E2
EMS
0.4 %
6 hours
6 hours
6
E3
EMS
0.6 %
6 hours
6 hours
7
N1
NG
0.005 %
6 hours
6 hours
8
N2
NG
0.010 %
6 hours
6 hours
9
N3
NG
0.015 %
6 hours
6 hours
10
M1
MH
0.01 %
6 hours
6 hours
11
M2
MH
0.02 %
6 hours
6 hours
12
M3
MH
0.03 %
6 hours
6 hours
13
GE2
Gamma-rays 40 kR + EMS (0.4 %)
6 hours
6 hours
14
GN2
Gamma-rays 40 kR + NG (0.010 %)
6 hours
6 hours
15
GM2
Gamma-rays 40 kR + MH (0.02 %)
6 hours
6 hours
16
C
Control (parent)
6 hours
-
Table.2 Genetic parameters for pods per plant in different mutagenic treatment in M2 population


![Tiềm năng sản xuất hè của giống đậu xanh [Vigna radiata (L) wilczek]: Các biện pháp quản lý dinh dưỡng khác nhau tại điều kiện Nam Gujarat](https://cdn.tailieu.vn/images/document/thumbnail/2020/20200722/angicungduoc6/135x160/6761595379748.jpg)


%20--%3e%3cdefs%3e%3cstyle%3e%20.st0%20{%20fill:%20%23fff;%20}%20.st1%20{%20fill:%20%237800fa;%20}%20%3c/style%3e%3c/defs%3e%3cpath%20class='st1'%20d='M117.78,12.18H43.11c2.9,3.47,4.65,7.94,4.65,12.82,0,5.6-2.3,10.66-6.01,14.29h76.02l7.22-13.56-7.22-13.56Z'/%3e%3cg%3e%3cpath%20class='st0'%20d='M53.58,26.17h-.59v-1.46h.59v-4.96h2.83c1.78,0,2.67.94,2.67,2.82v5.76c0,1.87-.89,2.81-2.67,2.81h-2.83v-4.96ZM55.36,21.37v3.34h1.1v1.46h-1.1v3.34h1.01c.61,0,.91-.37.91-1.1v-5.93c0-.74-.3-1.1-.91-1.1h-1.01Z'/%3e%3cpath%20class='st0'%20d='M65.99,31.14h-1.8l-.31-2.07h-2.19l-.31,2.07h-1.64l1.82-11.39h2.62l1.82,11.39ZM65.28,18.04c-.25.46-.51.77-.75.94-.21.15-.47.22-.79.22-.26,0-.57-.07-.92-.22l-.38-.15c-.14-.05-.26-.07-.37-.07-.3,0-.53.18-.71.54l-.91-.68c.25-.46.51-.77.75-.94.21-.14.48-.21.79-.21.26,0,.57.07.92.21l.38.15c.14.05.26.07.37.07.3,0,.53-.18.71-.54l.91.68ZM61.91,27.52h1.73l-.87-5.76-.87,5.76Z'/%3e%3cpath%20class='st0'%20d='M74.53,26.89v1.52c0,1.91-.89,2.86-2.67,2.86s-2.67-.95-2.67-2.86v-5.93c0-1.91.89-2.86,2.67-2.86s2.67.95,2.67,2.86v1.11h-1.69v-1.22c0-.75-.31-1.12-.93-1.12s-.93.37-.93,1.12v6.15c0,.74.31,1.11.93,1.11s.93-.37.93-1.11v-1.63h1.69Z'/%3e%3cpath%20class='st0'%20d='M81.4,31.14h-1.8l-.31-2.07h-2.19l-.31,2.07h-1.64l1.82-11.39h2.62l1.82,11.39ZM75.9,19.2l1.52-1.91h1.71l1.51,1.91h-1.61l-.76-.95-.75.95h-1.61ZM77.32,27.52h1.73l-.87-5.76-.87,5.76ZM83.1,15.99l-1.76,1.91h-1.26l1.17-1.91h1.86Z'/%3e%3cpath%20class='st0'%20d='M84.86,19.75c1.78,0,2.67.94,2.67,2.82v1.48c0,1.87-.89,2.81-2.67,2.81h-.85v4.28h-1.79v-11.39h2.64ZM84.01,21.37v3.86h.85c.58,0,.87-.36.87-1.08v-1.71c0-.71-.29-1.07-.87-1.07h-.85Z'/%3e%3cpath%20class='st0'%20d='M93.51,19.75c1.78,0,2.67.94,2.67,2.82v1.48c0,1.87-.89,2.81-2.67,2.81h-.85v4.28h-1.79v-11.39h2.64ZM92.66,21.37v3.86h.85c.58,0,.87-.36.87-1.08v-1.71c0-.71-.29-1.07-.87-1.07h-.85Z'/%3e%3cpath%20class='st0'%20d='M98.8,31.14h-1.79v-11.39h1.79v4.88h2.03v-4.88h1.83v11.39h-1.83v-4.88h-2.03v4.88Z'/%3e%3cpath%20class='st0'%20d='M105.36,24.55h2.46v1.62h-2.46v3.34h3.09v1.63h-4.88v-11.39h4.88v1.63h-3.09v3.18ZM108.17,17.29l-1.76,1.91h-1.26l1.17-1.91h1.86Z'/%3e%3cpath%20class='st0'%20d='M112.2,19.75c1.78,0,2.67.94,2.67,2.82v1.48c0,1.87-.89,2.81-2.67,2.81h-.85v4.28h-1.79v-11.39h2.64ZM111.35,21.37v3.86h.85c.58,0,.87-.36.87-1.08v-1.71c0-.71-.29-1.07-.87-1.07h-.85Z'/%3e%3c/g%3e%3ccircle%20class='st1'%20cx='25'%20cy='25'%20r='20'/%3e%3cpath%20class='st0'%20d='M32.78,19.27c2.92,0,4.43,2.55,5.28,5.33l.71,2.17c.14.38-.33.75-.71.75h-5.61c.19-.33.24-.71.09-1.08l-.75-2.45c-.43-1.32-.99-2.64-1.79-3.77.75-.57,1.65-.94,2.78-.94h0ZM25,18.38c3.25,0,4.9,2.78,5.89,5.89l.76,2.45c.14.42-.33.8-.8.8h-11.69c-.42,0-.94-.38-.8-.8l.75-2.45c.99-3.11,2.64-5.89,5.89-5.89h0ZM25,11.35c1.74,0,3.11,1.37,3.11,3.11s-1.37,3.11-3.11,3.11-3.11-1.41-3.11-3.11,1.41-3.11,3.11-3.11h0ZM17.27,19.27c1.08,0,1.98.38,2.73.94-.8,1.13-1.37,2.45-1.74,3.77l-.8,2.45c-.14.38-.05.75.09,1.08h-5.56c-.42,0-.9-.38-.75-.75l.71-2.17c.9-2.78,2.41-5.33,5.33-5.33h0ZM17.27,12.91c1.51,0,2.78,1.27,2.78,2.83s-1.27,2.83-2.78,2.83-2.83-1.27-2.83-2.83,1.27-2.83,2.83-2.83h0ZM32.78,12.91c1.56,0,2.78,1.27,2.78,2.83s-1.23,2.83-2.78,2.83-2.83-1.27-2.83-2.83,1.27-2.83,2.83-2.83h0ZM27.07,28.56v.09c0,.57-.24,1.08-.61,1.46h0v.05c-.38.33-.9.57-1.46.57s-1.08-.24-1.46-.61h0c-.38-.38-.61-.9-.61-1.46v-.09h1.41v.09c0,.19.05.38.19.47v.05c.09.09.28.19.47.19s.38-.09.47-.19v-.05c.14-.09.24-.28.24-.47t-.05-.09h1.41ZM30.99,28.56v.09c0,1.65-.66,3.16-1.74,4.24-1.08,1.08-2.59,1.79-4.24,1.79s-3.16-.71-4.24-1.79l-.05-.05c-1.04-1.08-1.7-2.55-1.7-4.2v-.09h1.41v.09c0,1.27.47,2.4,1.27,3.25h.05c.85.85,1.98,1.37,3.25,1.37s2.4-.52,3.25-1.37c.85-.8,1.37-1.98,1.37-3.25v-.09h1.37ZM34.99,28.56v.09c0,2.78-1.13,5.28-2.92,7.07-1.79,1.79-4.29,2.92-7.07,2.92s-5.23-1.13-7.07-2.92c-1.79-1.79-2.92-4.29-2.92-7.07v-.09h1.41v.09c0,2.4.94,4.53,2.5,6.08,1.56,1.56,3.72,2.5,6.08,2.5s4.52-.94,6.08-2.5c1.56-1.56,2.5-3.68,2.5-6.08v-.09h1.41Z'/%3e%3c/svg%3e)