
Int.J.Curr.Microbiol.App.Sci (2020) 9(4): 748-754
748
Original Research Article https://doi.org/10.20546/ijcmas.2020.904.089
Physiological Determinants and Yield Components as Influenced by High
Density Planting System in Cotton
T. Raghavendra* and Y. Rama Reddy
Regional Agricultural Research Station, Acharya N G Ranga Agricultural University,
Nandyal-518501, A.P. India
*Corresponding author
A B S T R A C T
Introduction
Cotton (Gossypium hirustum L.) is grown
globally as a major source of natural fiber and
is considered as white gold. In India cotton is
grown over an area of 122.38 lakh hectares
with production of 361 lakh bales with
productivity of 501 kg lint/ha. Among the
states Maharashtra, Gujarat and Telangana
were the major cotton growing states covering
around 70.45% (86.22 lakh hectare) in area
under cotton cultivation and 62.60% (226
lakh bales) of cotton production in India
(AICRP Annual Report cotton, 2018-19). In
India, the seed cotton yield per unit area is far
below than many other cotton growing
countries in the world. Among the various
factors responsible for low yield of cotton
crop in the country are low plant population
and use of low potential varieties.
International Journal of Current Microbiology and Applied Sciences
ISSN: 2319-7706 Volume 9 Number 4 (2020)
Journal homepage: http://www.ijcmas.com
High density planting system have the potential for increased yields in high yielding, high
input production systems. To attain higher yields in high density planting system in cotton
relative to conventional spaced cotton must depend on increased biomass production or
partitioning to boll. The present experiment was conducted for two consecutive seasons to
analyse the morpho- phenological characters and leaf CO2 exchange rates of cotton in five
different spacings i.e. 45 x 10 cm2, 45 x 15 cm2,45 x 20 cm2, 45 x 30 cm2 and 60 x 30 cm2
in two American cotton genotypes i.e NDLH1938 and NH 615.Wider spacing produced
significantly higher growth attributes like boll number (26.3) sympodia (12.4), leaf
photosynthetic rate (26.25 μmol m-2 sec-1) at peak bloom stage, stomatal conductance
(422.58 μmol H2O m-2 sec-1) and transpiration rate (4.89 mmol H2O m-2sec-1) at boll
formation stage.While in closer spacings early square formation and flowering was
observed, but dry matter partitioning was slower and total biomass production was
significantly low (78.6gm) and consequently the boll weight was less (3.2gm) leading to
decreased economic yield. The effect of plant density on leaf area index is additive and
varied with plant density from about 4.24- 5.78. Even though the density of plants was
increased there is seldom increment in kapas yield as the partitioning is affected due to
decrease in leaf CO2 exchange rates.
Keywords
High density
planting system,
Dry matter, Kapas
yield
Accepted:
07 March 2020
Available Online:
10 April 2020
Article Info

Int.J.Curr.Microbiol.App.Sci (2020) 9(4): 748-754
749
Cotton has indeterminate growth habit, the
crop shows morphological adaptations to its
growing environment such as modification in
canopy architecture in response to plant
population density. Morphological
adaptations in terms of canopy development,
light interception, source sink relationship and
assimilates partitioning are the major
determinant of lint yield and quality (Yang et
al., 2014).
The manipulation of row spacing, plant
density and the spatial arrangements of cotton
plants, for obtaining higher yield have been
attempted earlier by many researchers. The
concept on high density cotton planting, more
popularly called Ultra Narrow Row (UNR)
cotton was initiated by Briggs et al., (1967).
The availability of compact genotypes,
acceptance of weed and pest management
technologies including transgenics,
mechanized harvesting and widespread
application of growth regulators have made
these high density cotton production systems
successful in many countries (Rossi et al.,
2004). These advances lead to resurgence of
interest in high density, ultra narrow cotton
production systems, particularly in high
yielding systems than in the past. Clawson et
al., 2006 reported that higher plant population
resulted in reduced number of bolls per plant
and more bolls per unit area.
Reduced number of bolls resulted in earlier
maturity due to shorter flowering and fruiting
window. Growth analysis and physiological
determinants frame work (Coleman et al.,
1994) were used to identify the key factors in
influencing yield and maturity of high density
planting genotypes and conventionally spaced
cotton in high input system. The objective of
the study was to investigate the effect of
different planting densities on plant growth
and its attributing characters and CO2 gas
exchange parameters.
Materials and Methods
The field experiment was conducted in 2016
and 2017 at Acharya N G Agricultural
University, Regional Agricultural Research
Station, Nandyal (15027'N and 780 28'E) of
Andhra Pradesh. The soil of the experimental
field is black cotton soil, with PH 8.3 and EC
0.26 dS-m The experiment was laid out in Split
plot design, replicated three times with five
different spacings i.e. 45 x 10 cm2, 45 x 15
cm2,45 x 20 cm2, 45 x 30 cm2 and 60 x 30
cm2 as main plots and two American cotton
genotypes i.e. NDLH1938 and NH 615 as
subplots.
Photosynthetic attributes
Gaseous exchange parameters viz.,
photosynthetic rate (Pn), stomatal
conductance (gs), and transpiration rate (Tr)
of cotton leaves from 5 selected plants per
plot were determined with a CI-310 portable
photosynthesis system (CID, Inc., Camas,
WA, USA).Canopy photosynthetic rate was
measured between 9:00 to 11.00AM on clear
days and 4th fully expanded leaf from the apex
on the main stem at 50% flowering were
recorded. The assimilation chamber was
placed between the rows and the chamber was
covered to prevent air leakage from around
the bottom of the chamber. The CO2
concentrations inside the chambers ranged
from 350-400ppm during the gas sampling
times. The air temperature and relative
humidity were at ambient levels
Leaf morphological attributes
Five plants were randomly selected in each
plot for determination of specific leaf area,
and leaf area index was calculated on ground
area basis. After drying at 80oC to a constant
weight, samples were weighed, and the yields
of seed cotton and stalk (root, stem, branches,
carpels and remnant leaves) were recorded.

Int.J.Curr.Microbiol.App.Sci (2020) 9(4): 748-754
750
Dry weights of reproductive organs (squares,
flowers, green and mature bolls) were
weighed after drying at least for 48 h at 80oC.
Statistical Analysis
All data recorded were analyzed with the help
of analysis of variance (ANOVA) technique
(Gomez and Gomez 1984) for split plot using
STAR (Statistical tool for agricultural
research, IRRI).
Results and Discussion
High density planting system has significant
affect on canopy architecture and growth of
the crop. Plant height was (146.3 cm) at 45 x
10 cm2 and at significantly the plant height
was less (128.3 cm) at 60 x 30 cm2. The
possible explanation for more height in close
spacings may be due to increased competition
for sunlight as the architecture of the canopy
is more of vertical orientation. Paslawar et al.,
2015 reported that plant height was
significantly highest in narrow row planting
i.e 45 x 10 cm2.
Boll number and boll weight were
significantly low in closer spacings compared
to wider spacings. Higher boll number (26.3)
and boll weight (4 gm) were recorded in 60 x
30 cm2 as wider spacings have more
photosynthetic area and more partitioning
compared to narrow spacings as light is a
limiting factor (Table 1). Ramesh et al., 2016
reported that higher boll number and boll
weight were observed in wider row spacings
under high density planting system.
Sympodial branches are significantly lower in
closer spacings i.e 7.8 at 45 x 10 cm2
compared to wider spacings 12.4 at 60 x 30
cm2 and with increase in spacing between the
plants the sympodia per unit plant were
increased. The results are in agreement with
the results of Manjula and shashidhara 2017,
who reported that number of monopodia,
sympodia and dry weights of the plant were
significantly higher with wider spacings.
In the present study, increased plant density
significantly decreased biological yield, and
there was a significant effect of plant density
with genotypes on cotton yield. Leaf area
index (LAI) varied with plant density from
about 4.24- 5.78.The effect of plant density
on LAI is additive. Lili mao et al., (2014)
reported that Leaf area index was affected by
plant densities. LAI varied with plant density,
from about 2.5 to 5.0 and the reduction of
LAI was readily compensated at higher plant
density. Thus, it is very important to decrease
plant density for yield stability by increasing
biological yield. Reasonable changes in leaf
area index are important guarantee of high
cotton yield (Dong et al., 2006).
Specific leaf area is mostly affected by
changes in light conditions as plant develops
as it plays a key role in morphological
acclimation to changes in the spatial
distribution of light within plant canopies.
Efficient light harvesting plays a prominent
role in for plant growing in dense stand.
Because of the less assimilates production in
high density crop the upper canopy leaves are
thin and more specific leaf area (SLA). In the
current research low SLA (15.34) at peak
vegetative stage in 60 x 30 cm2 was observed.
Canopy with normal spacings have thick
leaves because of greater advantage of light
and eventually thick leaves with low SLA
have greater photosynthetic capacity than thin
leaves with high SLA (Hesheng Yao et al.,
2016).
The higher rate of biomass accumulation in
the high density crop early in the season but
not later in the season compared to
conventionally spaced crop was most likely
due to increased competition between the
plants for resources limiting growth of plants
in high density crop earlier than the
Int.J.Curr.Microbiol.App.Sci (2020) 9(4): 748-754
751
conventionally spaced crop. Despite an
increase in population the final biomass
production was similar with wider spacings. It
is in the range of 78.6 g/plant to 93.8 g/plant.
Individually the plants were smaller and with
less biomass produced per plant indicating
that there is a limitation in assimilate for
growth and development due to competition
between the plants.
Gwathmey and clement (2010) reported that
ultra-narrow row cotton had low boll set and
lower starch reserves as compared with
conventionally spaced rows, supporting the
hypothesis that photosynthetic assimilate may
be limiting in ultra-narrow row plants.
Gas exchange measurements
Photosynthetic rate of cotton plant was
significantly affected by plant density during
in all growth stages and maximum at peak
bloom phase (Table 2). Among the spacings
photosynthetic rate was maximum i.e. 25.65
and 26.25 (μmol m-2 sec-1) at 60 x 30 cm2 both
at squaring and peak bloom phases and
decreased at boll formation stage i.e. 25.12
(μmol m-2 sec-1). Aziz khan et al., 2017
reported that photosynthetic rate increased as
the crop transitioned from one stage to
another but it decreased during boll opening
stage and plants sown early exhibited 10%
and 16% higher photosynthetic rate than late
sown plants at squaring and first bloom stage,
respectively.
Stomatal conductivity was higher at wider
spacings comparatively to closer spacings as
the interception of light played a key role in
stomata opening and closing, which is directly
correlated to the water use efficiency and
exacerbates the dry matter partitioning and
photosynthetic assimilates production by
decrease in vapour pressure deficit (VPD).
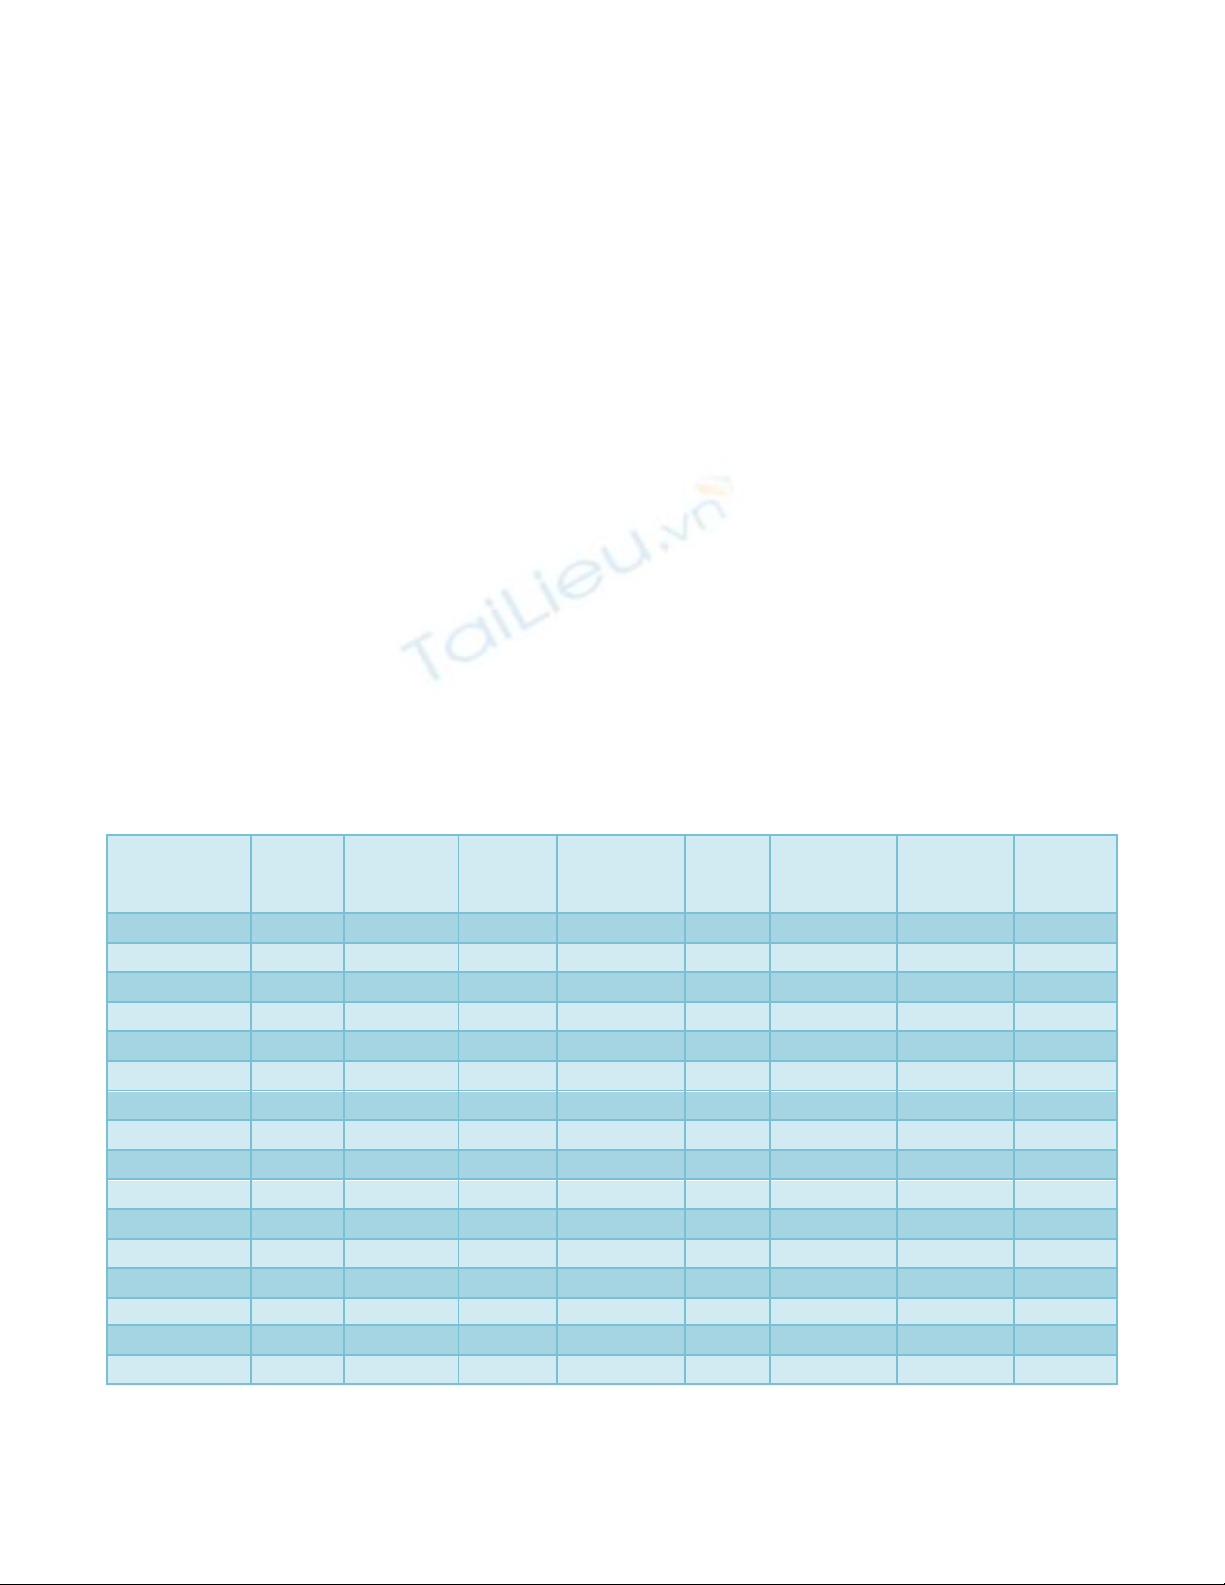
Table.1 Plant morpho-phenological characters as influenced by different spacings and varieties
Treatments
Plant
height
(cm)
Boll
Number
Boll
weight
(gm)
No. of
sympodia/
plant
Leaf
area
index
Specific
leaf area
(cm2/gm)
Biomass
g/ plant
Kapas
yield
kg/ha
Spacings
45 x 10 cm
146.3
15.2
3.2
7.8
5.78
20.37
78.6
1550
45 x 15 cm
135.8
16.4
3.3
8.1
4.80
17.20
77.4
1773
45 x 20 cm
137.9
18.6
3.6
8.2
4.34
15.58
81.2
1874
45 x 30 cm
138.2
21.2
3.8
10.5
4.10
15.60
84.2
1890
60 x 30 cm
128.3
26.3
4.0
12.4
4.24
15.34
93.8
2211
S.Em±
4.2
0.97
0.03
0.52
0.23
0.91
6.1
117
CD at 5%
16
3.12
0.08
1.74
1.3
4.2
NS
424
Varieties
NDLH1938
121
26.8
3.9
12.4
5.2
13.2
95.4
2261
NH615
95
32.4
3.7
15.8
4.5
14.2
93.2
2566
S.Em±
2.6
1.1
0.02
0.42
0.19
0.52
1.84
214
CD at 5%
8.1
3.9
0.06
1.34
0.55
NS
NS
NS
Interaction
S.Em±
6.7
1.2
0.18
0.45
0.15
0.2
5.8
110
CD at 5%
NS
NS
NS
NS
NS
NS
NS
NS
NS- Non Significant
Int.J.Curr.Microbiol.App.Sci (2020) 9(4): 748-754
752
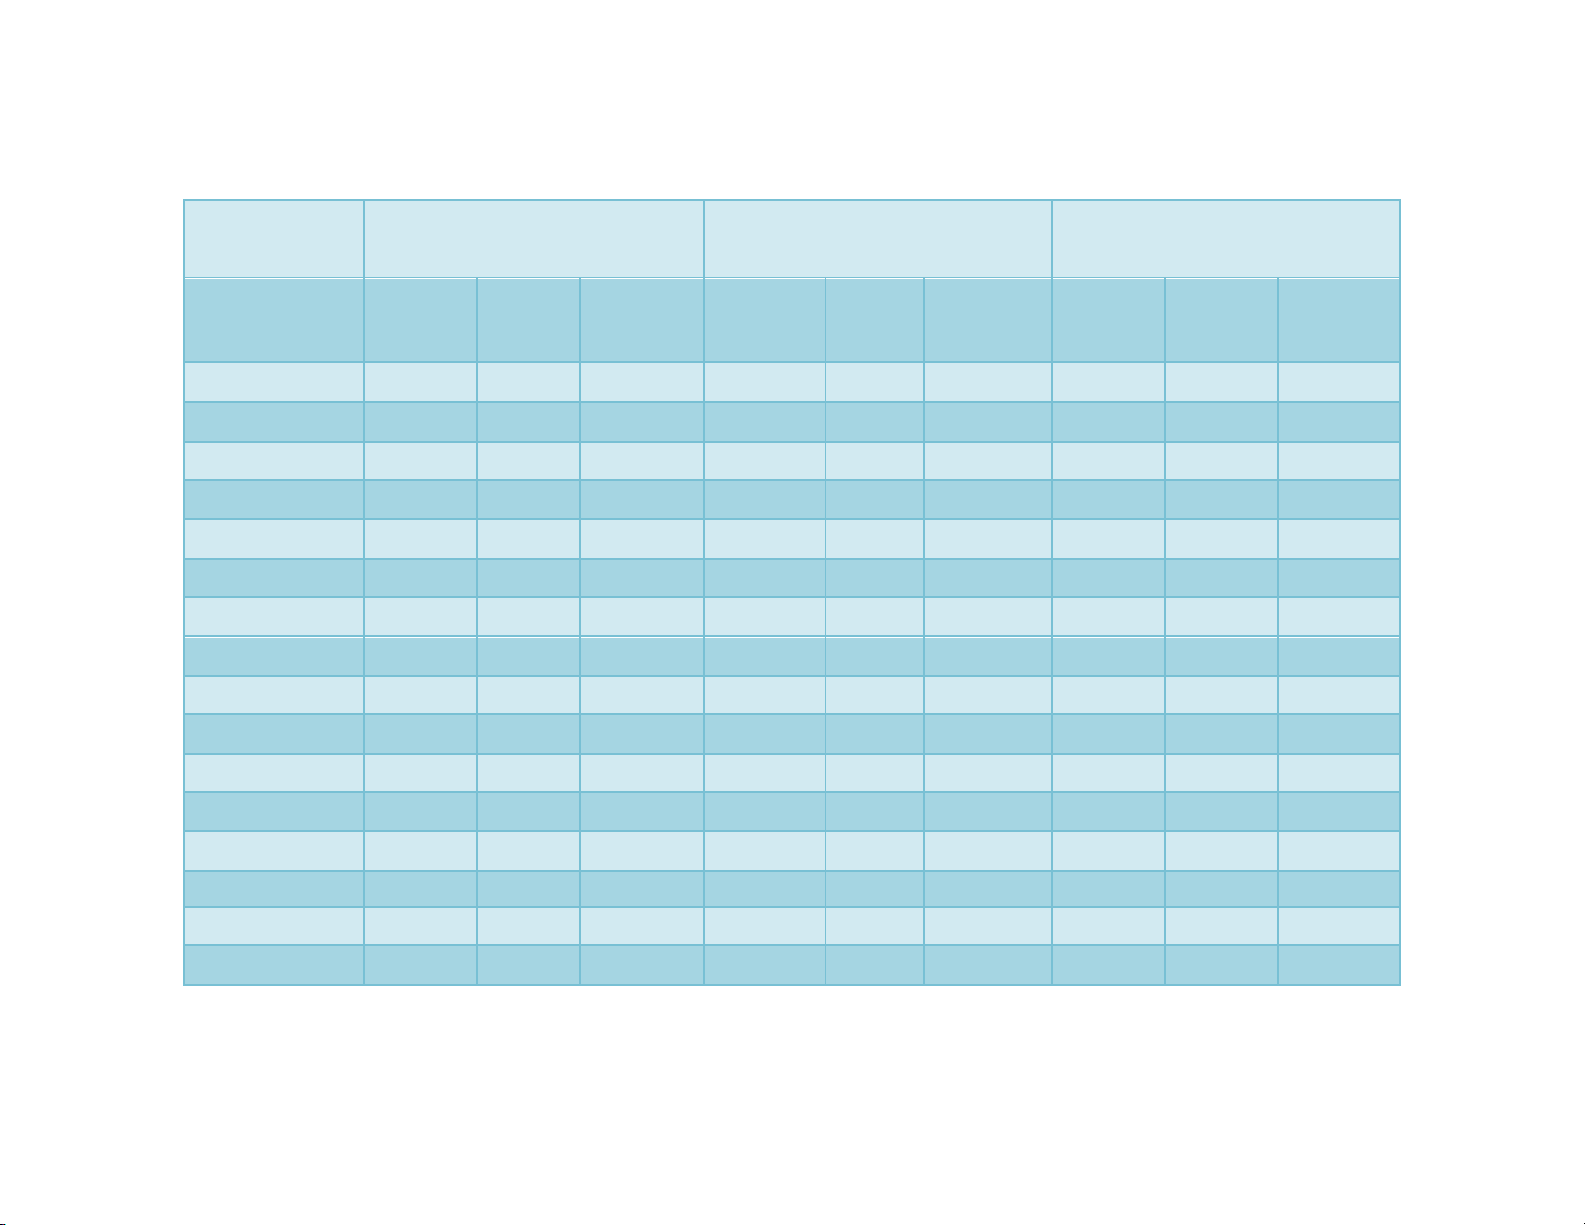
Table.2 Leaf CO2 gas exchange parameters as influenced by different spacings and varieties
Treatments
Photosynthetic rate
(μmol m-2 sec-1)
Stomatal conductance
(μmol H2O m-2 sec-1)
Transpiration rate
(mmol H2O m-2sec-1)
Squaring
40DAE
Peak
bloom
90DAE
Boll
formation
120DAE
Squaring
40DAE
Peak
bloom
90DAE
Boll
formation
120DAE
Squaring
40DAE
Peak
bloom
90 DAE
Boll
formation
120DAE
Spacings
45 x 10 cm
23.12
23.57
22.15
396.54
406.54
411.25
3.01
3.55
3.81
45 x 15 cm
23.45
24.12
23.45
401.25
411.25
418.51
3.11
3.37
3.97
45 x 20 cm
23.81
24.25
23.64
405.28
415.28
419.25
3.81
4.18
4.21
45 x 30 cm
24.35
25.24
24.41
408.65
418.65
421.74
4.01
4.27
4.41
60 x 30 cm
25.65
26.25
25.12
401.24
421.24
422.58
4.19
4.69
4.89
S.Em±
0.60
0.45
0.39
2.41
3.91
3.45
0.019
0.023
0.027
CD at 5%
1.25
1.40
1.18
7.83
8.17
8.02
0.057
0.077
0.081
Varieties
NDLH1938
24.44
25.14
26.12
403.25
410.25
414.25
3.10
5.10
4.99
NH615
25.64
26.14
27.84
413.15
433.15
425.36
3.86
4.86
5.01
S.Em±
0.31
0.29
0.19
4.12
4.12
3.99
0.016
0.026
0.024
CD at 5%
0.84
0.88
0.60
11.5
11.5
NS
0.051
0.081
NS
Interaction
S.Em±
1.9
1.4
1.6
4.85
5.01
5.31
0.021
0.025
0.031
CD at 5%
NS
NS
NS
NS
NS
NS
NS
NS
NS
DAE- Days after emergence
NS- Non Significant


![Giáo trình Đất trồng phân bón (Nghề Bảo vệ thực vật CĐ/TC) - Trường Cao đẳng Gia Lai [Mới Nhất]](https://cdn.tailieu.vn/images/document/thumbnail/2026/20260224/hoacattuong2026/135x160/9591771994804.jpg)
![Giáo trình Kỹ thuật canh tác cây lương thực (Nghề Bảo vệ thực vật - CĐ/TC) - Trường Cao đẳng Gia Lai [Mới nhất]](https://cdn.tailieu.vn/images/document/thumbnail/2026/20260224/hoacattuong2026/135x160/12471771994805.jpg)


![Giáo trình Công nghệ sau thu hoạch (Nghề Bảo vệ thực vật - CĐ) - Trường Cao đẳng Đà Lạt [Mới nhất]](https://cdn.tailieu.vn/images/document/thumbnail/2026/20260224/hoacattuong2026/135x160/32161772096417.jpg)
